. 2021 Dec 16;71(1):242-258.
doi: 10.1093/sysbio/syab030.

Fossil-Informed Models Reveal a Boreotropical Origin and Divergent Evolutionary Trajectories in the Walnut Family (Juglandaceae)

Affiliations

Fossil-Informed Models Reveal a Boreotropical Origin and Divergent Evolutionary Trajectories in the Walnut Family (Juglandaceae)

Qiuyue Zhang et al. Syst Biol. .

Erratum in

Abstract

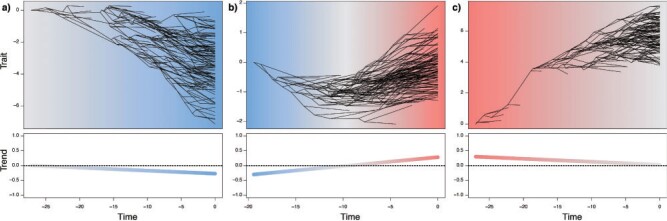
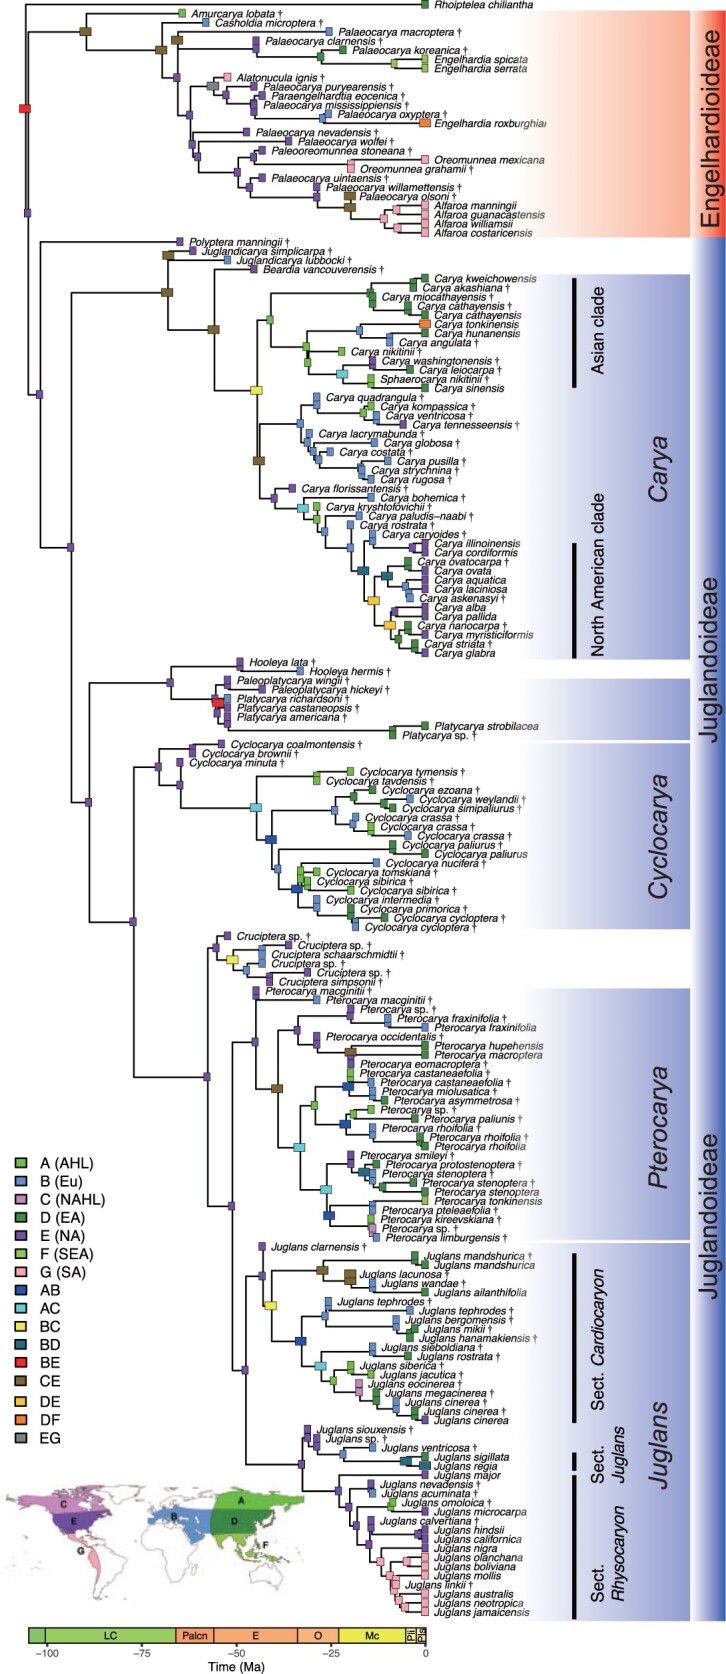
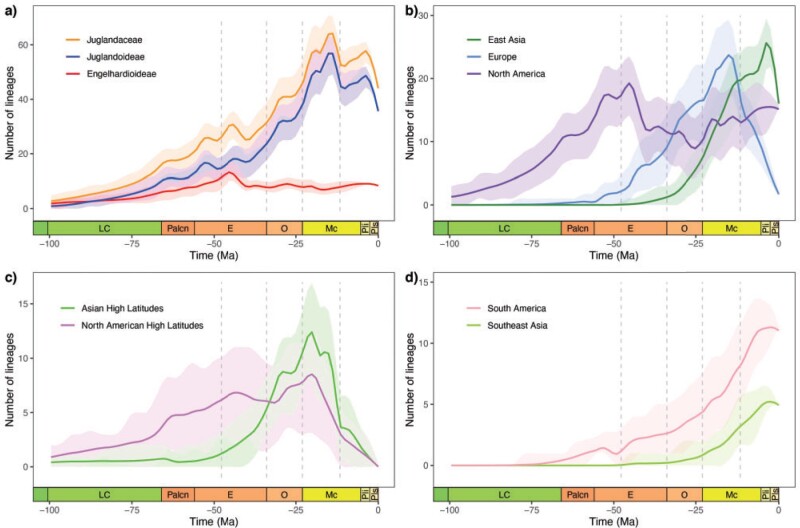
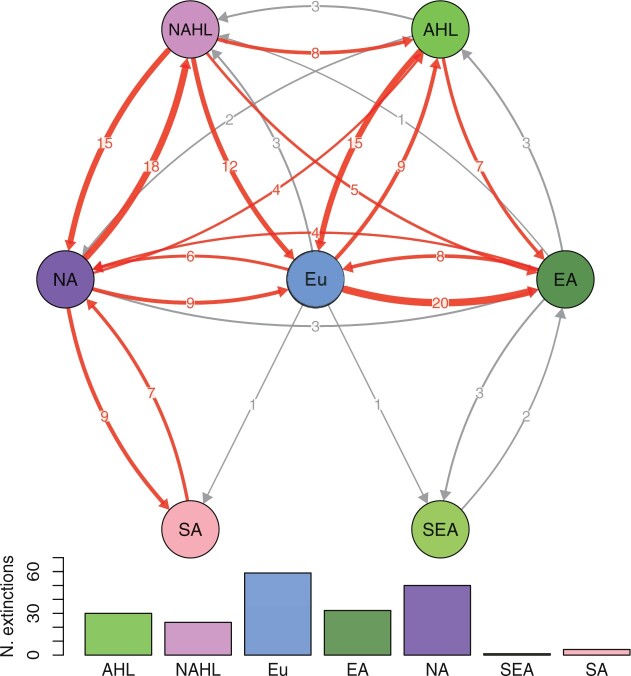
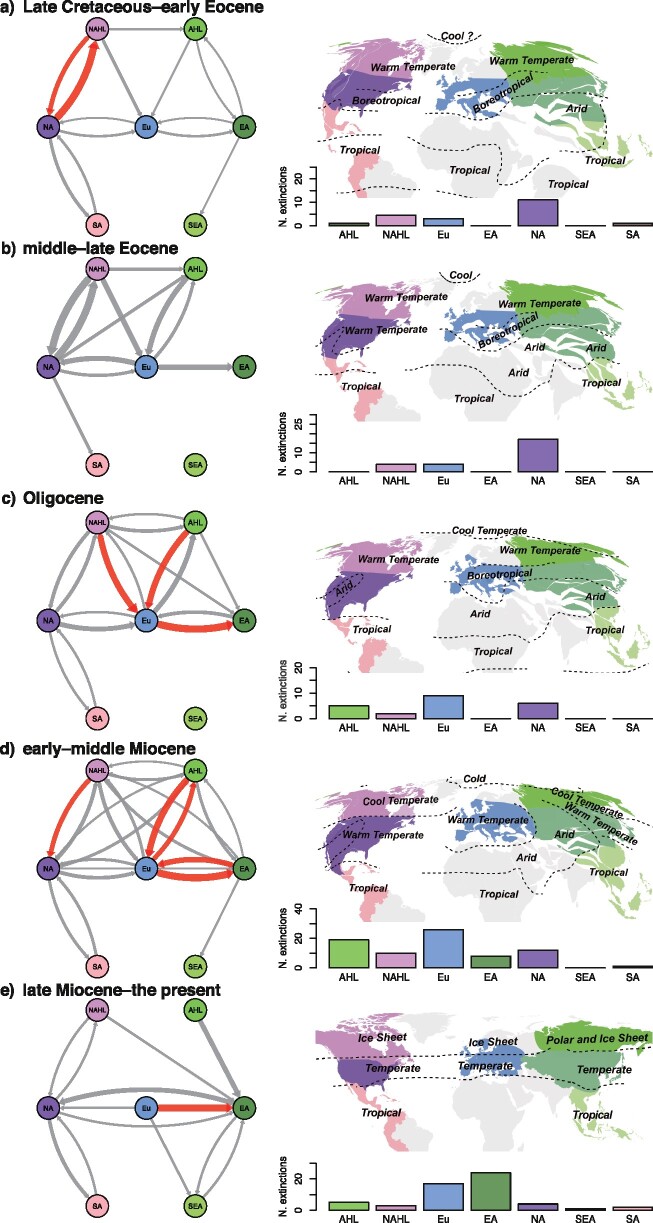
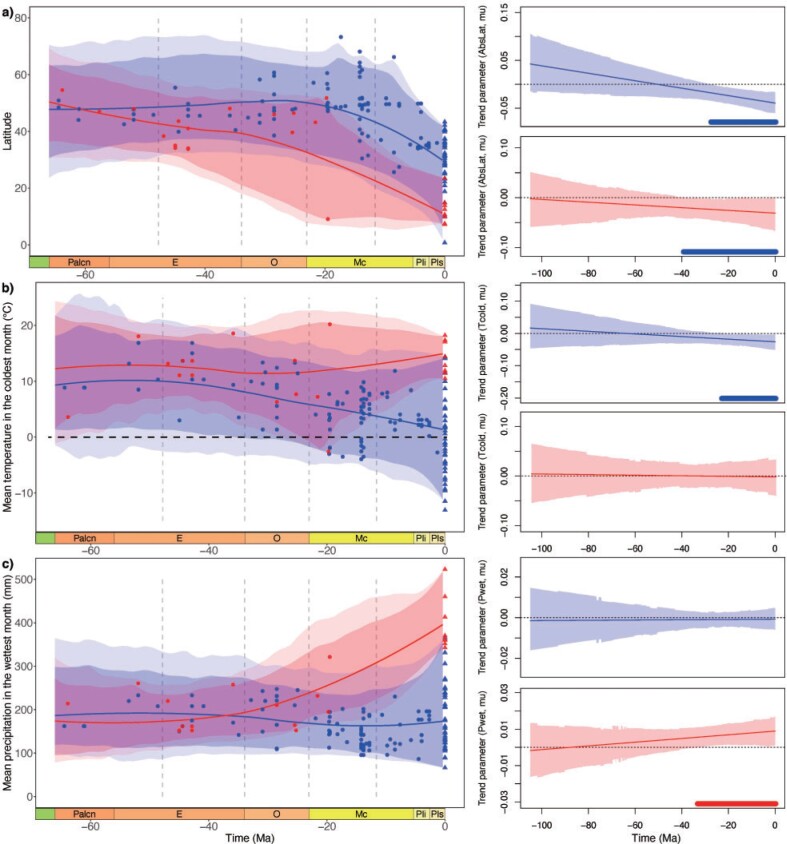
Temperate woody plants in the Northern Hemisphere have long been known to exhibit high species richness in East Asia and North America and significantly lower diversity in Europe, but the causes of this pattern remain debated. Here, we quantify the roles of dispersal, niche evolution, and extinction in shaping the geographic diversity of the temperate woody plant family Juglandaceae (walnuts and their relatives). Integrating evidence from molecular, morphological, fossil, and (paleo)environmental data, we find strong support for a Boreotropical origin of the family with contrasting evolutionary trajectories between the temperate subfamily Juglandoideae and the tropical subfamily Engelhardioideae. Juglandoideae rapidly evolved frost tolerance when the global climate shifted to ice-house conditions from the Oligocene, with diversification at high latitudes especially in Europe and Asia during the Miocene. Subsequent range contraction at high latitudes and high levels of extinction in Europe driven by global cooling led to the current regional disparity in species diversity. Engelhardioideae showed temperature conservatism while adapting to increased humidity, tracking tropical climates to low latitudes since the middle Eocene with comparatively little diversification, perhaps due to high competition in the tropical zone. The biogeographic history of Juglandaceae shows that the North Atlantic land bridge and Europe played more critical roles than previously thought in linking the floras of East Asia and North America, and showcases the complex interplay among climate change, niche evolution, dispersal, and extinction that shaped the modern disjunct pattern of species richness in temperate woody plants. [Boreotropical origin; climatic niche evolution; disjunct distribution; dispersal; diversity anomaly; extinction; Juglandaceae.].


Figures

Figure 1.
Figure 1.
Three simulated scenarios of the BMVT (Brownian evolution with a time-variable trend) process with neutral to negative trend (a), negative to positive trend (b), and positive to neutral trend (c). The three upper panels show trait evolution across a simulated tree, and the three lower panels show the corresponding trend parameter through time. The blue shades represent a negative trend pushing the trait toward smaller values, gray represents trends around 0, that is, neutral evolution, and red represents a positive trend which favors larger trait values.
Figure 2.
Figure 2.
Biogeographic reconstruction of Juglandaceae based on extant and extinct species under Dispersal-Extinction-Cladogenesis model. The probabilities of ancestral states are averaged over 100 trees and plotted on master tree. A formula image Asian High Latitudes; B formula image Europe; C formula image North American High Latitudes; D formula image East Asia; E formula image North America; F formula image Southeast Asia; G formula image South America. Symbol “† ” represents fossil species. Geological time abbreviations: LC formula image Late Cretaceous; Palcn formula image Paleocene; E formula image Eocene; O formula image Oligocene; Mc formula image Miocene; Pli formula image Pliocene; Pls formula image Pleistocene.
Figure 3.
Figure 3.
Lineage accumulation through time in different clades and regions of extant and extinct species of Juglandaceae. Geological time abbreviations: LC formula image Late Cretaceous; Palcn formula image Paleocene; E formula image Eocene; O formula image Oligocene; Mc formula image Miocene; Pli formula image Pliocene; Pls formula image Pleistocene. The lines are mean values and the shaded areas represent 95% credible intervals.
Figure 4.
Figure 4.
Dispersal and extinction events of extant and extinct species of Juglandaceae during the entire Cenozoic. Bar plots show the number of local extinction events during the entire Cenozoic. Region abbreviations: AHL formula image Asian High Latitudes; NAHL formula image North American High Latitudes; Eu formula image Europe; EA formula image East Asia; NA formula image North America; SEA formula image Southeast Asia; SA formula image South America. The thickness of the arrows represents the number of dispersal events. Red arrows indicate that the dispersal events are more than or equal to four events.
Figure 5.
Figure 5.
Dispersal and extinction events of extant and extinct species of Juglandaceae across five time bins. a) Late Cretaceous–early Eocene, b) middle–late Eocene, c) Oligocene, d) early–middle Miocene, and e) late Miocene–the present. Networks depict dispersal events during different time bins. Bar plots show the number of local extinction events during different time bins. The paleoclimate maps for a–d) are modified from Boucot et al. (2013). The paleoclimate map for e) is modified from Ray and Adams (2001). Region abbreviations: AHL formula image Asian High Latitudes; NAHL formula image North American High Latitudes; Eu formula image Europe; EA formula image East Asia; NA formula image North America; SEA formula image Southeast Asia; SA formula image South America. The thickness of the arrows represents the number of dispersal events. Red arrows indicate that the dispersal events are more than or equal to four events.
Figure 6.
Figure 6.
Accuracy of parameter estimation summarized across 190 simulated trees with traits evolving under a BMVT model. To simulate the incompleteness of the fossil record, 80% of the extinct tips were dropped from the complete trees prior to their analysis. a–d) The log-transformed squared errors of parameter estimates based obtained from fitting BM, BMT, and BMVT models (when BMVT is true). e–h) The log squared errors of the estimated parameters plotted against tree size (after subsampling the extinct tips) under BMVT model. For ancestral states (d, h), we report the log-transformed mean squared error across all internal nodes of the tree.
Figure 7.
Figure 7.
Latitude and climate niche evolution of mean temperature in the coldest month and mean precipitation in the wettest month for subfamilies Juglandoideae and Engelhardioideae during the Cenozoic. Geological time abbreviations: LC formula image Late Cretaceous; Palcn formula image Paleocene; E formula image Eocene; O formula image Oligocene; Mc formula image Miocene; Pli formula image Pliocene; Pls formula image Pleistocene. Lines indicate mean values and the shaded areas represent 95% and 99% credible intervals. Blue represents the clade of Juglandoideae and the red represents Engelhardioideae. Circles represent fossil occurrences and the triangles represent extant species. The frost tolerance is shown below the dotted black line (0formula image in (b). The right column shows the estimated trend parameters for subfamilies Juglandoideae (blue) and Engelhardioideae (red). Thin lines indicate mean values and the shaded areas represent 95% credible intervals. Bold lines at the bottom of the plots indicate the periods of time with significantly negative (blue) or positive (red) estimated trends. AbsLat formula image Absolute Latitude; Tcold formula image mean temperature of the coldest month; Pwet formula image mean precipitation of the wettest month.

Similar articles

Cited by

References

    1. Adrain J.M., Westrop S.R. 2003. Paleobiodiversity: we need new data. Paleobiology 29:22–25.
    1. Aradhya M.K., Potter D., Simon C.J. 2006. Cladistic biogeography of Juglans (Juglandaceae) based on chloroplast DNA intergenic spacer sequences. Darwin’s harvest: new approaches to the origins, evolution and conservation of crops. New York: Columbia University Press. p. 143–170.
    1. Aradhya M.K., Potter D., Gao F., Simon C.J. 2007. Molecular phylogeny of Juglans (Juglandaceae): a biogeographic perspective. Tree Genet. Genomes 3:363–378.
    1. Axelrod D.I. 1983. Biogeography of oaks in the Arcto-Tertiary province. Ann. Mo. Bot. Gard. 70:629–657.
    1. Bacon C.D., Silvestro D., Jaramillo C., Smith B.T., Chakrabarty P., Antonelli A. 2015. Biological evidence supports an early and complex emergence of the Isthmus of Panama. Proc. Natl. Acad. Sci. USA 112:6110–6115. - PMC - PubMed

Publication types