. 2021 May 17;56(10):1526-1540.e7.
doi: 10.1016/j.devcel.2021.04.017. Epub 2021 May 7.

Cochlear supporting cells require GAS2 for cytoskeletal architecture and hearing

Affiliations

Cochlear supporting cells require GAS2 for cytoskeletal architecture and hearing

Tingfang Chen et al. Dev Cell. .

Abstract

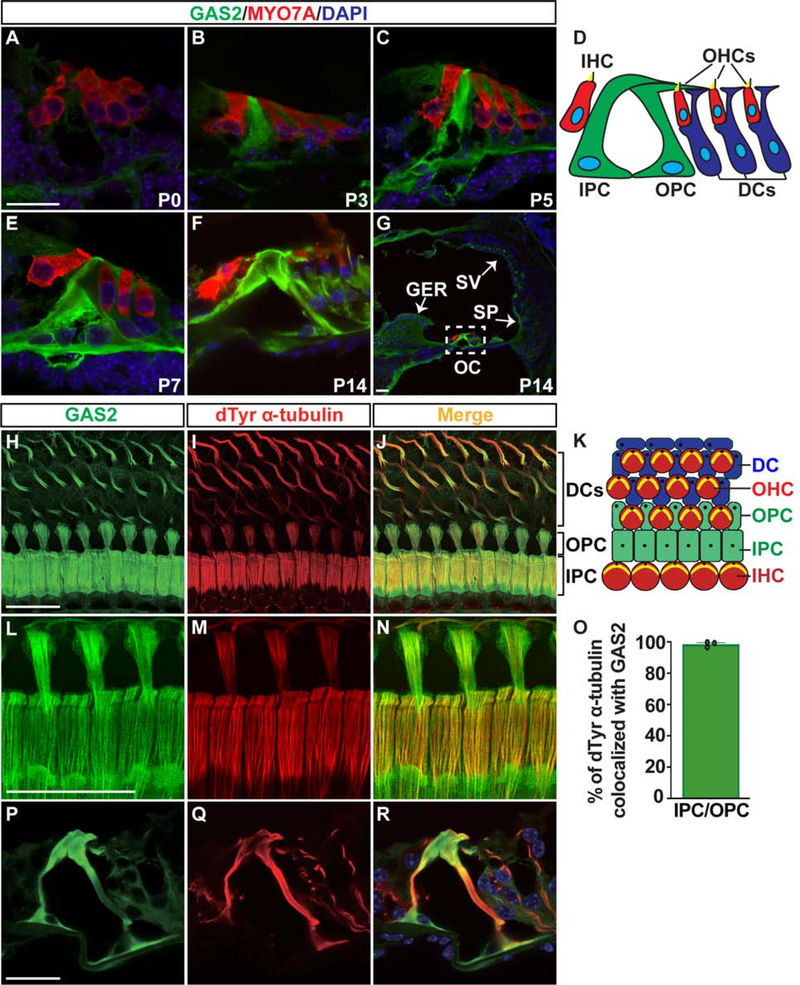
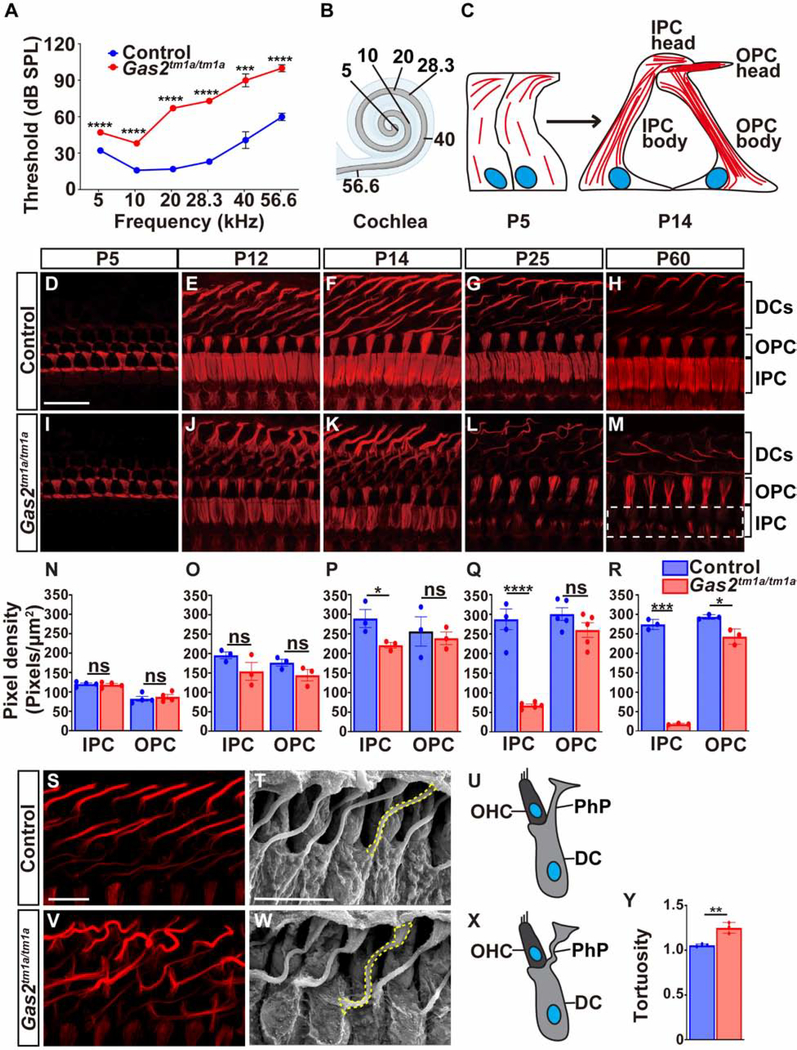
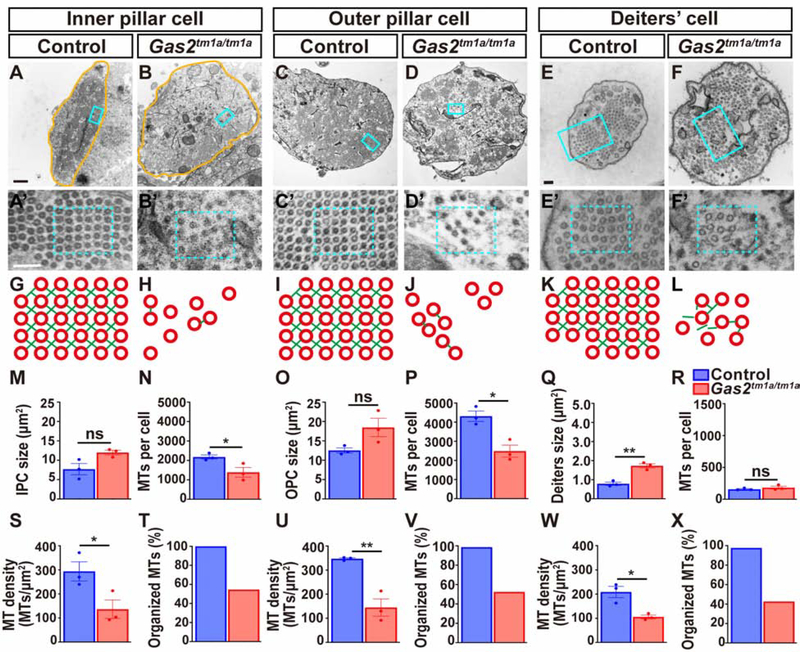
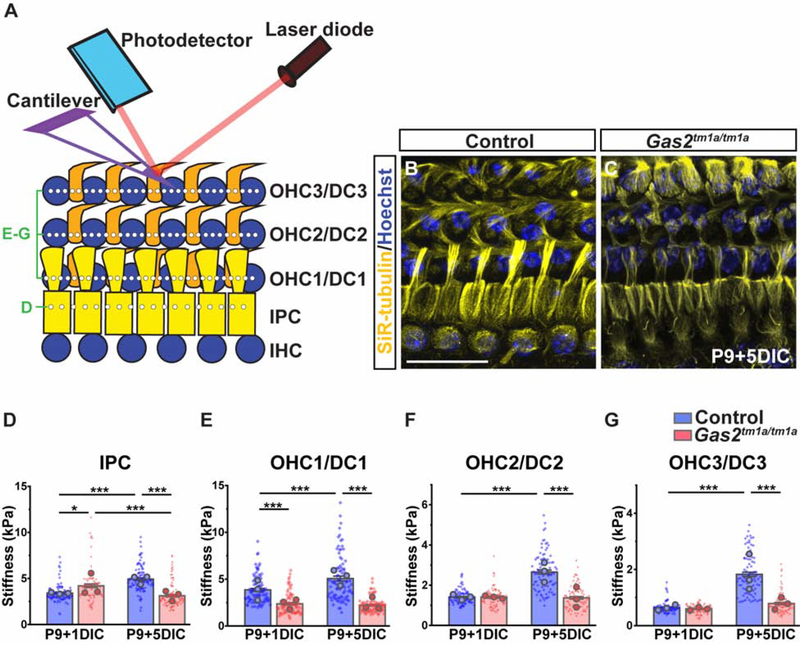
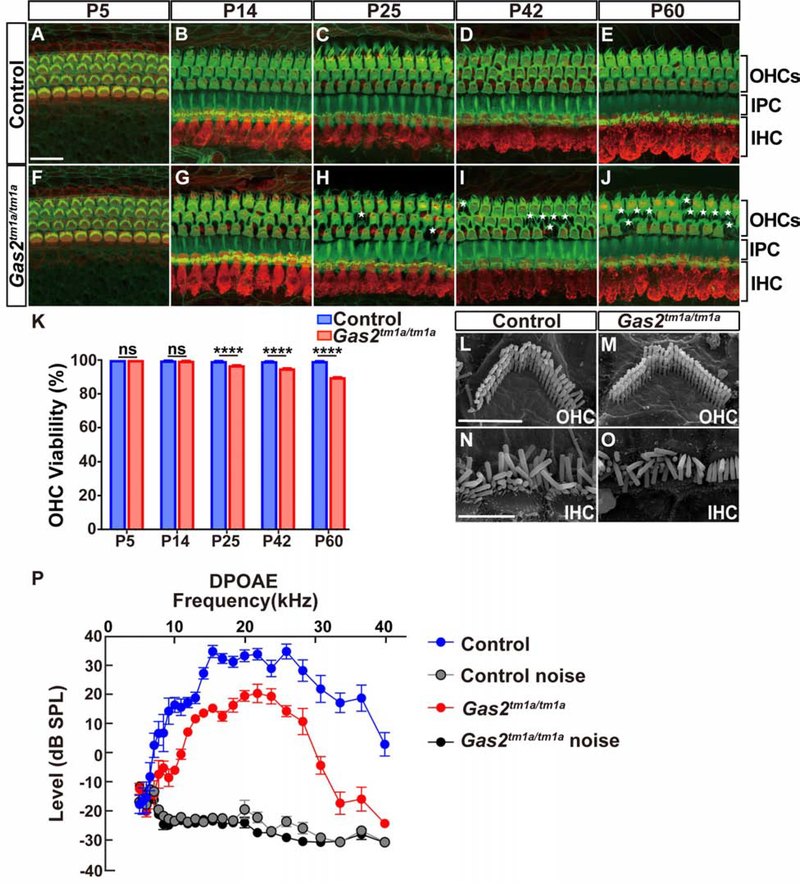
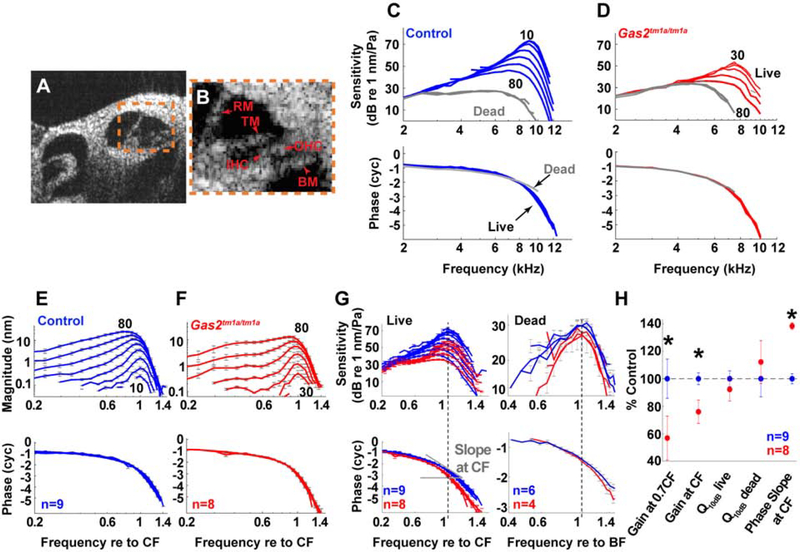
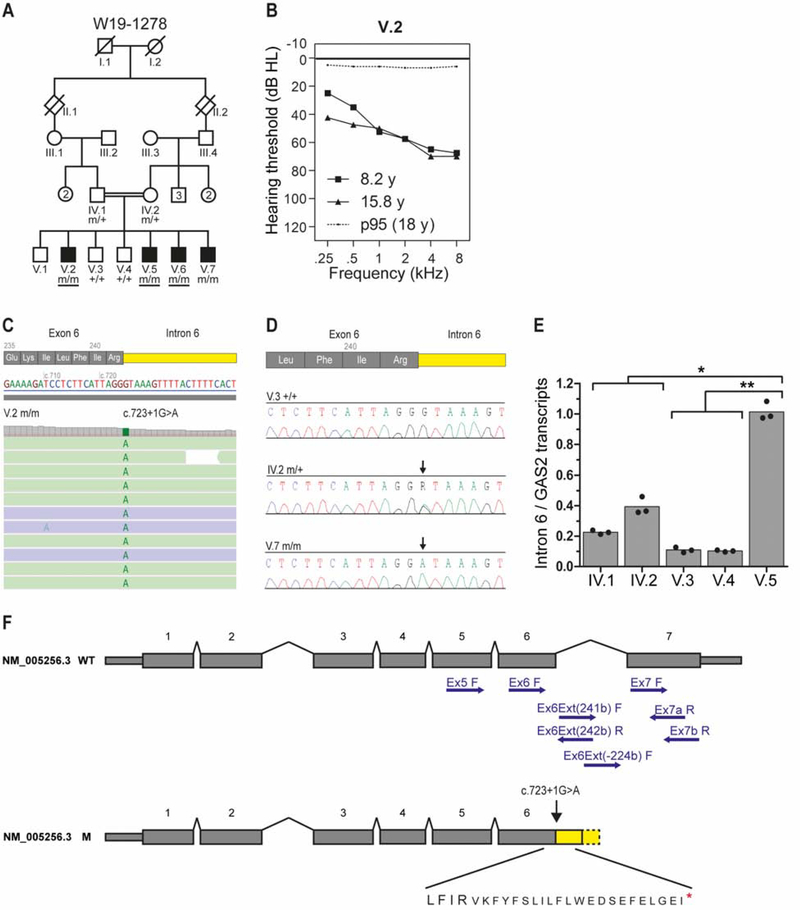
In mammals, sound is detected by mechanosensory hair cells that are activated in response to vibrations at frequency-dependent positions along the cochlear duct. We demonstrate that inner ear supporting cells provide a structural framework for transmitting sound energy through the cochlear partition. Humans and mice with mutations in GAS2, encoding a cytoskeletal regulatory protein, exhibit hearing loss due to disorganization and destabilization of microtubule bundles in pillar and Deiters' cells, two types of inner ear supporting cells with unique cytoskeletal specializations. Failure to maintain microtubule bundle integrity reduced supporting cell stiffness, which in turn altered cochlear micromechanics in Gas2 mutants. Vibratory responses to sound were measured in cochleae from live mice, revealing defects in the propagation and amplification of the traveling wave in Gas2 mutants. We propose that the microtubule bundling activity of GAS2 imparts supporting cells with mechanical properties for transmitting sound energy through the cochlea.

Keywords: Gas2; cochlea; cochlear mechanics; cytoskeleton; hearing loss; microtubules; supporting cells.


Conflict of interest statement

Declaration of interests The authors declare no competing interests.

Figures

Figure 1.
Figure 1.. GAS2 localizes to supporting cell microtubules in the postnatal cochlea.
(A-G) Transverse sections through the cochlea at postnatal stages stained for GAS2 (green), the unconventional Myosin VIIA protein (MYO7A), which labels hair cells (red), and the 4’, 6-diamidino-2-phenylindole (DAPI) stain, which labels DNA (blue). Within the organ of Corti, GAS2 is expressed in pillar and Deiters’ cells and is absent from hair cells. (D) Schematic illustration of cell types in the organ of Corti from a transverse view. (H-Q) Co-immunostaining of GAS2 and de-Tyrosinated α-tubulin (dTyr α-tubulin) on whole mount cochlear preparations at P14 (H-J), P25 (L-N), and transverse sections through the organ of Corti at P25 (P-R). The high-resolution confocal images (Airyscan) in (L-N) show extensive co-localization of GAS2 and dTyr α-tubulin along the length of microtubule bundles in the heads of inner and outer pillar cells, as quantified in (O) (one sample T-test, three inner and outer pillar cells were analyzed per sample, from three mice). (K) Schematic illustration of cell types in the organ of Corti as viewed from the luminal surface. Scale bar = 20 μm. Abbreviations: Deiters’ cell (DC), greater epithelial ridge (GER), inner hair cell (IHC), inner pillar cell (IPC), organ of Corti (OC), outer hair cell (OHC), outer pillar cell (OPC), spiral prominence (SP), stria vascularis (SV).
Figure 2.
Figure 2.. Gas2tm1a/tm1a mice display hearing loss and defects in supporting cell microtubules.
(A) ABR thresholds are elevated in Gas2tm1a/tm1a (n=6) compared to control (n=5) mice at P56 (***p<0.001, ****p<0.0001, multiple T-test with Holm-Sidak method). (B) Schematic representation of the tonotopic organization of the cochlear duct. (C) Illustration of microtubule bundle assembly at apical (head) and longitudinal (body) positions of inner and outer pillar cells. Microtubules are drawn in red and the nucleus in blue. (D-M) Time course analysis of dTyr α-tubulin immunostaining on whole mount cochlear preparations from control and Gas2tm1a/tm1a mutants. The heads of inner pillar cells show a progressive destabilization of microtubule bundles that are almost completely absent at P60 (dotted white box). (N-R) Quantification of dTyr α-tubulin pixel density in pillar cells from control and Gas2tm1a/tm1a mice presented as mean ±SEM (*p<0.05, ****p<0.0001, two-tailed t-test, six cells were analyzed per mouse, from a minimum of three mice, ns: not significant). (S,V) Whole mount dTyr α-tubulin immunostaining of cochlear preparations from control and Gas2tm1a/tm1a mice at P25 showing microtubule disorganization in Deiters’ cell phalangeal processes. SEM images (T,W) and schematic illustrations (U,X) of Deiters’ cells from control and Gas2tm1a/tm1a mice at P25 showing increased tortuosity of phalangeal processes (yellow dashed line) quantified in (Y) (**p<0.01, two-tailed t-test; four cells were analyzed per sample, n=3, error bars represent SEM). Scale bar = 20 μm (D), 10 μm (S), 10 μm (T). Abbreviations: Deiters’ cell (DC), inner pillar cell (IPC), outer pillar cell (OPC), outer hair cell (OHC), phalangeal process (PhP).
Figure 3.
Figure 3.. Cytoskeletal ultrastucture is dependent on GAS2.
(A-F) Transmission electron micrographs through the body of inner and outer pillar cells, and a Deiters’ cell phalangeal process from control and Gas2tm1a/tm1a mice at P25. (A’- F’) Enlargement of boxed areas from A-F. (G-L) Schematic illustration of cytoskeletal organization corresponding to boxed regions in A’-F’. Note the disorganization and destabilization of microtubule arrays and disruption of actin (green) and microtubule (red) cross-links in Gas2tm1a/tm1a mice. (M-X) Quantification of cell size, microtubule number, density and organization in pillar and Deiters’ cells presented as mean ± SEM. (*p<0.05, **p<0.01, two-tailed t-test, three cells were analyzed per sample, n=3 samples, ns: not significant). Scale bars = 500nm (A), 100nm (A’, E, E’).
Figure 4.
Figure 4.. Supporting cells are less stiff in the absence of GAS2.
(A) Illustration of experimental approach for measuring supporting cell mechanical properties by AFM. (B, C) Cochlear explants isolated from Gas2tm1a/tm1a mice at P9 and grown for 5 days in culture (DIC) recapitulate supporting cell microtubule defects when compared to control mice as indicated by SiR tubulin (yellow) and Hoechst (blue) staining. Scale bar = 20μm (D-G) Quantification of stiffness in pillar cells (D) and individual OHC/Deiters’ cell (DC) rows (E-G). The data are presented as mean ±SEM of 30 measurements (diamonds) at 2μm increments along each cell row, which was repeated for all rows in three independent cochlear samples (mean for each cochlea is shown as large circle) (*p<10−3, ***p<10−6, two-way ANOVA on cellular measurements with post hoc Bonferroni comparison, factors of genotype and DIC).
Figure 5.
Figure 5.. Outer hair cell function is compromised in Gas2tm1a/tm1a mice.
(A-J) Time course analysis of MYO7A (red) and F-actin (green) immunostaining on whole mount cochlear preparations from control and Gas2tm1a/tm1a mice (n=3 per timepoint). A small number of OHCs are lost over time (indicated by asterisk). Scale bar = 20μm. (K) Quantification of OHC viability (****P<0.001, Fisher’s Exact Test, ns: not significant). (L-O) SEM images of OHCs (L, M) and IHCs (N, O) from control and Gas2tm1a/tm1a mice at P60, showing normal stereocilia morphology. Scale bars = 3μm (L) and 5μm (P). (P) DPOAEs are significantly reduced in Gas2tm1a/tm1a (n=5) compared to control mice (n=6) at P56 (p<0.05, multiple T-test with Holm-Sidak method). Abbreviations: inner hair cell (IHC), inner pillar cell (IPC), outer hair cells (OHCs), and outer pillar cell (OPC). Abbreviations: inner hair cell (IHC), inner pillar cell (IPC), outer hair cells (OHCs), and outer pillar cell (OPC).
Figure 6.
Figure 6.. Vibratory responses to sound are impaired in live Gas2tm1a/tm1a mice.
(A) Cross-sectional image of the apical cochlear duct of a mouse obtained with VOCTV. (B) Enlargement of organ of Corti (boxed region in A); BM, basilar membrane; IHC, inner hair cell; OHC, outer hair cell; RM, Reissner’s membrane; TM, tectorial membrane. (C-D) BM sensitivity and phase for one control (blue) and one Gas2tm1a/tm1a (red) mouse. The numbers indicate the highest and lowest stimulus intensities that produced measurable vibratory responses. Postmortem data (60–80 dB SPL) are in gray. (E-F) Average displacements and phases of the BM motions for control (n=9) and Gas2tm1a/tm1a (n=8) mice. Frequencies are normalized to the CF of each individual mouse and error bars indicate the SEM. (G) The averaged vibratory sensitivity and phases of BM motion for live and dead mice are compared in control (blue) and Gas2tm1a/tm1a (red) mice. The frequencies are normalized to the corresponding CF and best frequency (BF) for live and dead data, respectively. Data from live mice show that Gas2tm1a/tm1a mutants have less amplification near CF and sharper phase change with increasing frequency. Data from dead mice (80 dB SPL) also show sharper phase change for Gas2tm1a/tm1a mutants. (H) Mean values of sensitivity change from 40 to 80 dB SPL at 0.7CF, CF, and Q10dB for live (40 dB SPL stimuli) and dead (80 dB SPL stimuli) mice, and phase slope (for 40 dB SPL at the CF) as a percentage of the appropriate control mean. Asterisks denote p<0.05.
Figure 7.
Figure 7.. Human GAS2 mutations associate with hearing loss.
(A) Pedigree of family W19–1278. Whole exome sequencing was performed in subjects with an underlined genotype. m, mutant GAS2 c.723+1G>A; +, wild type (B) Average air conduction thresholds for both ears from subject V.2 measured at 8.2 and 15.8 years of age (y). The dotted line represents the 95th percentile of age- and sex-specific hearing level at the age of 18 years. This is the lowest age for which the ISO 7029:2017 standard can be applied. dB HL, decibel hearing level; kHz, kilohertz. (C) Analysis of WES paired-reads demonstrating a homozygous single nucleotide variant, GAS2 c723+1G>A, in subject V.2. (D) Sequences of exon6-intron6 boundaries amplified from genomic DNA of unaffected subjects V.3 and IV.2 and affected subject V.7. Arrows indicate the position of the c723+1G>A variant. (E) Bar graph showing the genotype-dependence of intron 6 retention. Depicted are the ratios of relative levels of transcripts with intron 6 retention and relative levels of total GAS2 transcript. The dots represent the means of three independent experiments performed in triplicate (*p-value = 0.021; **p-value = 0.013). No statistically significant difference (p-value = 0.137) was observed between the parents and the unaffected offspring. (F) Schematic representation of GAS2 transcript NM_005256.3 and the effects of the c723+1G>A variant on exon 6 splicing. The positions of primers used in RT-PCR are indicated (see Table S1 for primer combinations and sequences). Predicted amino acid sequence, including in frame stop codon (red asterisk), resulting from intron 6 retention is shown below the mutant transcript. Abbreviations: wild type (WT), mutant (M).

References

    1. Adzhubei IA, Schmidt S, Peshkin L, Ramensky VE, Gerasimova A, Bork P, Kondrashov AS and Sunyaev SR (2010). A method and server for predicting damaging missense mutations. Nat Methods 7, 248–9. - PMC - PubMed
    1. Angelborg C and Engstrom H (1972). Supporting elements in the organ of Corti. I. Fibrillar structures in the supporting cells of the organ of Corti of mammals. Acta Otolaryngol. Suppl 73, 49–60. - PubMed
    1. Anzai T, Fukunaga I, Hatakeyama K, Fujimoto A, Kobayashi K, Nishikawa A, Aoki T, Noda T, Minowa O, Ikeda K and Kamiya K (2015). Deformation of the Outer Hair Cells and the Accumulation of Caveolin-2 in Connexin 26 Deficient Mice. PLoS One. 10, e0141258. - PMC - PubMed
    1. Arima T, Uemura T, and Yamamoto T (1986). Cytoskeletal organization in the supporting cell of the guinea pig organ of Corti. Hear. Res. 24, 169–175. - PubMed
    1. Bekesy Gv. Experiments in Hearing. New York: McGraw-Hill, 1960.

Publication types

MeSH terms