. 2021 Jun 3;108(6):1001-1011.
doi: 10.1016/j.ajhg.2021.04.014. Epub 2021 May 7.

Leveraging both individual-level genetic data and GWAS summary statistics increases polygenic prediction

Affiliations

Leveraging both individual-level genetic data and GWAS summary statistics increases polygenic prediction

Clara Albiñana et al. Am J Hum Genet. .

Abstract

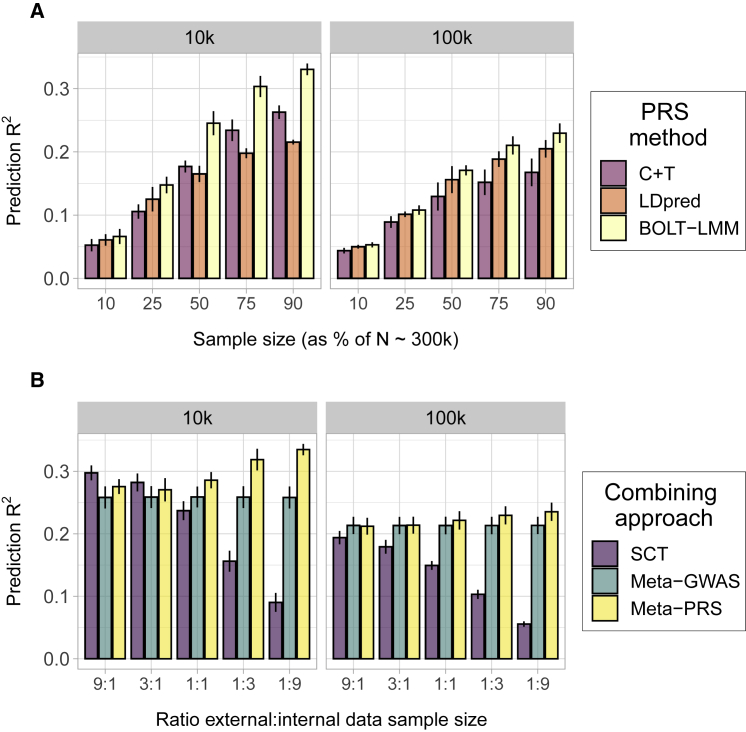
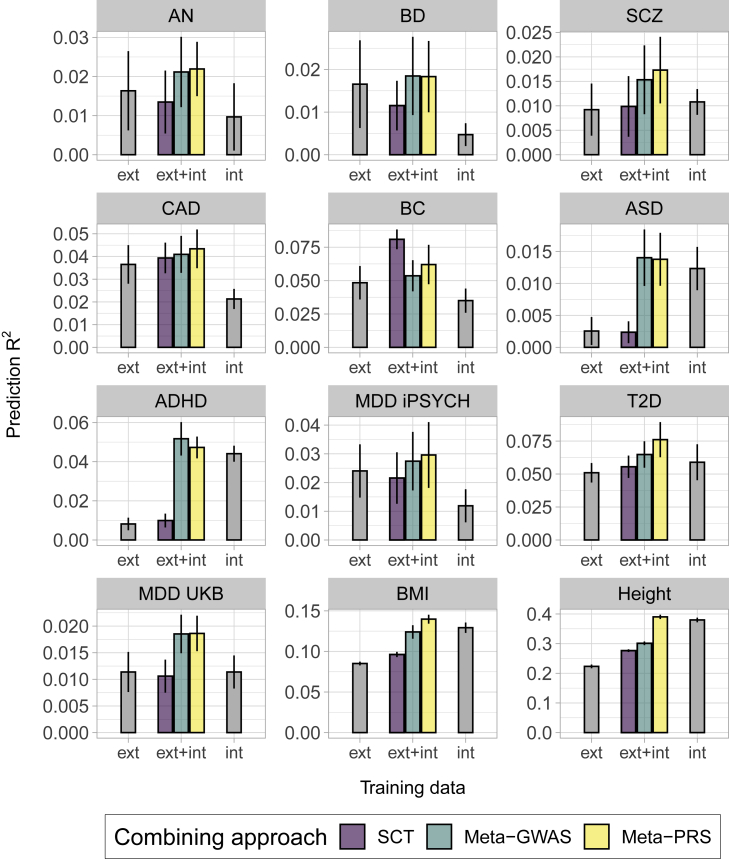
The accuracy of polygenic risk scores (PRSs) to predict complex diseases increases with the training sample size. PRSs are generally derived based on summary statistics from large meta-analyses of multiple genome-wide association studies (GWASs). However, it is now common for researchers to have access to large individual-level data as well, such as the UK Biobank data. To the best of our knowledge, it has not yet been explored how best to combine both types of data (summary statistics and individual-level data) to optimize polygenic prediction. The most widely used approach to combine data is the meta-analysis of GWAS summary statistics (meta-GWAS), but we show that it does not always provide the most accurate PRS. Through simulations and using 12 real case-control and quantitative traits from both iPSYCH and UK Biobank along with external GWAS summary statistics, we compare meta-GWAS with two alternative data-combining approaches, stacked clumping and thresholding (SCT) and meta-PRS. We find that, when large individual-level data are available, the linear combination of PRSs (meta-PRS) is both a simple alternative to meta-GWAS and often more accurate.

Keywords: PRS; complex traits; genetic prediction; meta-analysis; polygenic risk scores; psychiatric disorders.


Conflict of interest statement

C.M.B. reports: Shire (grant recipient, Scientific Advisory Board member); Idorsia (consultant); Lundbeckfonden (grant recipient); Pearson (author, royalty recipient). The other authors declare no competing interests.

Figures

Figure 1
Figure 1
Prediction accuracy of the PRSs in the simulation study Each panel displays the mean and 95% CI of the PRS prediction R2 (y axis) for each data combining approach. The traits were simulated from a liability threshold model with 10,000 (10k) and 100,000 (100k) causal SNPs and heritability h2 of 0.5, and case-control status was inferred from a disease prevalence of 0.2. Mean and 95% CI of prediction R2 were obtained from 10k non-parametric bootstrap samples of 5 independent replicates. (A) Effect of training sample size in the PRSs prediction accuracy. The x axis indicates the percentage of individuals from the total training set (n = 303,728) used as individual-level data for BOLT-LMM or GWAS summary statistics for C+T and LDpred. (B) Effect of the ratio between internal and external data in the combining approaches. The x axis indicates the relative amount of external versus internal data, e.g., 3:1 indicates a scenario where the external data was 75% and the internal data was 25% of the total sample. Figure 1 is a simplified version of Figure S3, selecting a single method per combining approach between C+T and LDpred, where the method maximizing mean prediction R2 was selected.
Figure 2
Figure 2
Prediction accuracy of the combining approaches in 12 complex traits from iPSYCH 2015 and UK Biobank Each panel displays the mean and 95% CI of the PRS prediction R2 (y axis) for each data combining approach, of PRS trained on individual-level data (int), GWAS summary statistics (ext), or both (ext+int) (x axis). The prediction R2 was transformed to the liability-scale using a population prevalence of 0.01 (ASD), 0.05 (ADHD), 0.15 (MDD UK Biobank), 0.05 (T2D), 0.01 (AN), 0.03 (CAD), 0.01 (SCZ), 0.07 (BC), 0.01 (BD), and 0.08 (MDD iPSYCH). The methods noted as int and ext were fitted using BOLT-LMM with individual-level data and LDpred or C+T with GWAS summary statistics, respectively. For simplification, only the ext PRS with larger mean prediction R2 is shown, the full results are available in Figure S8. Mean and 95% CI of the prediction R2 were obtained from 10k non-parametric bootstrap samples of the 5 cross-validation subsets.

Similar articles

Cited by

References

    1. Wray N.R., Lee S.H., Mehta D., Vinkhuyzen A.A., Dudbridge F., Middeldorp C.M. Research review: Polygenic methods and their application to psychiatric traits. J. Child Psychol. Psychiatry. 2014;55:1068–1087. - PubMed
    1. Zhu X., Stephens M. Large-scale genome-wide enrichment analyses identify new trait-associated genes and pathways across 31 human phenotypes. Nat. Commun. 2018;9:4361. - PMC - PubMed
    1. Anderson J.S., Shade J., DiBlasi E., Shabalin A.A., Docherty A.R. Polygenic risk scoring and prediction of mental health outcomes. Curr. Opin. Psychol. 2019;27:77–81. - PMC - PubMed
    1. Buniello A., MacArthur J.A.L., Cerezo M., Harris L.W., Hayhurst J., Malangone C., McMahon A., Morales J., Mountjoy E., Sollis E. The NHGRI-EBI GWAS Catalog of published genome-wide association studies, targeted arrays and summary statistics 2019. Nucleic Acids Res. 2019;47(D1):D1005–D1012. - PMC - PubMed
    1. Purcell S., Neale B., Todd-Brown K., Thomas L., Ferreira M.A., Bender D., Maller J., Sklar P., de Bakker P.I., Daly M.J., Sham P.C. PLINK: a tool set for whole-genome association and population-based linkage analyses. Am. J. Hum. Genet. 2007;81:559–575. - PMC - PubMed

Publication types

LinkOut - more resources