. 2021 May 27;184(11):2860-2877.e22.
doi: 10.1016/j.cell.2021.04.013. Epub 2021 May 7.

Parental genome unification is highly error-prone in mammalian embryos

Affiliations

Parental genome unification is highly error-prone in mammalian embryos

Tommaso Cavazza et al. Cell. .

Abstract

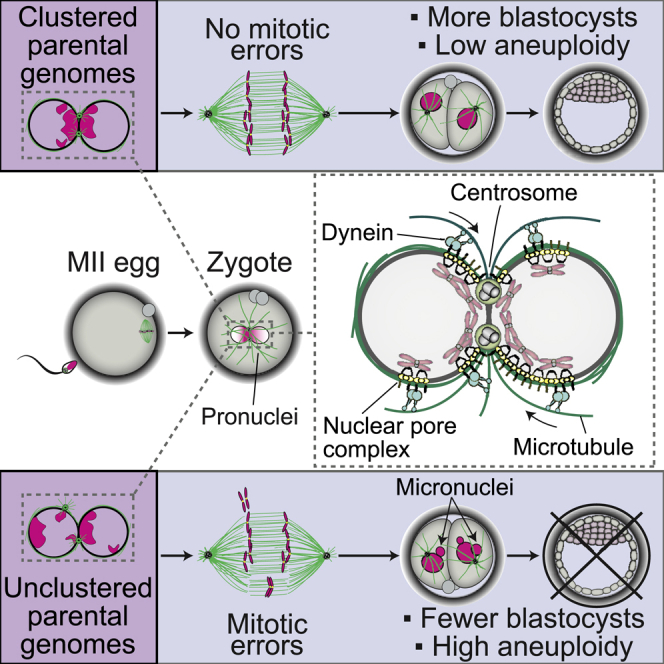
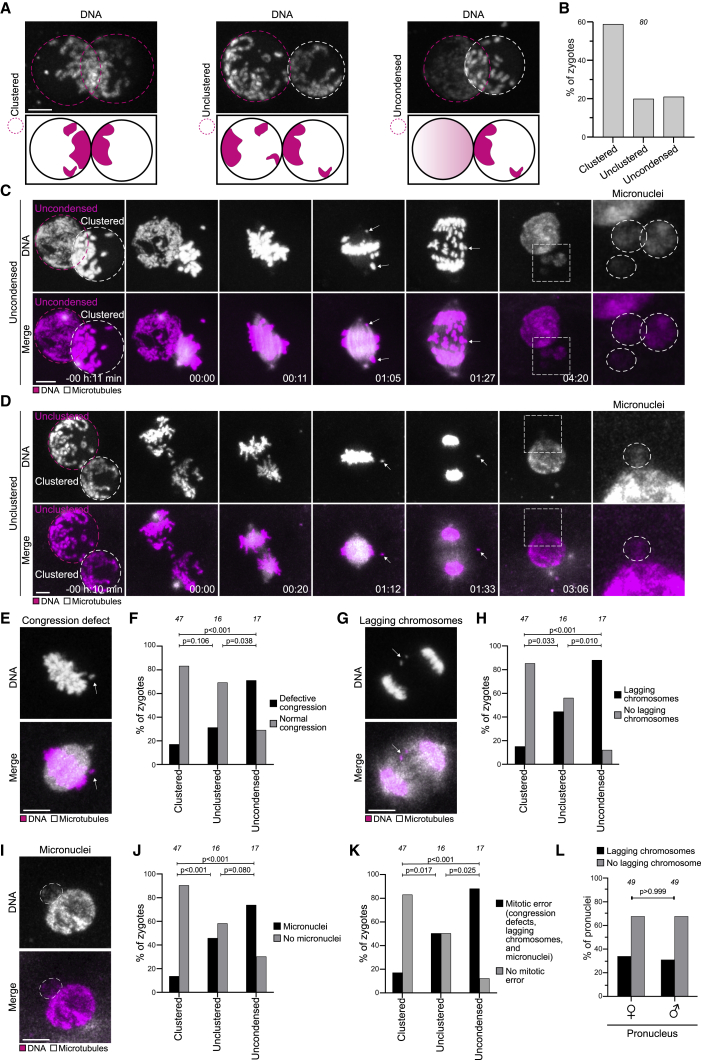
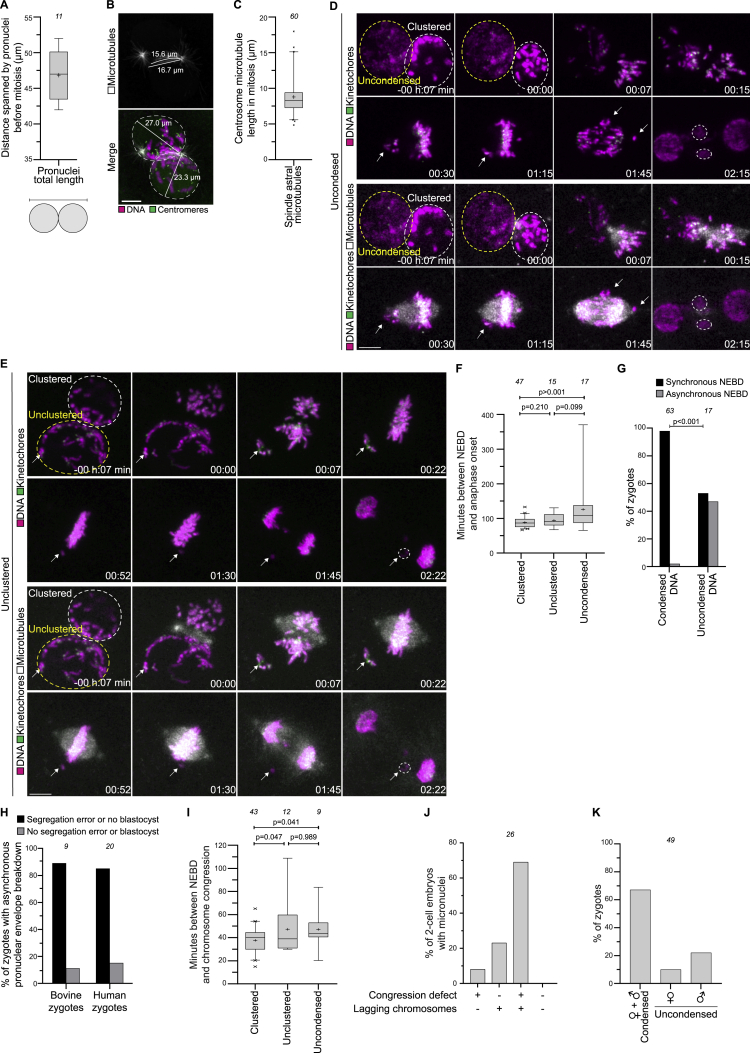
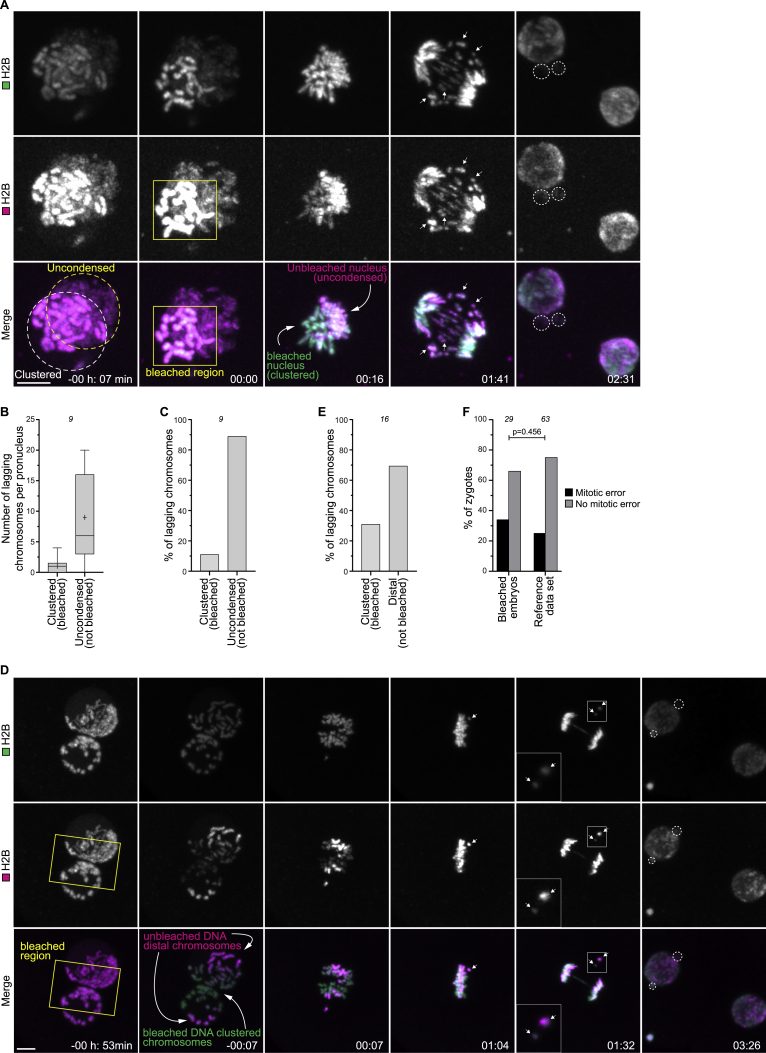
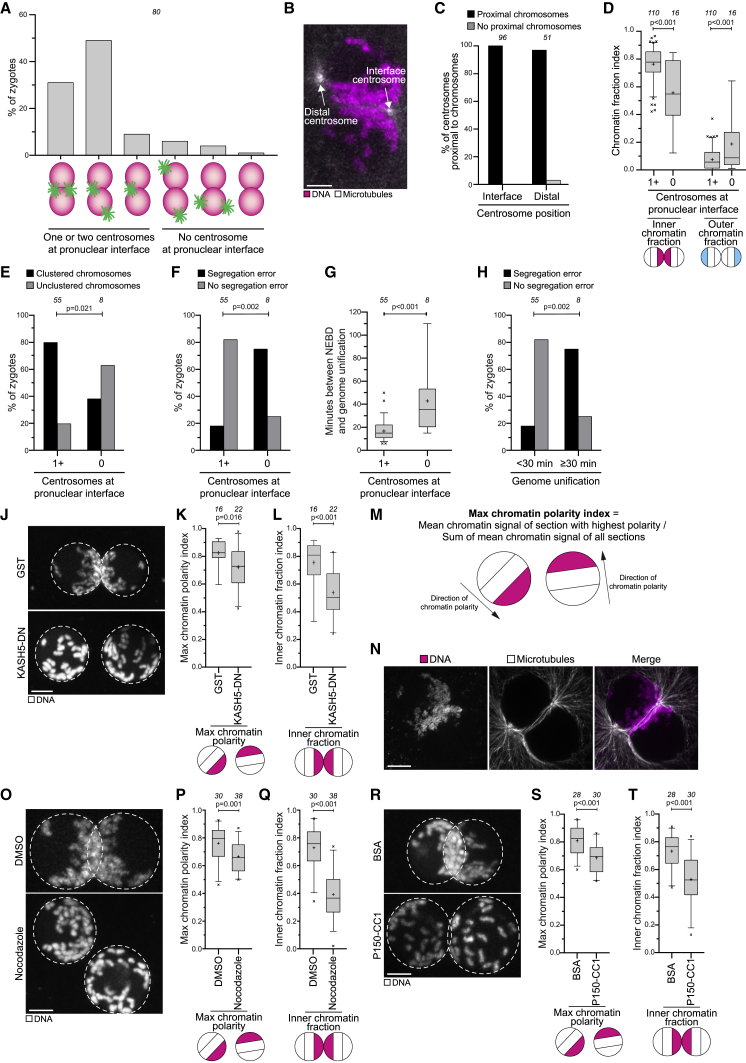
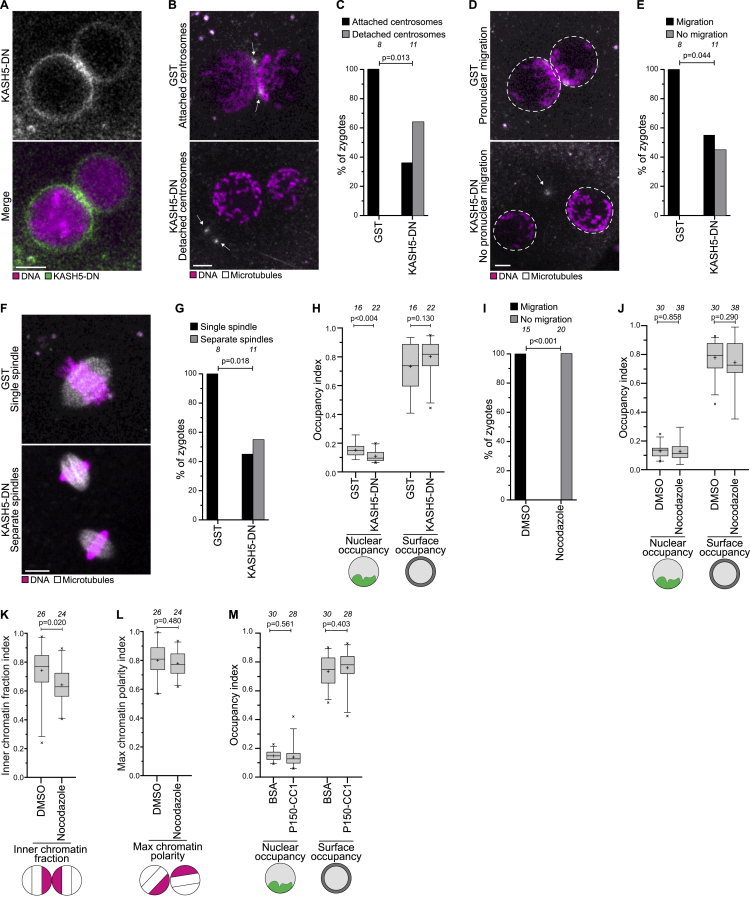
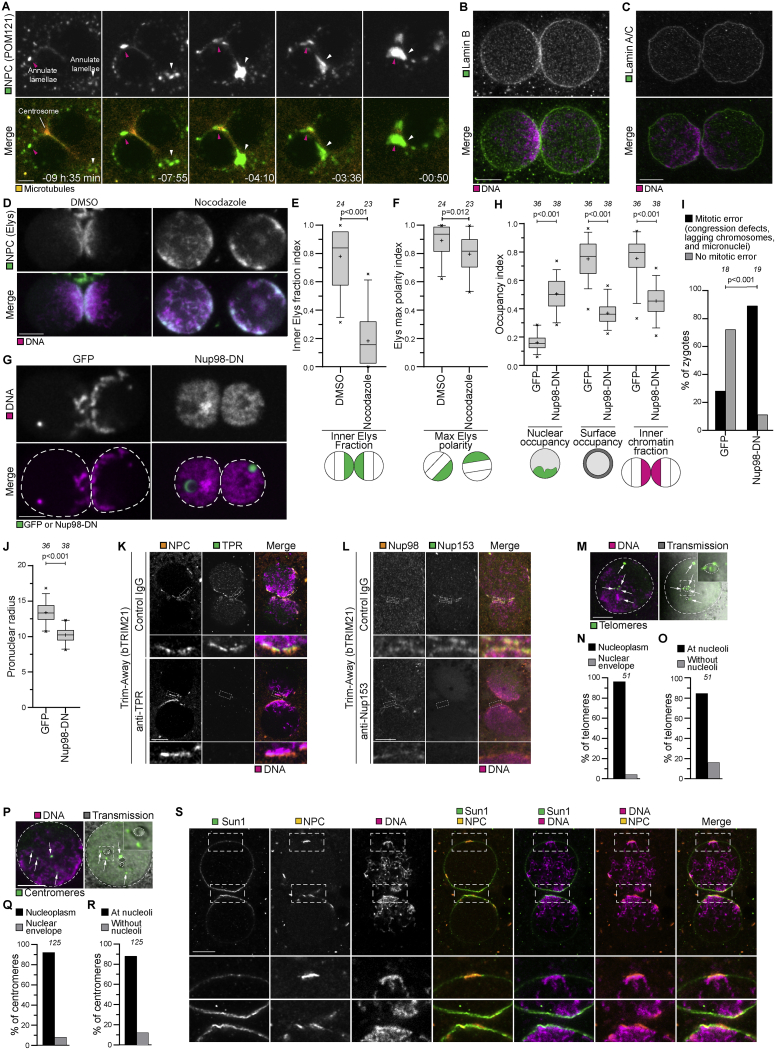
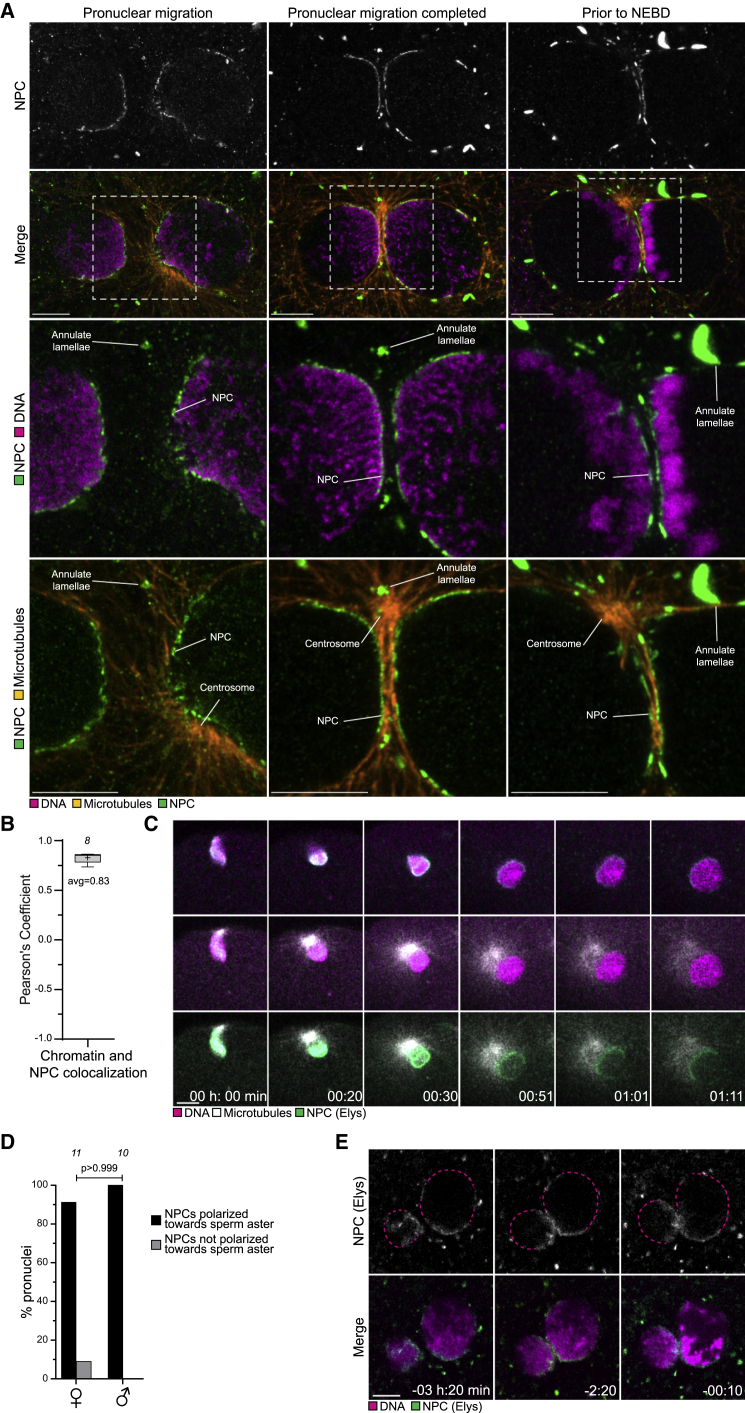
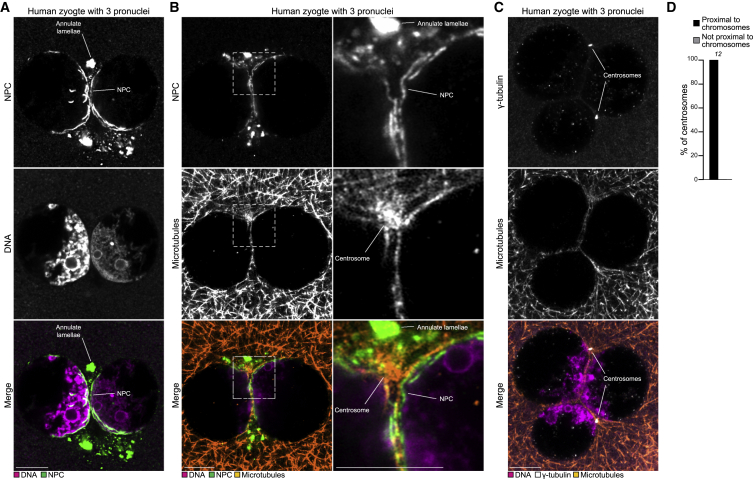
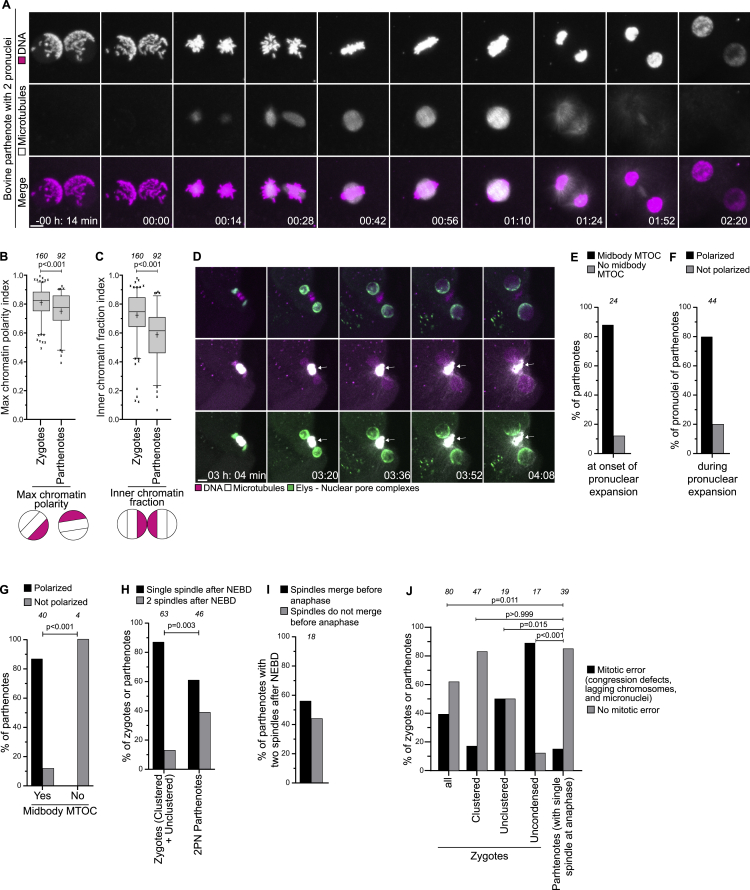
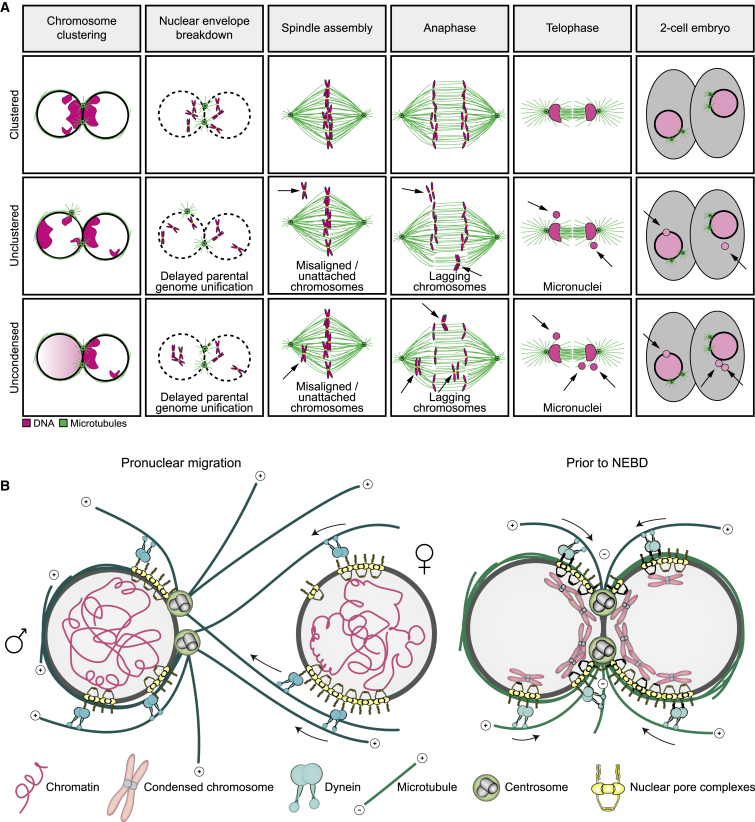
Most human embryos are aneuploid. Aneuploidy frequently arises during the early mitotic divisions of the embryo, but its origin remains elusive. Human zygotes that cluster their nucleoli at the pronuclear interface are thought to be more likely to develop into healthy euploid embryos. Here, we show that the parental genomes cluster with nucleoli in each pronucleus within human and bovine zygotes, and clustering is required for the reliable unification of the parental genomes after fertilization. During migration of intact pronuclei, the parental genomes polarize toward each other in a process driven by centrosomes, dynein, microtubules, and nuclear pore complexes. The maternal and paternal chromosomes eventually cluster at the pronuclear interface, in direct proximity to each other, yet separated. Parental genome clustering ensures the rapid unification of the parental genomes on nuclear envelope breakdown. However, clustering often fails, leading to chromosome segregation errors and micronuclei, incompatible with healthy embryo development.

Keywords: aneuploidy; centrosomes; chromosome segregation; dynein; fertilization; genome organization; human embryo; microtubules; nuclear pore complex; spindle.


Conflict of interest statement

Declaration of interests The authors declare no competing interests.

Figures

None
Graphical abstract
Figure S1
Figure S1
The parental genomes cluster with nucleoli at the pronuclear interface in live human zygotes, related to Figure 1 (A) Time between NEBD and cytokinesis in human zygotes that develop into blastocysts or developed abnormally. (B) Classes of nucleolar spread (see (D)) changes during the last 3 hours before NEBD. Each spread trace was smoothed using local regression and mean subtracted. Soft-DTW and k-mean clustering resulted in 3 classes. Class 1 (magenta) contains nuclei with minor changes in nucleolar distribution. Class 2 (green) contains nuclei displaying active nucleolus compaction. Class 3 (blue) contains nuclei displaying active nucleolus decompaction. The percentage numbers indicate the fraction of each class. In total n = 316 nuclei were analyzed (158 zygotes). The colored lines show the barycenter of the classes. (C) Classes of nucleolar distribution changes in (B) represented without mean subtraction. The colored lines show the barycenter of the classes. (D) Schematic illustrating calculation of the nucleolar spread. (E-G) Representative stills from time-lapse movies of zygotes with the indicated pronucleus belonging to class 1 (E), 2 (F), or 3 (G). The tracks of the nucleoli are shown for the indicated pronuclei, see also (H). Time, h:min, 00:00 is NEBD. (H) Nucleolar spreads during the last 3 hours before NEBD for the zygotes shown in E, F, and G. (I) Zygotes with or without pronuclei of class 3 that develop into blastocysts or developed abnormally. (J) Number of nucleoli in zygote that develop into blastocysts or developed abnormally. (K) Zygotes having less than 6 (< 6), 6, 7, or 8 (6 - 8), or more than 8 (> 8) nucleoli that develop into blastocysts or developed abnormally. (L) Zygotes having a pronucleus with 6 or less (≤6) or more than 6 (> 6) nucleoli that develop into blastocysts or developed abnormally. (M) Zygotes having a difference in nucleolar numbers between pronuclei of 2 or less (≤2) or more than 2 (> 2) that develop into blastocysts or developed abnormally. (N) Representative immunofluorescence images of a zygote with 3 pronuclei. Magenta, DNA (DAPI). Gray, transmission. (O) Pronuclei in live zygotes (as in Figure 1E) or fixed zygotes (as in (N)) were scored for the presence of DNA around nucleoli. The number of analyzed zygotes (A, I, J, K, L, M) and pronuclei (F) is specified in italics. p values were calculated using unpaired two-tailed Student’s t test (A, J) and Fisher’s exact test (I, K, L, M). Scale bars, 10 μm.
Figure 1
Figure 1
The parental genomes cluster with nucleoli at the pronuclear interface in live human zygotes (A) Top: representative stills from time-lapse movies of a human zygote that develops (left) or fails to develop (right) into a blastocyst. Zygotes have clustered (left) or unclustered (right) nucleoli at the pronuclear interface. Middle: magnifications of the regions outlined above. Dashed lines indicate nucleoli and pronuclei. Bottom: schematics of the pronuclei and nucleolar distribution. Time, h:min, 00:00 is NEBD. (B) Human and bovine zygotes with clustered or unclustered nucleoli (human) or DNA (bovine). (C) Zygotes with clustered or unclustered nucleoli that develop into blastocyst or abnormally. (D) Top: representative stills from a time-lapse movie of a zygote. Dashed lines indicate nucleoli and pronuclear outlines. Bottom: schematics of the pronuclei and nucleolar distribution. Arrows indicate a nucleolus that moves toward the pronuclear interface. (E) Representative stills from time-lapse movies of zygotes. Magenta, DNA (5-580CP-Hoechst). Gray, transmission. (F) Top: schematics of chromatin organization during pronuclear migration in zygotes. Bottom: representative stills from time-lapse movies of pronuclear migration in zygotes. White, DNA (5-580CP-Hoechst). Outlined regions magnified above. Yellow dashed lines indicate the cell surface. Time, h:min, 00:00 is NEBD. Z projections of 27 (−25:10), 12 (−22:10 and −16:10), 15 (−12:00), and 11 (−06:20 and −00:20) sections every 1.00 μm. Images generated with Imaris 3D view. (G–I) Schematics (left) and representative stills from time-lapse movies (right) of pronuclei in zygotes before NEBD classified as clustered (G), unclustered (H), and uncondensed (I). White, DNA (5-580CP-Hoechst). Magenta dashed line marks the pronucleus determining the specific category. The arrows in (H) mark chromatin around an unclustered nucleolus. Time, h:min, 00:00 is NEBD. Images generated using Imaris 3D view. The number of analyzed zygotes (B and C) is specified in italics. p values were calculated using Fisher’s exact test. Scale bars, 10 μm. See also Figure S1 and Video S1.
Figure S2
Figure S2
The parental genomes cluster at the pronuclear interface in bovine zygotes, related to Figure 2 (A) Bovine zygotes non-injected and non-imaged or injected and imaged that developed into blastocysts or developed abnormally. (B) Representative stills from time-lapse movies of male pronuclei imaged shortly after egg fertilization. White, microtubules (mClover3-MAP4-MTBD). Magenta, DNA (H2B-mScarlet). Time, h:min, 00:00 corresponds to start of image acquisition. First time point shows a single confocal section, while the other time points are Z-projections of 2 (01:49) or 4 (02:13 to 03:14) sections every 2.50 μm. (C-E) Quantification of chromatin distribution within pronuclei before NEBD using the nuclear occupancy (I), surface occupancy (J), inner and outer chromatin fraction (K), indices. (F) Inner chromatin fraction indices in female (magenta) and male (cyan) pronuclei. Solid lines represent means of five pronuclei belonging to five zygotes. Shaded areas represent standard error of the mean. (G) Inner chromatin fraction indices in female (♂) and male (♀) pronuclei before NEBD. (H) Representative stills from a time-lapse movie of a zygote undergoing cell division. Green, paternal DNA (H3.3-mClover3). Magenta, DNA (H2B-mScarlet). ♀ and ♂ indicate the female and the male pronucleus and the DNA of maternal and paternal origin in the second cell division. Time, h:min, 00:00 is NEBD. Z-projections, 10 sections every 2.50 μm. Scale bar, 10 μm. (I) Embryos at the indicated stages were scored for spatial separation or merging of the parental genomes on the metaphase spindle. (J-M) Quantification of chromatin distribution within pronuclei using the nuclear occupancy index (J), surface occupancy index (K), inner chromatin fraction index (L), and outer chromatin fraction index (M) in indicated groups in zygotes. Data are from five (A, I), eleven (C, D, E, J, K, L, M), three (G), or seven (I) independent experiments. The number of analyzed zygotes (A), pronuclei (C, D, E, G, J, K, L, M), or spindles (I) is specified in italics. p values were calculated using Fisher’s exact test (A, I) and unpaired two-tailed Student’s t test (G, J, K, L, M). Scale bars, 10 μm.
Figure 2
Figure 2
The parental genomes cluster at the pronuclear interface in bovine zygotes (A) Top: schematics of chromatin organization and spindle assembly in bovine zygotes. Magenta, chromatin. Green, microtubules. Bottom: representative stills from time-lapse movies of bovine zygotes. White, microtubules (mClover3-MAP4-MTBD). Magenta, DNA (H2B-mScarlet). Outlined regions are magnified below. Time, h:min, 00:00 is NEBD. Z projections, 11 sections every 2.50 μm. (B) Top: schematic of chromatin organization during pronuclear migration. Bottom: representative stills from time-lapse movies of pronuclear migration. White, microtubules (mClover3-MAP4-MTBD). Magenta, DNA (H2B-mScarlet). Outlined regions magnified above. Time, h:min, 00:00 is NEBD. Z projections, 8 sections every 2.50 μm. (C) Quantification of chromatin distribution within pronuclei using the inner chromatin fraction index (magenta), nuclear occupancy index (green), and surface occupancy index (gray). Solid lines represent means of ten pronuclei belonging to five zygotes obtained from three independent experiments. Shaded areas represent the standard error of the mean. (D) Representative immunofluorescence images of a zygote at NEBD. White, microtubules (α-tubulin). Magenta, DNA (DAPI). Green, centromeres (ACA). (E) Representative immunofluorescence images of a zygotic spindle. White, microtubules (α-tubulin). Magenta, DNA (DAPI). Green, γ-tubulin. Scale bars, 10 μm. See also Figure S2 and Video S2.
Figure 3
Figure 3
Parental genome clustering promotes accurate chromosome segregation in bovine zygotes (A) Representative stills from time-lapse movies (top) and schematics (bottom) of pronuclei in bovine zygotes classified as clustered (left); unclustered (middle); uncondensed (right). White, DNA (H2B-mScarlet). Magenta dashed line marks the pronucleus determining the specific category. Z projections, 10 sections every 2.50 μm. (B) Frequency of clustering defects in zygotes. (C and D) Representative stills from time-lapse movies of zygotes before and after NEBD. (C) A zygote classified as uncondensed. (D) A zygote classified as unclustered. White, microtubules (mClover3-MAP4-MTBD). Magenta, DNA (H2B-mScarlet). Arrows indicate misaligned and lagging chromosomes that form micronuclei, as highlighted by dashed box (magnification on the right). Time, h:min, 00:00 is NEBD. Z projections, 12 sections every 2.50 μm. (E–K) Representative images and frequencies of zygotes in indicated groups having defective chromosome congression or unattached chromosomes at metaphase (E and F), lagging or unattached chromosomes during anaphase (G, H), micronuclei in 2-cell embryos (I and J), and abnormal mitosis (K). White, microtubules (mClover3-MAP4-MTBD). Magenta, DNA (H2B-mScarlet). Z projections of 5 (E and I) and 4 (G) sections every 2.50 μm. (L) Frequency of lagging chromosomes originating from female (♀) and male (♂) pronuclei. Data are from eleven (B, F, H, J, and K) or five (L) independent experiments. The number of analyzed zygotes (B, F, H, J, and K) or pronuclei (L) is specified in italics. p values were calculated using Fisher’s exact tests. Scale bars, 10 μm. See also Figures S3 and S4 and Videos S3 and S4.
Figure S3
Figure S3
Defective clustering leads to a delay in chromosome congression in bovine zygotes, related to Figure 3 (A) Distance spanned by pronuclei before NEBD in bovine zygotes. (B) Adaptation of Figure 2G with measurements of pronuclear diameter and of microtubule length. (C) Length of astral microtubules at metaphase in zygotes. (D-E) Representative stills from time-lapse movies of zygotes classified as uncondensed (D) and unclustered (E). White, microtubules (mClover3-MAP4-MTBD). Magenta, DNA (H2B-miRFP). Green, kinetochores (mScarlet-hCenpC). Dashed lines indicate pronuclei with uncondensed or unclustered chromatin (yellow) and clustered chromatin (white). Arrows point to uncondensed or distal chromosomes that join the metaphase plate later. Several of these chromosomes subsequently form micronuclei, highlighted by white dashed lines. Time, h:min, 00:00 is NEBD. Z-projections, respectively 4 and 7 sections every 3.08 μm. Scale bars, 10 μm. (F) Time between NEBD and anaphase onset in indicated zygote groups. (G) Zygotes in indicated groups that underwent NEBD synchronously or asynchronously. (H) Bovine and human zygotes with asynchronous NEBD (delay between pronuclei > 10 min) were scored for the presence of chromosome segregation errors (bovine zygotes) or development into blastocysts (human zygotes). (I) Time between NEBD and the completion of chromosome congression on the metaphase plate in indicated zygote groups. Zygotes that failed to align all chromosomes before anaphase onset were excluded. (J) 2-cell embryos with micronuclei that displayed chromosome congression defects and/or lagging chromosomes during zygote mitosis. (K) Zygotes entering mitosis with two condensed pronuclei or with only the female (♀) or male (♂) pronucleus being uncondensed. Data are from two (A), eleven (F, G, H, I, J), and five (K) independent experiments. Data in (C) are from three zygotes obtained from two independent experiments. The number of analyzed zygotes (A, F, G, H, I, K), microtubules (C), and 2-cell embryos (J) is specified in italics. p values were calculated using unpaired two-tailed Student’s t test. Scale bars, 10 μm.
Figure S4
Figure S4
In bovine zygotes, unclustered chromosomes are more likely to missegregate, related to Figure 3 (A) Representative stills from time-lapse movies of a bovine zygote with one pronucleus having uncondensed chromatin (yellow dashed line). The H2B-mScarlet chromatin signal in the pronucleus with clustered chromatin (left) was bleached upon NEBD in the region indicated by the yellow rectangle. The bleached DNA has a green signal, while the unbleached DNA is visible both in green and magenta. Lagging chromosomes are magenta and green (arrows), indicating that they originated from the uncondensed pronucleus. Green, DNA (H2B-mClover3). Magenta, DNA (H2B-mScarlet). Dashed lines indicate micronuclei. Time, h:min, 00:00 is NEBD. Z-projections, 9 sections every 1.76 μm. (B) Number of lagging chromosomes that originated from pronuclei with clustered DNA (bleached) or uncondensed DNA (not bleached). (C) Percentage of total lagging chromosomes that originated from pronuclei with clustered DNA (bleached) or uncondensed DNA (not bleached). (D) Representative stills from time-lapse movies of a zygote with unclustered chromosomes. The H2B-mScarlet chromatin signal between pronuclei was bleached before NEBD in the region indicated by the yellow rectangle. Lagging chromosomes are magenta and green (arrows), indicating that they were not bleached and were peripheral chromosomes. Green, DNA (H2B-mClover3). Magenta, DNA (H2B-mScarlet). Dashed lines indicate micronuclei. Time, h:min, 00:00 is NEBD. Z-projections, 18 sections every 1.76 μm. (E) Percentage of total lagging chromosomes that originated from clustered DNA (bleached) or distal DNA (not bleached). (F) Zygotes displaying mitotic errors after bleaching and in reference dataset (Figure 2J, merge of clustered and unclustered groups). Data are from four (B, C, E, F-bleached embryos) and eleven (F-reference dataset) independent experiments. The number of analyzed zygotes is specified in italics. p values were calculated using Fisher’s exact test. Scale bars, 10 μm.
Figure 4
Figure 4
In bovine zygotes, centrosome positions determine the sites of chromosome clustering and accuracy of chromosome segregation (A) Centrosome localization before NEBD in bovine zygotes. (B) Representative still from a time-lapse movie of a zygote before NEBD. White, microtubules (mClover3-MAP4-MTBD). Magenta, DNA (H2B-mScarlet). Arrows specify distal and the interface centrosomes. (C) Distal and interface centrosomes as in (B) were scored for proximity to chromosomes. (D) Inner and outer chromatin fraction indices in zygotes with or without centrosomes at the pronuclear interface. (E) Chromosome clustering was scored in zygotes with or without centrosomes at the pronuclear interface. (F) Zygotes with or without centrosomes at the pronuclear interface were scored for the presence of chromosome segregation errors. (G) Time between NEBD and the unification of the parental genomes in zygotes with or without centrosomes at the pronuclear interface. (H) Zygotes in which parental genome unification took place within 30 min after NEBD or later were scored for the presence of chromosome segregation errors. (J) Representative images of zygotes expressing GST or KASH5-DN. White, DNA (H2B-mScarlet). Dashed lines mark pronuclei. Z projections, 9 sections every 3.08 μm. (K and L) Max chromatin polarity (see M) and inner chromatin fraction indices in zygotes expressing GST or KASH5-DN. (M) Schematic illustrating calculation of the max chromatin polarity index. (N) Representative immunofluorescence images of a zygote with microtubules wrapped around the pronuclei. White, microtubules (α-tubulin). Magenta, DNA (DAPI). Z projection, 35 sections every 0.1 μm. (O–T) Representative images, max chromatin polarity and inner chromatin fraction indices in zygotes treated with DMSO or nocodazole before pronuclear juxtaposition (O–Q) or injected with BSA or P150-CC1 (R–T). The last time point before NEBD is shown. White, DNA (H2B-mScarlet). Dashed lines mark pronuclei. Z projections, 8 (O) and 12 (R) sections every 2.50 μm. Zygotes having a pronucleus with uncondensed chromatin at NEBD were excluded from the quantifications in (C)–(H), (K), (L), (S), (T), (P), and (Q) to avoid accounting for the role of incomplete chromosome condensation at NEBD. Data are from eleven (A–H), four (K, L, S, and T), or six (P and Q) independent experiments. The number of analyzed zygotes (A and E–H), centrosomes (C), and pronuclei (D, K, L, S, T, P, and Q) is specified in italics. p values were calculated using unpaired two-tailed Student’s t test (D, G, K, L, S, T, P, and Q) and Fisher’s exact test (E, F, and H). Scale bar, 10 μm. See also Figures S5 and S7 and Video S5.
Figure S5
Figure S5
Effects of KASH5-DN, nocodazole, and P150-CC1 treatments in bovine zygotes, related to Figure 4 (A) Representative image of a bovine zygote expressing mClover3-KASH5-DN (green) and H2B-mScarlet (DNA, magenta). (B-G) Representative images and quantification of zygotes in indicated groups displaying, upon KASH5-DN treatment, detached centrosomes (B and C), pronuclear migration defects (D and E) or separate spindles at anaphase onset (F and G). White, microtubules (mClover3-MAP4-MTBD). Magenta, DNA (H2B-mScarlet). Arrows indicate detached centrosomes and dashed lines indicate pronuclear envelopes. Z-projection, respectively 4, 7, 5, 8, 4, and 10 sections every 2.50 μm. (H) Nuclear and surface occupancy indices in zygotes expressing GST or KASH5-DN. (I) Zygotes treated with DMSO or nocodazole before pronuclear juxtaposition were scored for pronuclear migration defects. (J) Nuclear and surface occupancy indices in zygotes treated with DMSO or nocodazole before pronuclear juxtaposition. (K-L) Inner chromatin fraction and max chromatin polarity indices in zygotes treated with DMSO or nocodazole after pronuclear juxtaposition. (M) Nuclear and surface occupancy indices in zygotes injected with BSA or P150-CC1. Data are from four (C, E, G, H, M), six (I,J), three (K,L) independent experiments. The number of analyzed zygotes (C, E, G, I) and pronuclei (H, J, K, L, M) are specified in italics. p values were calculated using Fisher’s exact test (C, E, G, I) and unpaired two-tailed Student’s t test (H, J, K, L, M). Scale bars, 10 μm.
Figure S6
Figure S6
Nuclear pore complexes cluster with chromatin at the pronuclear interface in bovine zygotes, related to Figure 5 (A) Representative stills from time-lapse movies of bovine zygotes expressing mClover3-MAP4-MTBD (microtubules, orange) and POM121-mScarlet (NPCs, green). Magenta and white arrowheads indicate two patches of annulate lamellae moving toward centrosomes and pronuclear interface. Time, h:min, 00:00 is NEBD. Single confocal microscopy sections. (B-C) Representative immunofluorescence images of zygotes stained with Lamin B (B) or Lamin A/C (C) (Green) and DNA (DAPI, Magenta). Single sections Airyscan microscopy (B) and single sections confocal microscopy (C). (D) Representative stills from time-lapse movies of zygotes expressing bElys-mClover3 (NPC, green) and H2B-mScarlet (DNA, magenta) treated with DMSO or nocodazole before pronuclear expansion. The time point at 4 hours before NEBD is shown. Z-projections of 2 (left) and 3 (right) sections every 2.50 μm. (E-F) Inner Elys polarity and max Elys polarity indices at 4 hours before NEBD in zygotes treated with DMSO or nocodazole before pronuclear expansion. Analysis was not possible later because Elys redistributed to the chromatin before NEBD. Note that nocodazole was added after the formation of the midbody from the meiosis II spindle. Midbody microtubules are known to be very stable and, based on our experiments in parthenotes (Figures S7), might contribute to residual NPC polarization in nocodazole treated zygotes. (G) Representative stills from time-lapse movies of zygotes before NEBD expressing mClover3 (GFP) or Nup98-DN-mClover3 (Nup98-DN). Green, GFP or Nup98-DN. Magenta, DNA (H2B-mScarlet). Dashed lines mark pronuclei. Single section confocal microscopy. (H) Nuclear occupancy, surface occupancy, and inner chromatin fraction indices in zygotes injected with mClover3 (GFP) or Nup98-DN-mClover3 (Nup98-DN). (I) Zygotes injected with mClover3 (GFP) or Nup98-DN-mClover3 (Nup98-DN) having an abnormal mitosis. (J) Pronuclear radius in zygotes injected with mClover3 (GFP) or Nup98-DN-mClover3 (Nup98-DN). (K-L) Representative immunofluorescence images of pronuclei in zygotes expressing bTrim21 (bovine Trim21) and treated with the indicated antibodies. Orange, NPC (NPC-mAb414 (K) or Nup98 (L)). Green, TPR (K) or Nup153 (L). Magenta, DNA (DAPI). Note that antibody injections were performed before fertilization to ensure protein depletion before pronuclear assembly. (M) Representative immunofluorescence images of telomere distribution within a pronucleus. Gray, transmission. Magenta, DNA (DAPI). Green, telomeres (Trf1). Single sections confocal microscopy. Dashed lines indicate pronucleus and nucleoli. Arrows indicate telomeres. Outlined regions magnified in the top right corner. (N) Telomeres in the nucleoplasm or at the nuclear envelope. (O) Telomeres at nucleoli or away from nucleoli. (P) Representative immunofluorescence images of centromere distribution within a pronucleus. Gray, transmission. Magenta, DNA (DAPI). Green, centromeres (ACA). Single sections confocal microscopy. Dashed lines indicate pronucleus and nucleoli. Arrows indicate centromeres. Outlined regions magnified in the top right corner. (Q) Centromeres in the nucleoplasm or at the nuclear envelope. (R) Centromeres at nucleoli or away from nucleoli. (S) Representative immunofluorescence images of zygotes stained with Sun1 (Green), NPC (NPC-mAb414, Orange) and DNA (DAPI, Magenta). Outlined regions magnified in bottom two rows. Telomere bouquet formation during the early stages of meiosis relies on the LINC inner nuclear membrane protein SUN1. However, in bovine zygotes, SUN1 was distributed along both pronuclear envelopes, without specific enrichment on peripheral chromosomes (magnified region). This localization is in contrast to the clustered appearance of SUN1 in proximity to the centrosome in meiotic cells, but it is consistent with observations in C. elegans zygotes (Minn et al., 2009). Single sections Airyscan microscopy. Data are from four (E, F) and five (H, I, J) independent experiments. Data in (N, O, Q, R) are from five embryos (two pronuclei each) generated in a single experiment. The number of analyzed pronuclei (E, F, H, J), zygotes (I), telomeres (N,O), and centromeres (Q, R) are specified in italics. p values were calculated using unpaired two-tailed Student’s t test (E, F, H, J) and Fisher’s exact test (I). Scale bars, 10 μm.
Figure 5
Figure 5
Nuclear pore complexes cluster with chromatin at the pronuclear interface in bovine zygotes (A) Representative immunofluorescence images of bovine zygotes during pronuclear migration (left), in early stages on pronuclear juxtaposition when chromatin condensation is incomplete (middle), and in late stages after increased chromatin condensation (right). Orange, microtubules (respectively, β-tubulin, α-tubulin, and α-tubulin). Magenta, DNA (DAPI). Green, NPC (respectively Nup98, NPC-Mab414, and NPC-Mab414). Outlined regions magnified in the bottom two rows. Centrosomes, NPCs, and annulate lamellae are indicated. Single sections Airyscan microscopy. (B) Pearson’s coefficient quantifying the co-localization of NPCs and chromatin at the nuclear envelope. +1 indicates perfect co-localization, −1 indicates exclusion. (C) Representative stills from time-lapse movies of zygotes expressing bElys-mClover3 (NPC, green), mScarlet-MAP4-MTBD (microtubules, white), and H2B-miRFP (DNA, magenta). 00:00 is start of image acquisition. First two time points are single confocal microscopy sections, whereas the other time points are Z projections of 3 (00:30) or 5 (00:51 to 01:11) sections every 2.50 μm. (D) Female (♀) and male (♂) pronuclei were scored for polarization toward the sperm aster. (E) Representative stills from time-lapse movies of zygotes expressing bElys-mClover3 (NPC, green) and H2B-mScarlet (DNA, magenta). The right pronucleus re-orients, leading to a more clustered organization of chromatin and NPCs. Dashed line indicates regions of the nuclear envelope devoid of NPCs. Time, h:min, 00:00 is NEBD. Single confocal microscopy sections. Data are from two (B) or three (D) independent experiments. The number of analyzed zygotes (C) or pronuclei (D) is specified in italics. p value in (D) was calculated using unpaired two-tailed Student’s t test. Scale bars, 10 μm. See also Figure S6 and Video S6.
Figure 6
Figure 6
Nuclear pore complexes cluster with chromatin at the pronuclear interface in human zygotes (A) Representative immunofluorescence images of a human zygote with 3 pronuclei. Magenta, DNA (DAPI). Green, NPC (NPC-Mab414). Single sections Airyscan microscopy. (B) Representative immunofluorescence images of a zygote with 3 pronuclei. Orange, microtubules (α-tubulin). Magenta, DNA (DAPI). Green, NPC (NPC-Mab414). Outlined regions magnified on the right. Airyscan microscopy, Z projections of 3 sections every 0.16 μm. (C) Representative immunofluorescence images of a zygote with 3 pronuclei. Orange, microtubules (α-tubulin). Magenta, DNA (DAPI). Green, NPC (NPC-Mab414). White, γ-tubulin (γ-tubulin). Single sections Airyscan microscopy. This is the same zygote shown in (B), restained with additional antibodies. (D) Zygotes with 3 pronuclei were scored for the presence of chromosomes in proximity of the centrosomes. The number of analyzed centrosomes is specified in italics. Scale bars, 10 μm. See also Video S6.
Figure S7
Figure S7
Bovine parthenotes cluster chromosomes toward the midbody of the meiosis II spindle, related to Figure 4 (A) Representative stills from time-lapse movies of bovine parthenotes with 2 pronuclei. White, microtubules (mClover3-MAP4-MTBD). Magenta, DNA (H2B-mScarlet). Time, h:m, 00:00 is NEBD. Z-projections, 15 sections every 2.50 μm. (B-C) Max chromatin polarity and inner chromatin fraction indices before NEBD in zygotes (same as Figure S2E) and parthenotes. (D) Representative stills from time-lapse movies of parthenotes with 2 pronuclei. Green, NPC (bElys-mClover3). White, microtubules (mScarlet-MAP4-MTBD). Magenta, DNA (H2B-miRFP). Arrows point to the meiosis II microtubule spindle that becomes a midbody and acts as microtubule organizing center, persisting for long after the end of meiosis. In the top row, the microtubule signal bleeds into the DNA channel. The midbody is thus also visible in magenta. Time, h:min, 00:00 is egg activation. Z-projections, 3 (first three frames) and 2 (last two frames) non-consecutive sections to display both pronuclei. (E) Parthenotes with or without a midbody acting as microtubule organizing center (MTOC) at the onset of pronuclear expansion. (F) Parthenotes with or without a polarized distribution of Elys during pronuclear expansion. (G) Parthenotes with or without a polarized distribution of Elys during pronuclear expansion in the presence or absence of a midbody MTOC. (H) Zygotes and parthenotes having one or two spindles after NEBD. Zygotes are those in the clustered and unclustered categories from Figure 3B. (I) Parthenotes with two spindles after NEBD were scored for spindle merging before anaphase onset. (J) Zygotes and parthenotes in indicated groups having abnormal mitosis. Zygotes are the same analyzed in Figure 4K. Data are from four (parthenotes groups in B, C, H, J, and E, F, G, I) and eleven (zygote groups in B, C, H, J) independent experiments. The number of analyzed pronuclei (B, C), parthenotes (E, F, G, H, I, J), and zygotes (H, J) are specified in italics. p values were calculated using unpaired two-tailed Student’s t test (B, C) and Fisher’s exact test (G, H, J). Scale bars, 10 μm.
Figure 7
Figure 7
Models illustrating the function and mechanism of parental genome clustering (A) Schematics of mitosis in zygotes having clustered (top), unclustered (middle), or uncondensed (bottom) chromosomes before NEBD. Magenta, chromatin. Green, microtubules. Arrows point to defects causing chromosome segregation errors, such as misaligned, unattached, and lagging chromosomes, and to micronuclei. (B) Model for the mechanism of chromatin clustering at the pronuclear interface before (left) and after (right) completion of pronuclear migration. Gray, nucleoplasm. Magenta, chromatin and chromosomes. Yellow, NPCs. Cyan, dynein. Green, microtubules and centrosomes. Microtubule polarity is indicated by + and −. Arrows indicate dynein directionality. Female and male pronuclei are marked by ♀ and ♂, respectively.

Similar articles

Cited by

References

    1. Arlucea J., Andrade R., Alonso R., Aréchaga J. The nuclear basket of the nuclear pore complex is part of a higher-order filamentous network that is related to chromatin. J. Struct. Biol. 1998;124:51–58. - PubMed
    1. Bankhead P., Loughrey M.B., Fernández J.A., Dombrowski Y., McArt D.G., Dunne P.D., McQuaid S., Gray R.T., Murray L.J., Coleman H.G. QuPath: Open source software for digital pathology image analysis. Sci. Rep. 2017;7:16878. - PMC - PubMed
    1. Beaudouin J., Gerlich D., Daigle N., Eils R., Ellenberg J. Nuclear envelope breakdown proceeds by microtubule-induced tearing of the lamina. Cell. 2002;108:83–96. - PubMed
    1. Benkhalifa M., Kasakyan S., Clement P., Baldi M., Tachdjian G., Demirol A., Gurgan T., Fiorentino F., Mohammed M., Qumsiyeh M.B. Array comparative genomic hybridization profiling of first-trimester spontaneous abortions that fail to grow in vitro. Prenat. Diagn. 2005;25:894–900. - PubMed
    1. Bernal-Ulloa S.M., Heinzmann J., Herrmann D., Hadeler K.G., Aldag P., Winkler S., Pache D., Baulain U., Lucas-Hahn A., Niemann H. Cyclic AMP Affects Oocyte Maturation and Embryo Development in Prepubertal and Adult Cattle. PLoS ONE. 2016;11:e0150264. - PMC - PubMed

Publication types