

Identifying urban hotspots of dengue, chikungunya, and Zika transmission in Mexico to support risk stratification efforts: a spatial analysis
- PMID: 33964237
- PMCID: PMC8114339
- DOI: 10.1016/S2542-5196(21)00030-9
Identifying urban hotspots of dengue, chikungunya, and Zika transmission in Mexico to support risk stratification efforts: a spatial analysis
Abstract
Background: Effective Aedes aegypti control is limited, in part, by the difficulty in achieving sufficient intervention coverage. To maximise the effect of vector control, areas with persistently high numbers of Aedes-borne disease cases could be identified and prioritised for preventive interventions. We aimed to identify persistent Aedes-borne disease hotspots in cities across southern Mexico.
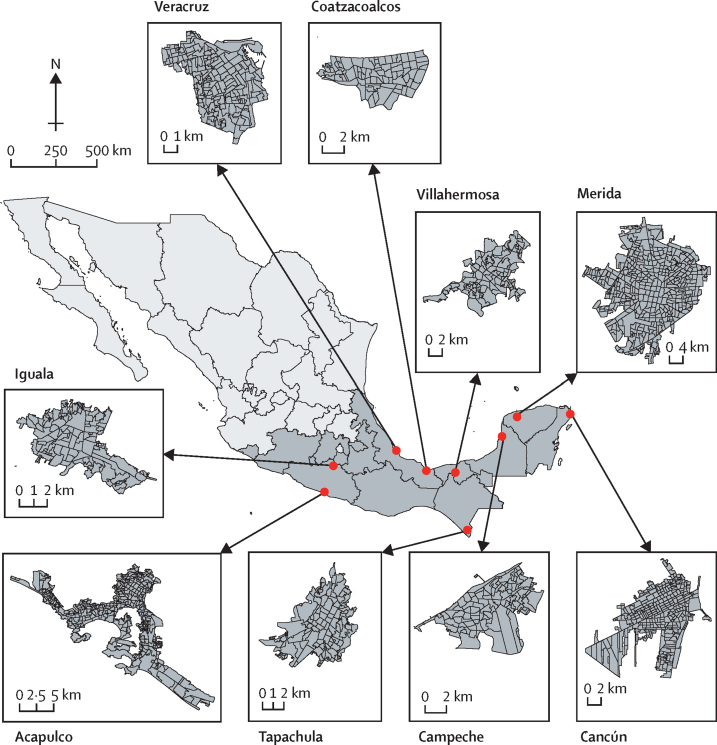
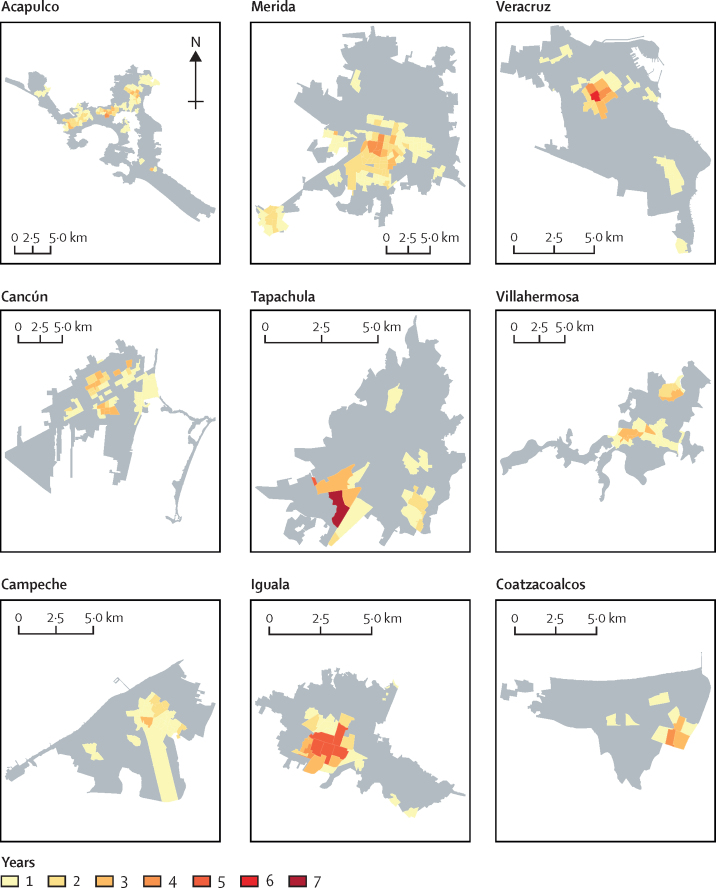
Methods: In this spatial analysis, geocoded cases of dengue, chikungunya, and Zika from nine endemic Mexican cities were aggregated at the census-tract level. We included cities that were located in southern Mexico (the arbovirus endemic region of Mexico), with a high burden of dengue cases (ie, more than 5000 cases reported during a 10-year period), and listed as high priority for the Mexican dengue control and prevention programme. The Getis-Ord Gi*(d) statistic was applied to yearly slices of the dataset to identify spatial hotspots of each disease in each city. We used Kendall's W coefficient to quantify the agreement in the distribution of each virus.
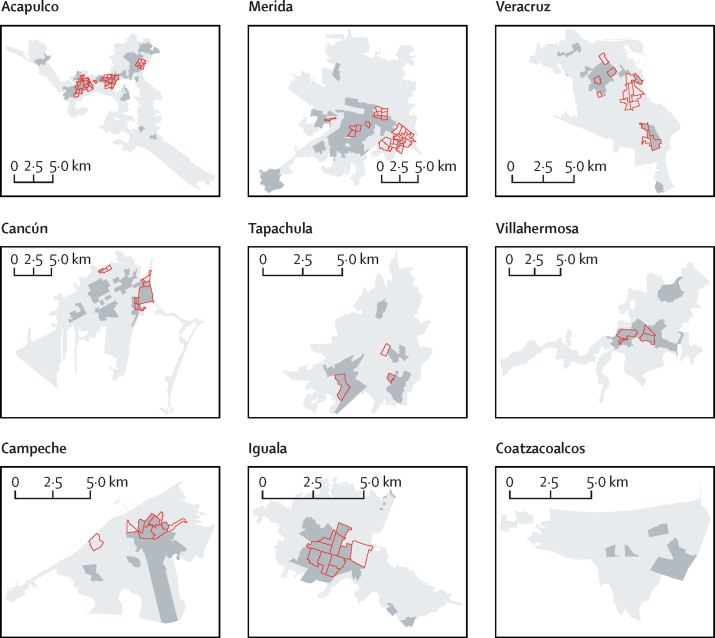
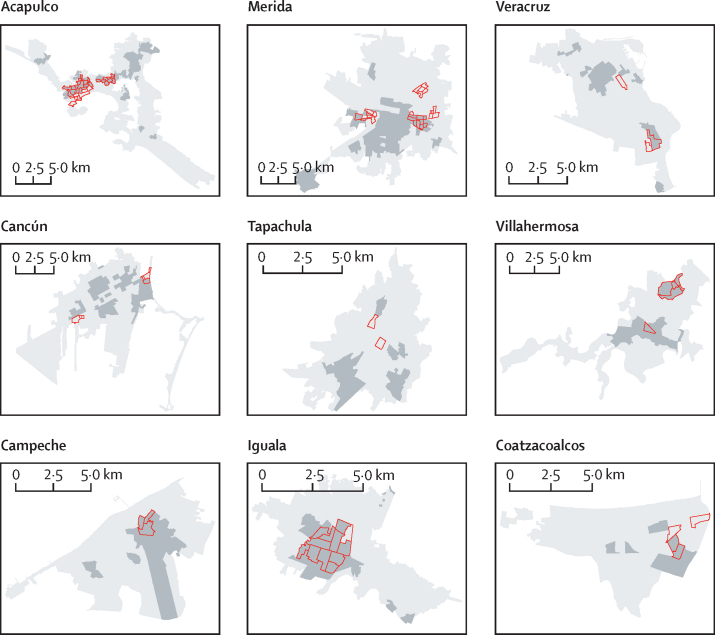
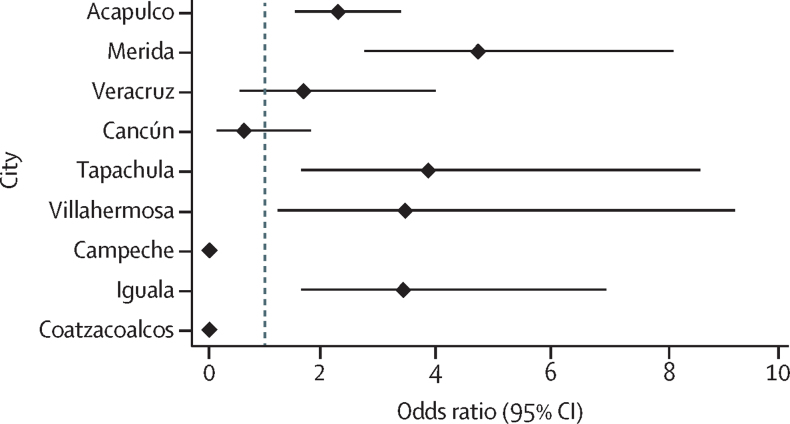
Findings: 128 507 dengue, 4752 chikungunya and 25 755 Zika clinical cases were reported between Jan 1, 2008, and Dec 31, 2016. All cities showed evidence of transmission heterogeneity, with a mean of 17·6% (SD 4·7) of their total area identified as persistent disease hotspots. Hotspots accounted for 25·6% (SD 9·7; range 12·8-43·0) of the population and 32·1% (10·5; 19·6-50·5) of all Aedes-borne disease cases reported. We found an overlap between hotspots of 61·7% for dengue and Zika and 53·3% for dengue and chikungunya. Dengue hotspots in 2008-16 were significantly associated with dengue hotspots detected during 2017-20 in five of the nine cities. Heads of vector control confirmed hotspot areas as problem zones for arbovirus transmission.
Interpretation: This study provides evidence of the overlap of Aedes-borne diseases within geographical hotspots and a methodological framework for the stratification of arbovirus transmission risk within urban areas, which can guide the implementation of surveillance and vector control.
Funding: USAID, the US Centers for Disease Control and Prevention, the Canadian Institutes of Health Research, International Development Research Centre, Fondo Mixto CONACyT (Mexico)-Gobierno del Estado de Yucatan, and the US National Institutes of Health.
Translation: For the Spanish translation of the abstract see Supplementary Materials section.
Copyright © 2021 The Author(s). Published by Elsevier Ltd. This is an Open Access article under the CC BY 4.0 license. Published by Elsevier Ltd.. All rights reserved.
Conflict of interest statement
Declaration of interests We declare no competing interests.
Figures
Comment in
-
Dengue diagnostic test use to identify Aedes-borne disease hotspots.Lancet Planet Health. 2021 Aug;5(8):e503. doi: 10.1016/S2542-5196(21)00174-1. Lancet Planet Health. 2021. PMID: 34390665 No abstract available.
References
-
- Pan American Health Organization. WHO Chikungunya: epidemiological alerts and updates. https://www.paho.org/hq/index.php?option=com_topics&view=dmore&cid=2631&...
Publication types
MeSH terms
Grants and funding
LinkOut - more resources
Full Text Sources
Other Literature Sources
Medical
Research Materials
