

Identification of Distinct Clinical Subphenotypes in Critically Ill Patients With COVID-19
- PMID: 33964301
- PMCID: PMC8099539
- DOI: 10.1016/j.chest.2021.04.062
Identification of Distinct Clinical Subphenotypes in Critically Ill Patients With COVID-19
Abstract
Background: Subphenotypes have been identified in patients with sepsis and ARDS and are associated with different outcomes and responses to therapies.
Research question: Can unique subphenotypes be identified among critically ill patients with COVID-19?
Study design and methods: Using data from a multicenter cohort study that enrolled critically ill patients with COVID-19 from 67 hospitals across the United States, we randomly divided centers into discovery and replication cohorts. We used latent class analysis independently in each cohort to identify subphenotypes based on clinical and laboratory variables. We then analyzed the associations of subphenotypes with 28-day mortality.
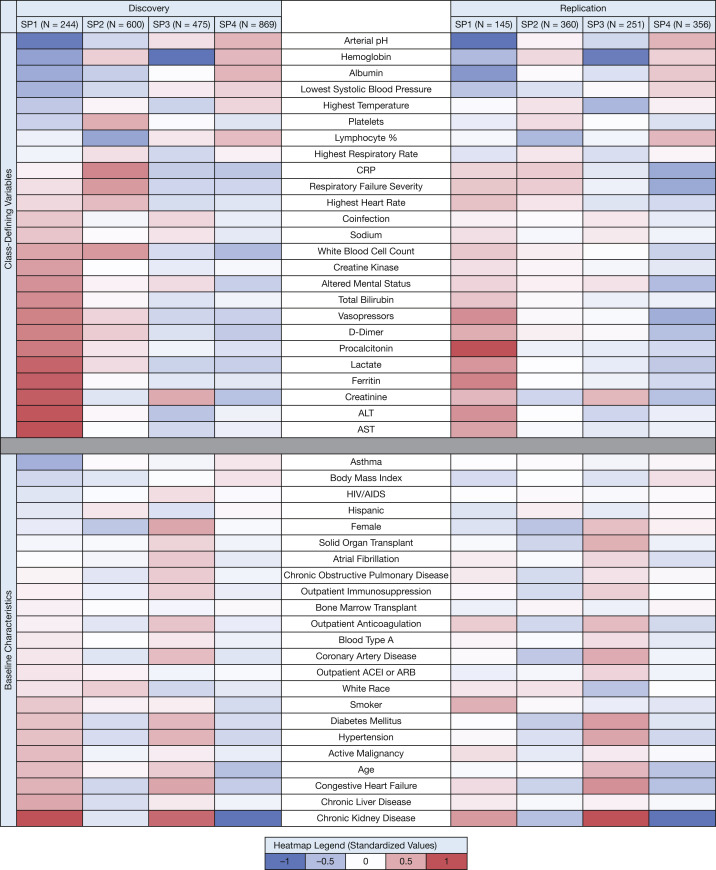
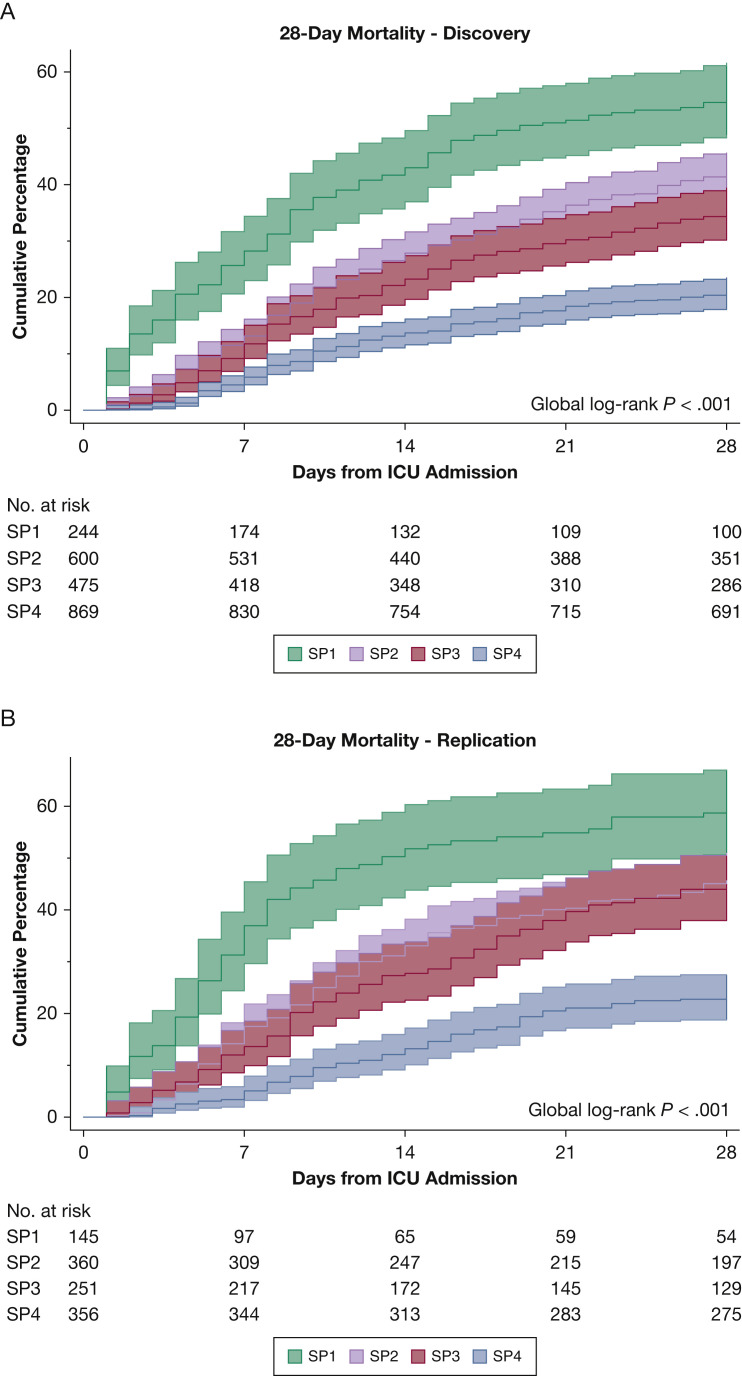
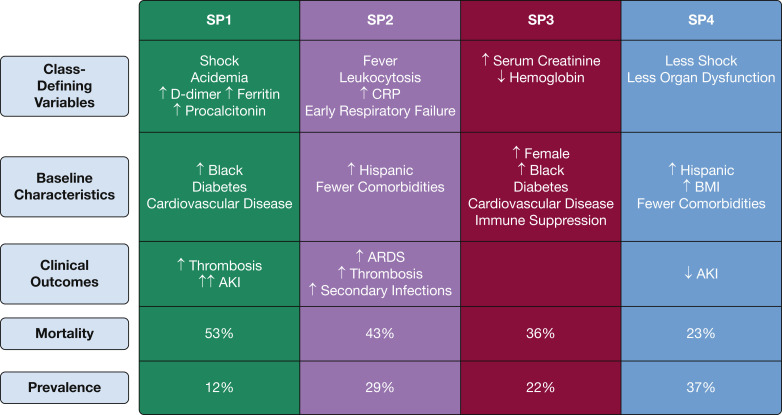
Results: Latent class analysis identified four subphenotypes (SP) with consistent characteristics across the discovery (45 centers; n = 2,188) and replication (22 centers; n = 1,112) cohorts. SP1 was characterized by shock, acidemia, and multiorgan dysfunction, including acute kidney injury treated with renal replacement therapy. SP2 was characterized by high C-reactive protein, early need for mechanical ventilation, and the highest rate of ARDS. SP3 showed the highest burden of chronic diseases, whereas SP4 demonstrated limited chronic disease burden and mild physiologic abnormalities. Twenty-eight-day mortality in the discovery cohort ranged from 20.6% (SP4) to 52.9% (SP1). Mortality across subphenotypes remained different after adjustment for demographics, comorbidities, organ dysfunction and illness severity, regional and hospital factors. Compared with SP4, the relative risks were as follows: SP1, 1.67 (95% CI, 1.36-2.03); SP2, 1.39 (95% CI, 1.17-1.65); and SP3, 1.39 (95% CI, 1.15-1.67). Findings were similar in the replication cohort.
Interpretation: We identified four subphenotypes of COVID-19 critical illness with distinct patterns of clinical and laboratory characteristics, comorbidity burden, and mortality.
Keywords: COVID-19; coronavirus; latent class analysis; phenotypes; subphenotypes.
Copyright © 2021 American College of Chest Physicians. Published by Elsevier Inc. All rights reserved.
Figures
Comment in
-
Clinical Subphenotypes in Critically Ill Patients With COVID-19: Now Looking for Different Treatment Responses!Chest. 2021 Sep;160(3):795-796. doi: 10.1016/j.chest.2021.05.042. Chest. 2021. PMID: 34488952 Free PMC article. No abstract available.
References
-
- Wiersinga W.J., Rhodes A., Cheng A.C., Peacock S.J., Prescott H.C. Pathophysiology, transmission, diagnosis, and treatment of coronavirus disease 2019 (COVID-19): a review. JAMA. 2020;324(8):782–793. - PubMed
-
- Marini J.J., Gattinoni L. Management of COVID-19 respiratory distress. JAMA. 2020;323(22):2329–2330. - PubMed
-
- Spyropoulos A.C., Weitz J.I. Hospitalized COVID-19 patients and venous thromboembolism: a perfect storm. Circulation. 2020;142(2):129–132. - PubMed
Publication types
MeSH terms
Grants and funding
LinkOut - more resources
Full Text Sources
Other Literature Sources
Medical
Research Materials
