

Dysregulation of the ESRP2-NF2-YAP/TAZ axis promotes hepatobiliary carcinogenesis in non-alcoholic fatty liver disease
- PMID: 33964370
- PMCID: PMC8380690
- DOI: 10.1016/j.jhep.2021.04.033
Dysregulation of the ESRP2-NF2-YAP/TAZ axis promotes hepatobiliary carcinogenesis in non-alcoholic fatty liver disease
Abstract
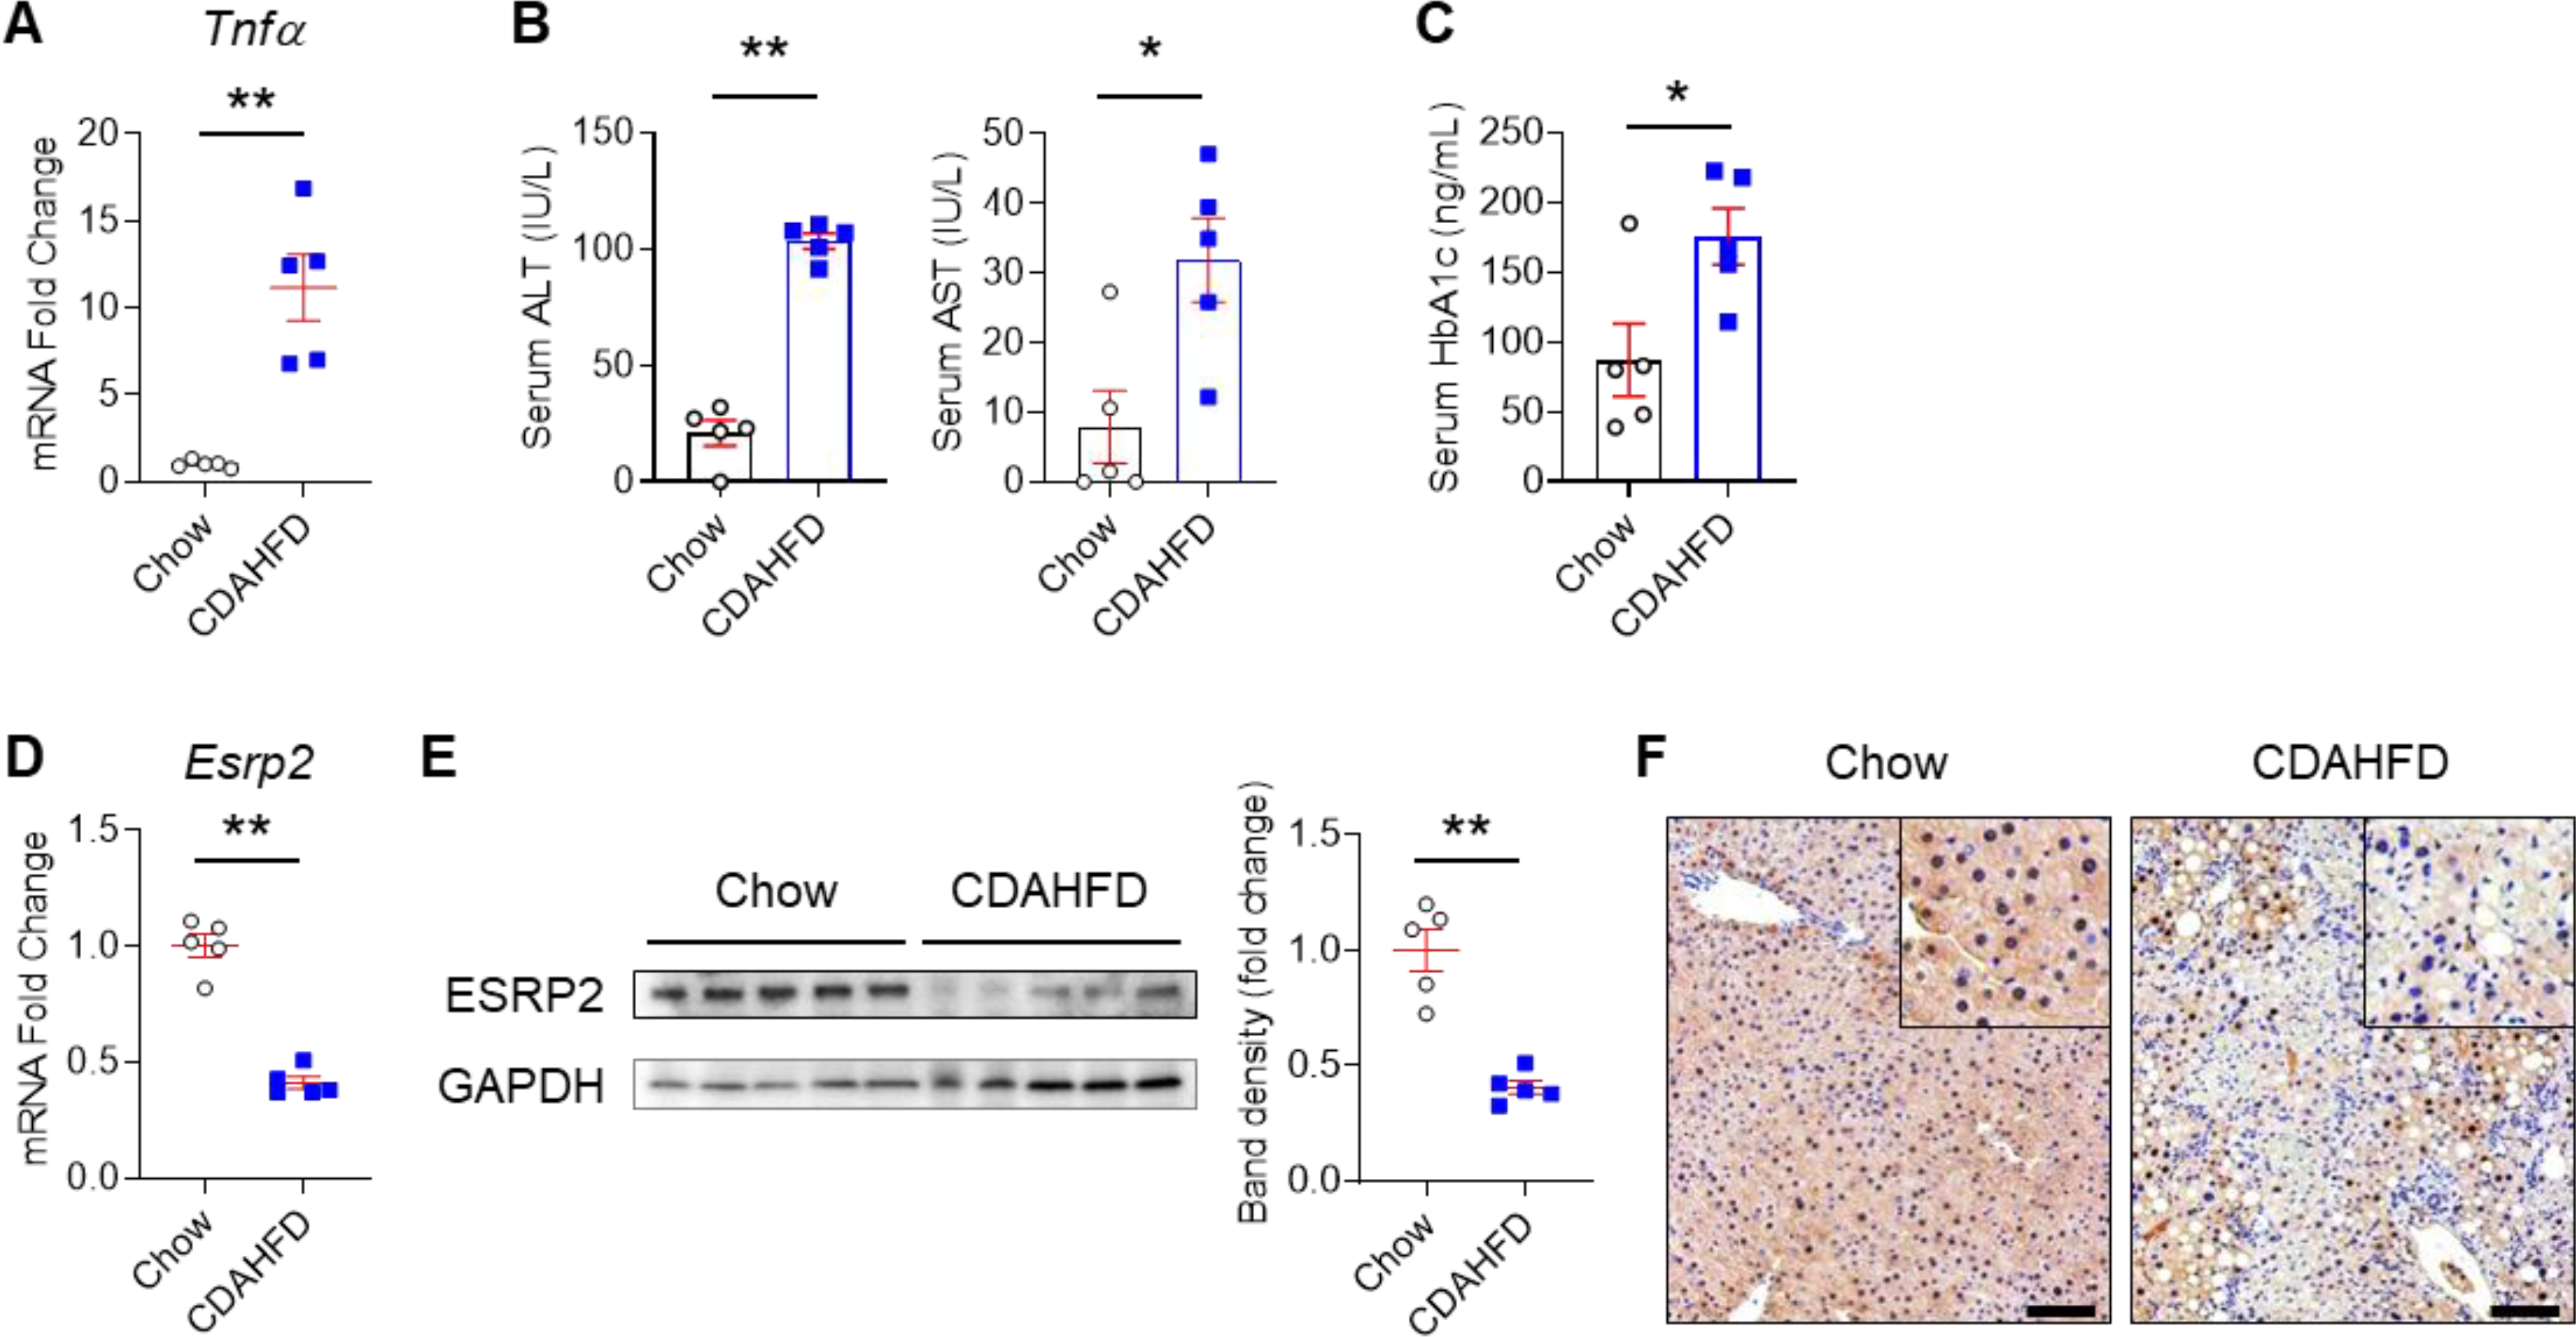
Background & aims: Non-alcoholic fatty liver disease (NAFLD), the hepatic correlate of the metabolic syndrome, is a major risk factor for hepatobiliary cancer (HBC). Although chronic inflammation is thought to be the root cause of all these diseases, the mechanism whereby it promotes HBC in NAFLD remains poorly understood. Herein, we aim to evaluate the hypothesis that inflammation-related dysregulation of the ESRP2-NF2-YAP/TAZ axis promotes HB carcinogenesis.
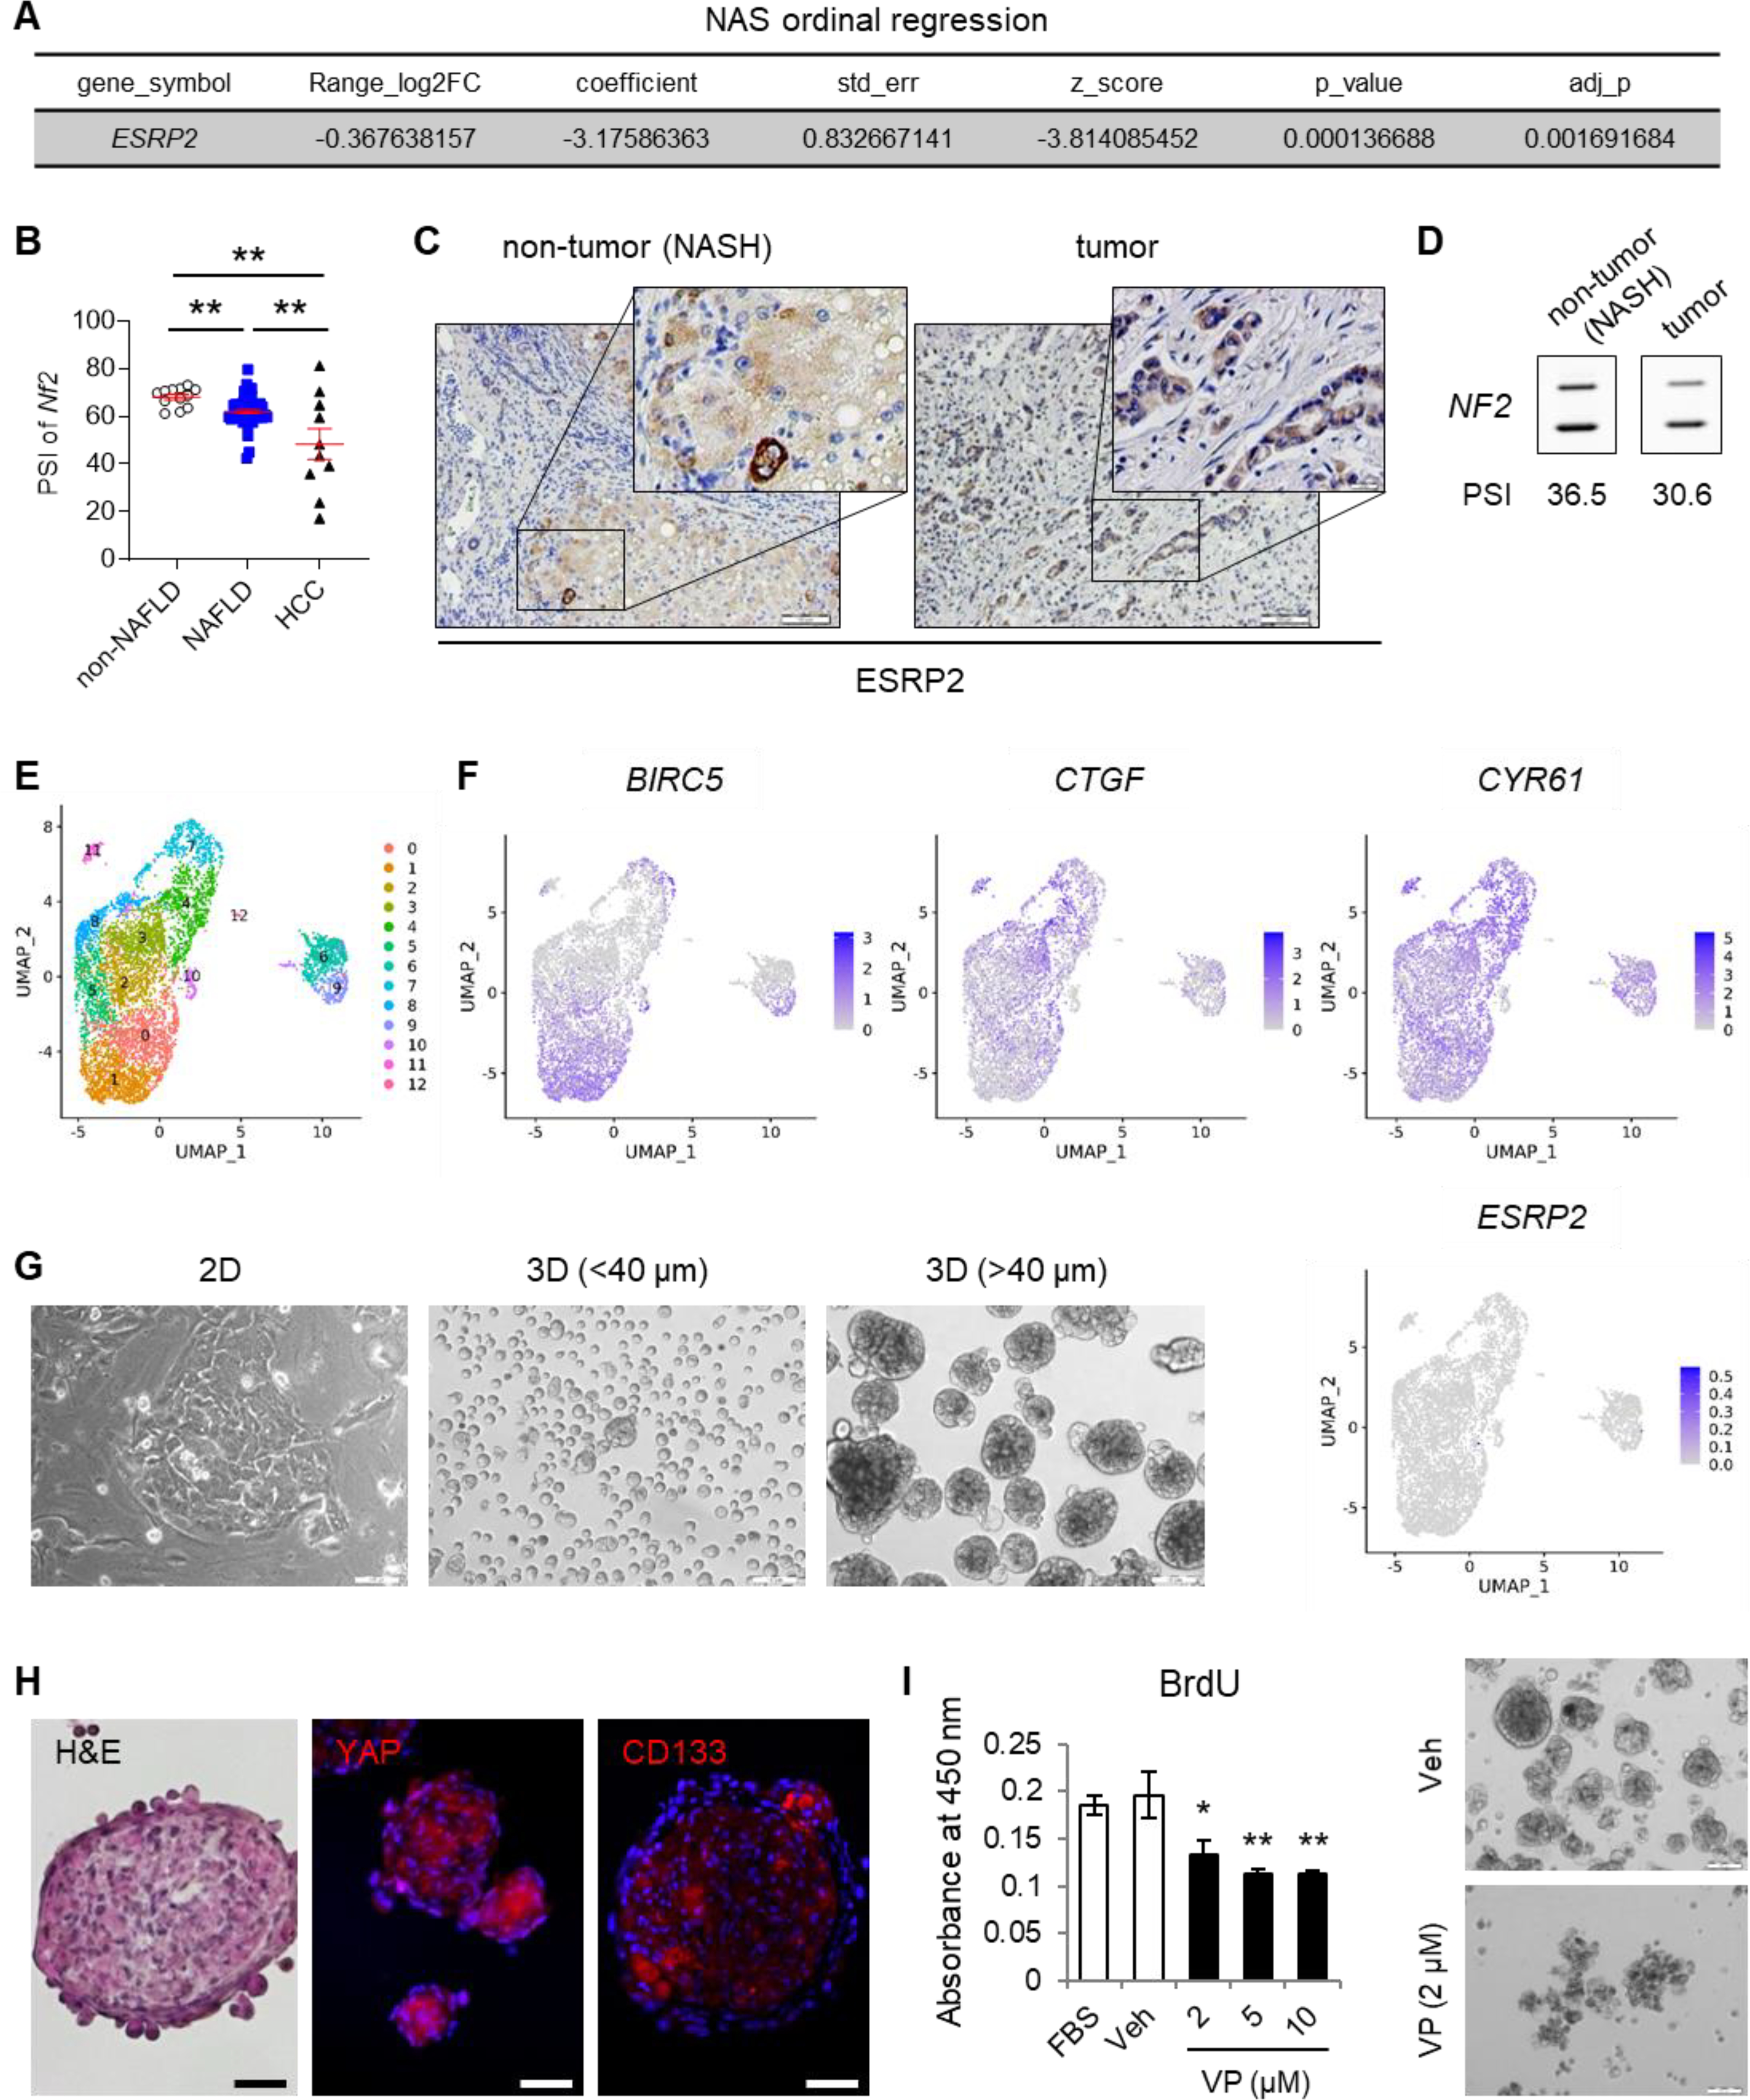
Methods: We use murine NAFLD models, liver biopsies from patients with NAFLD, human liver cancer registry data, and studies in liver cancer cell lines.
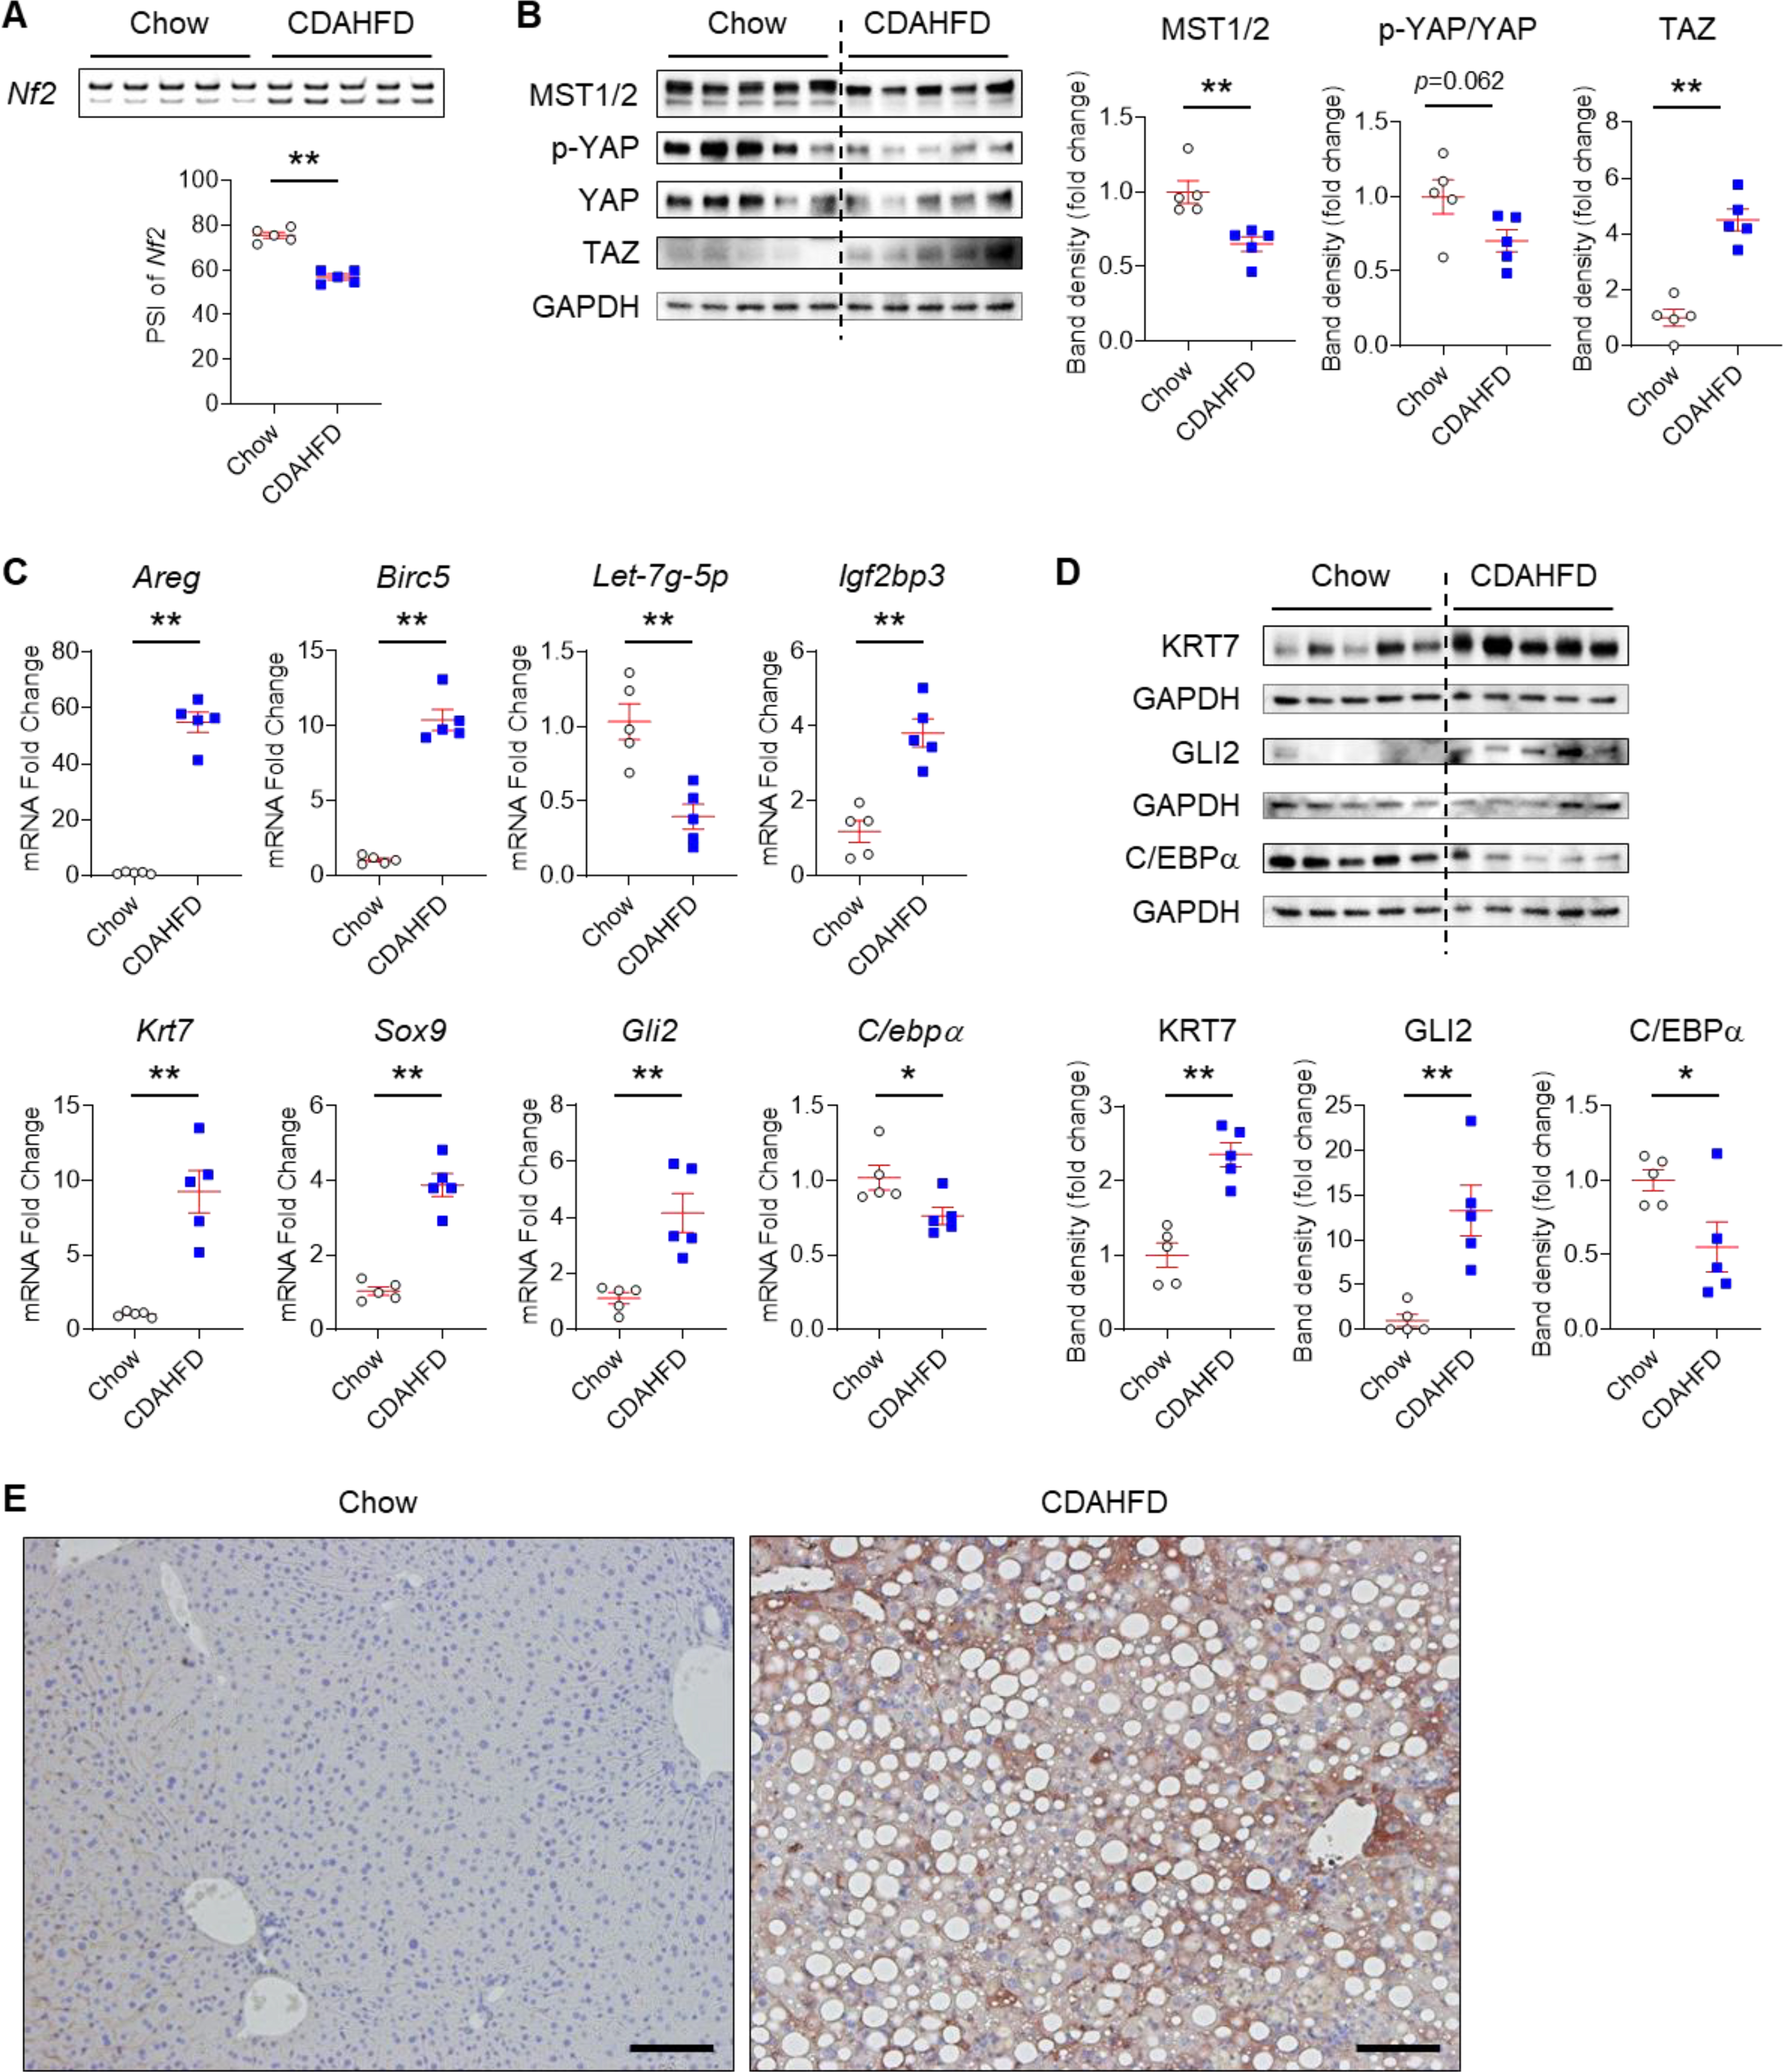
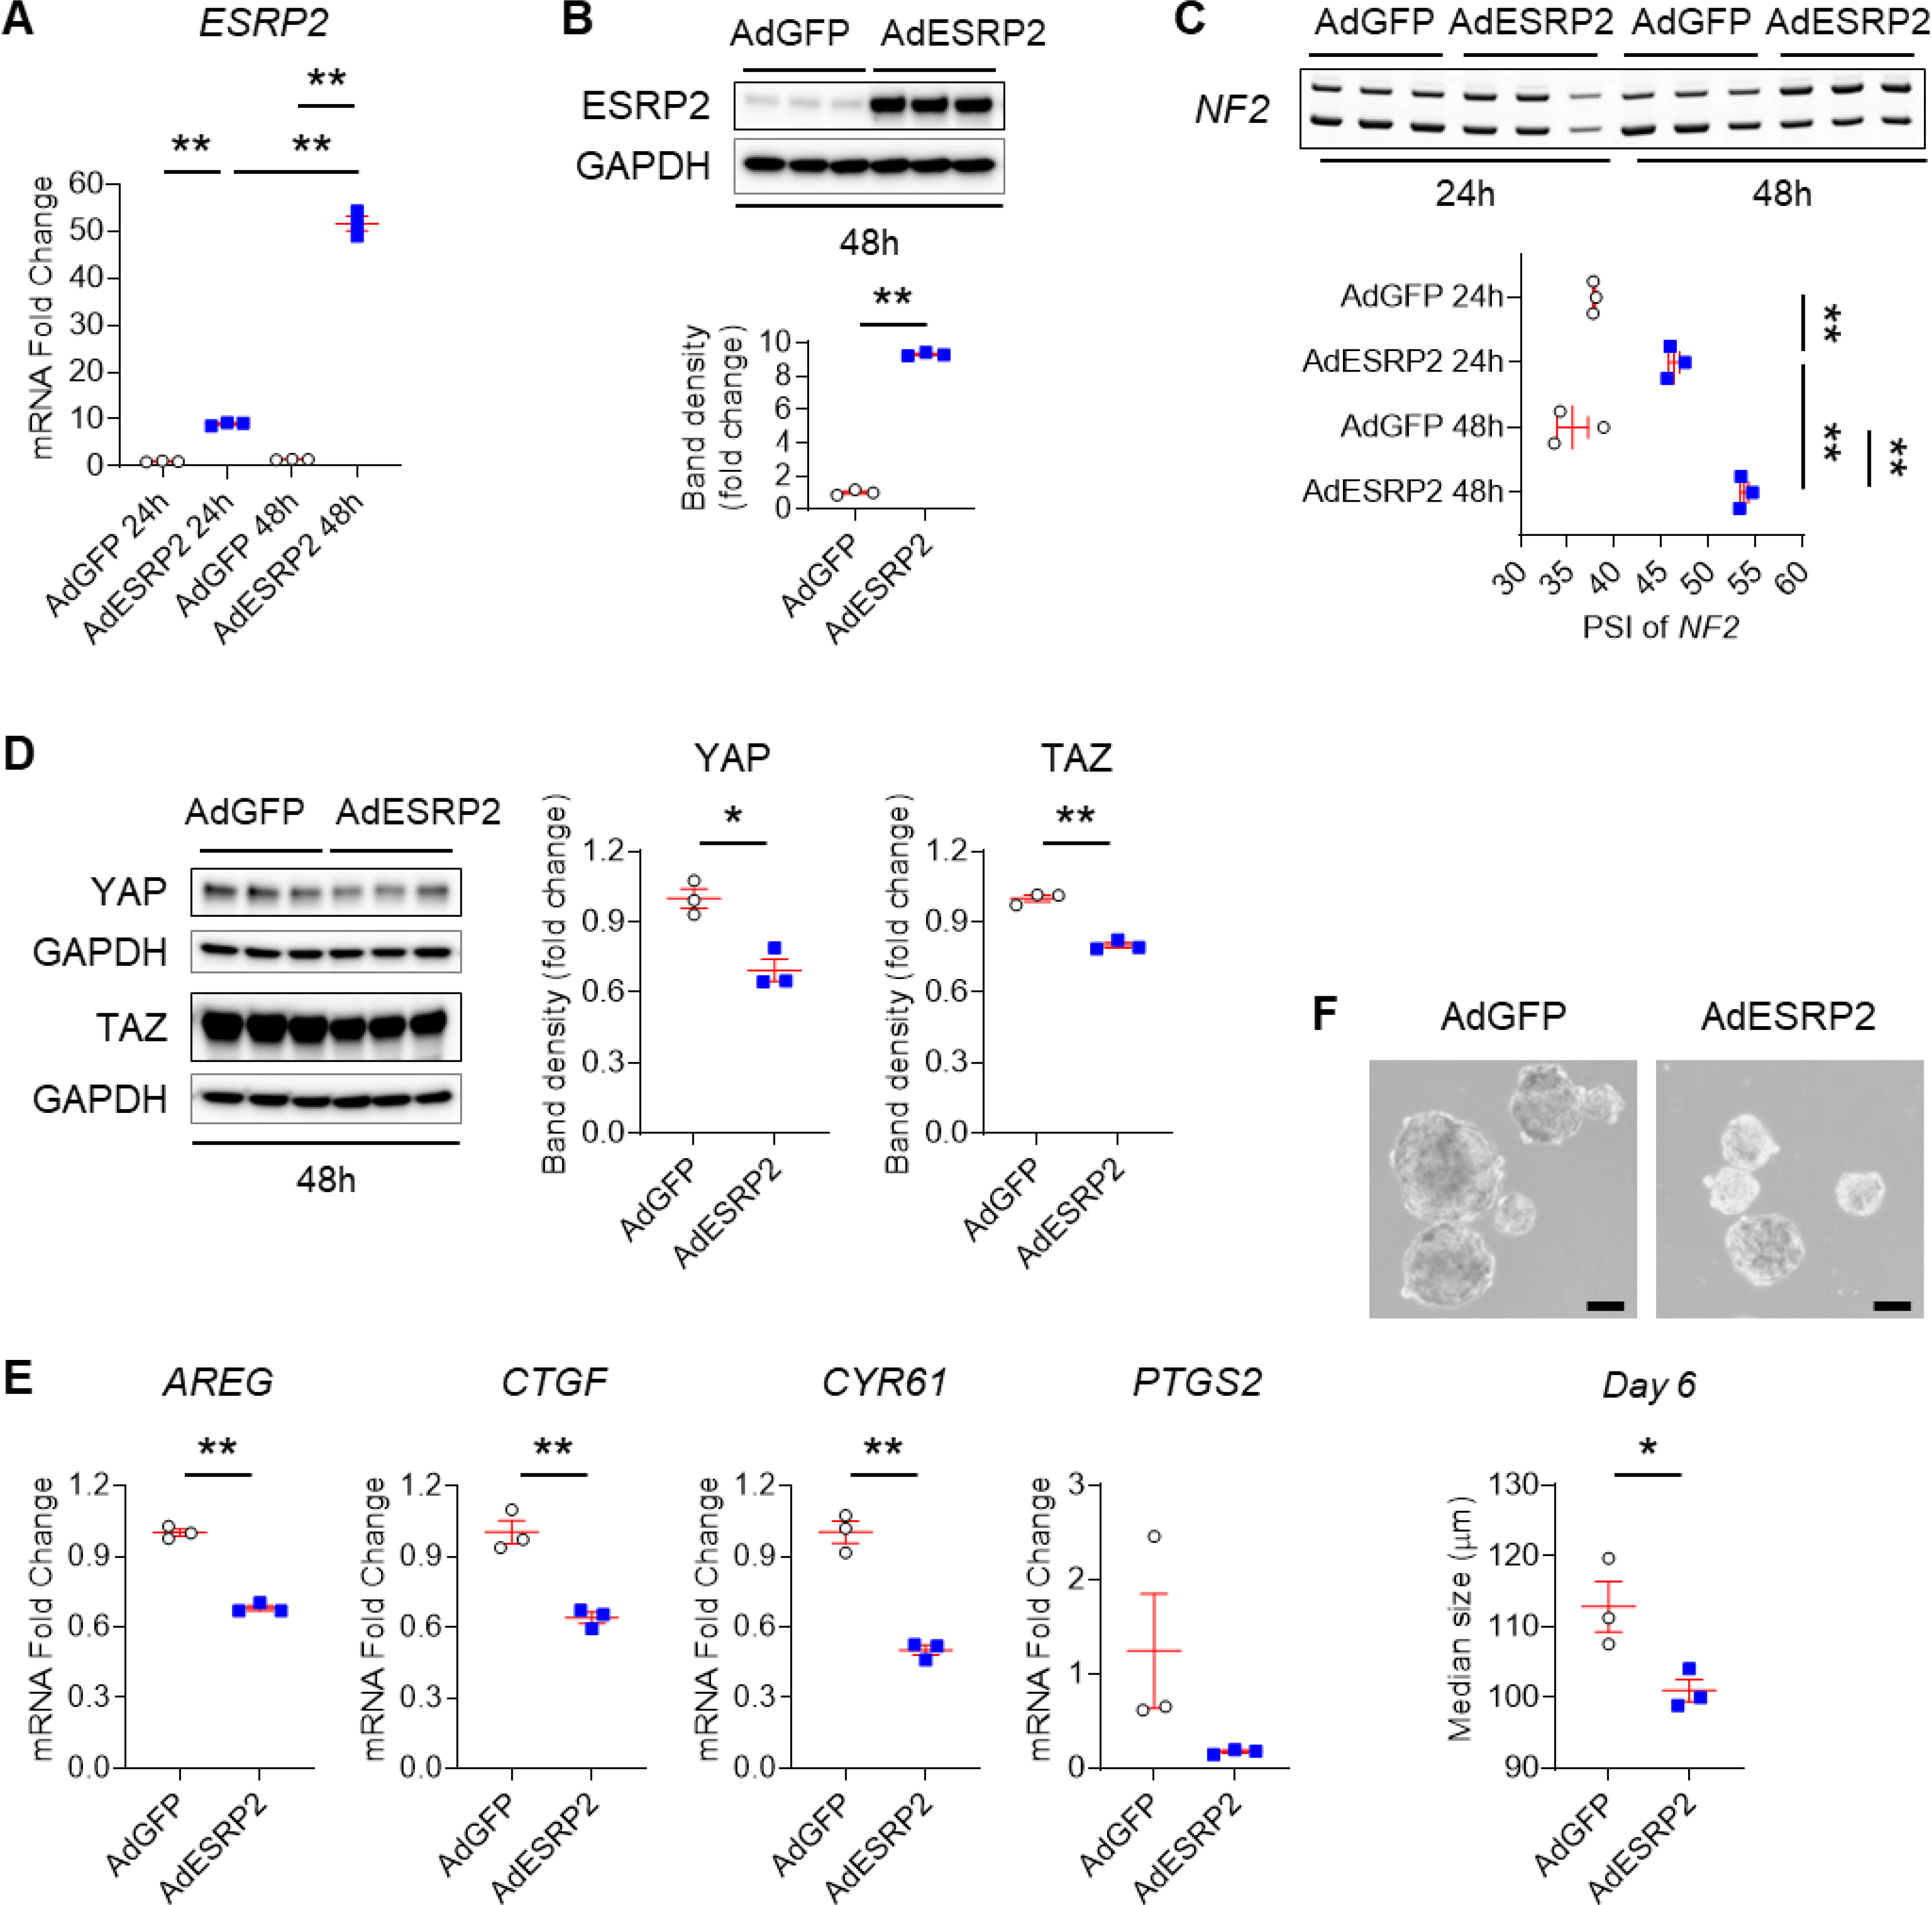
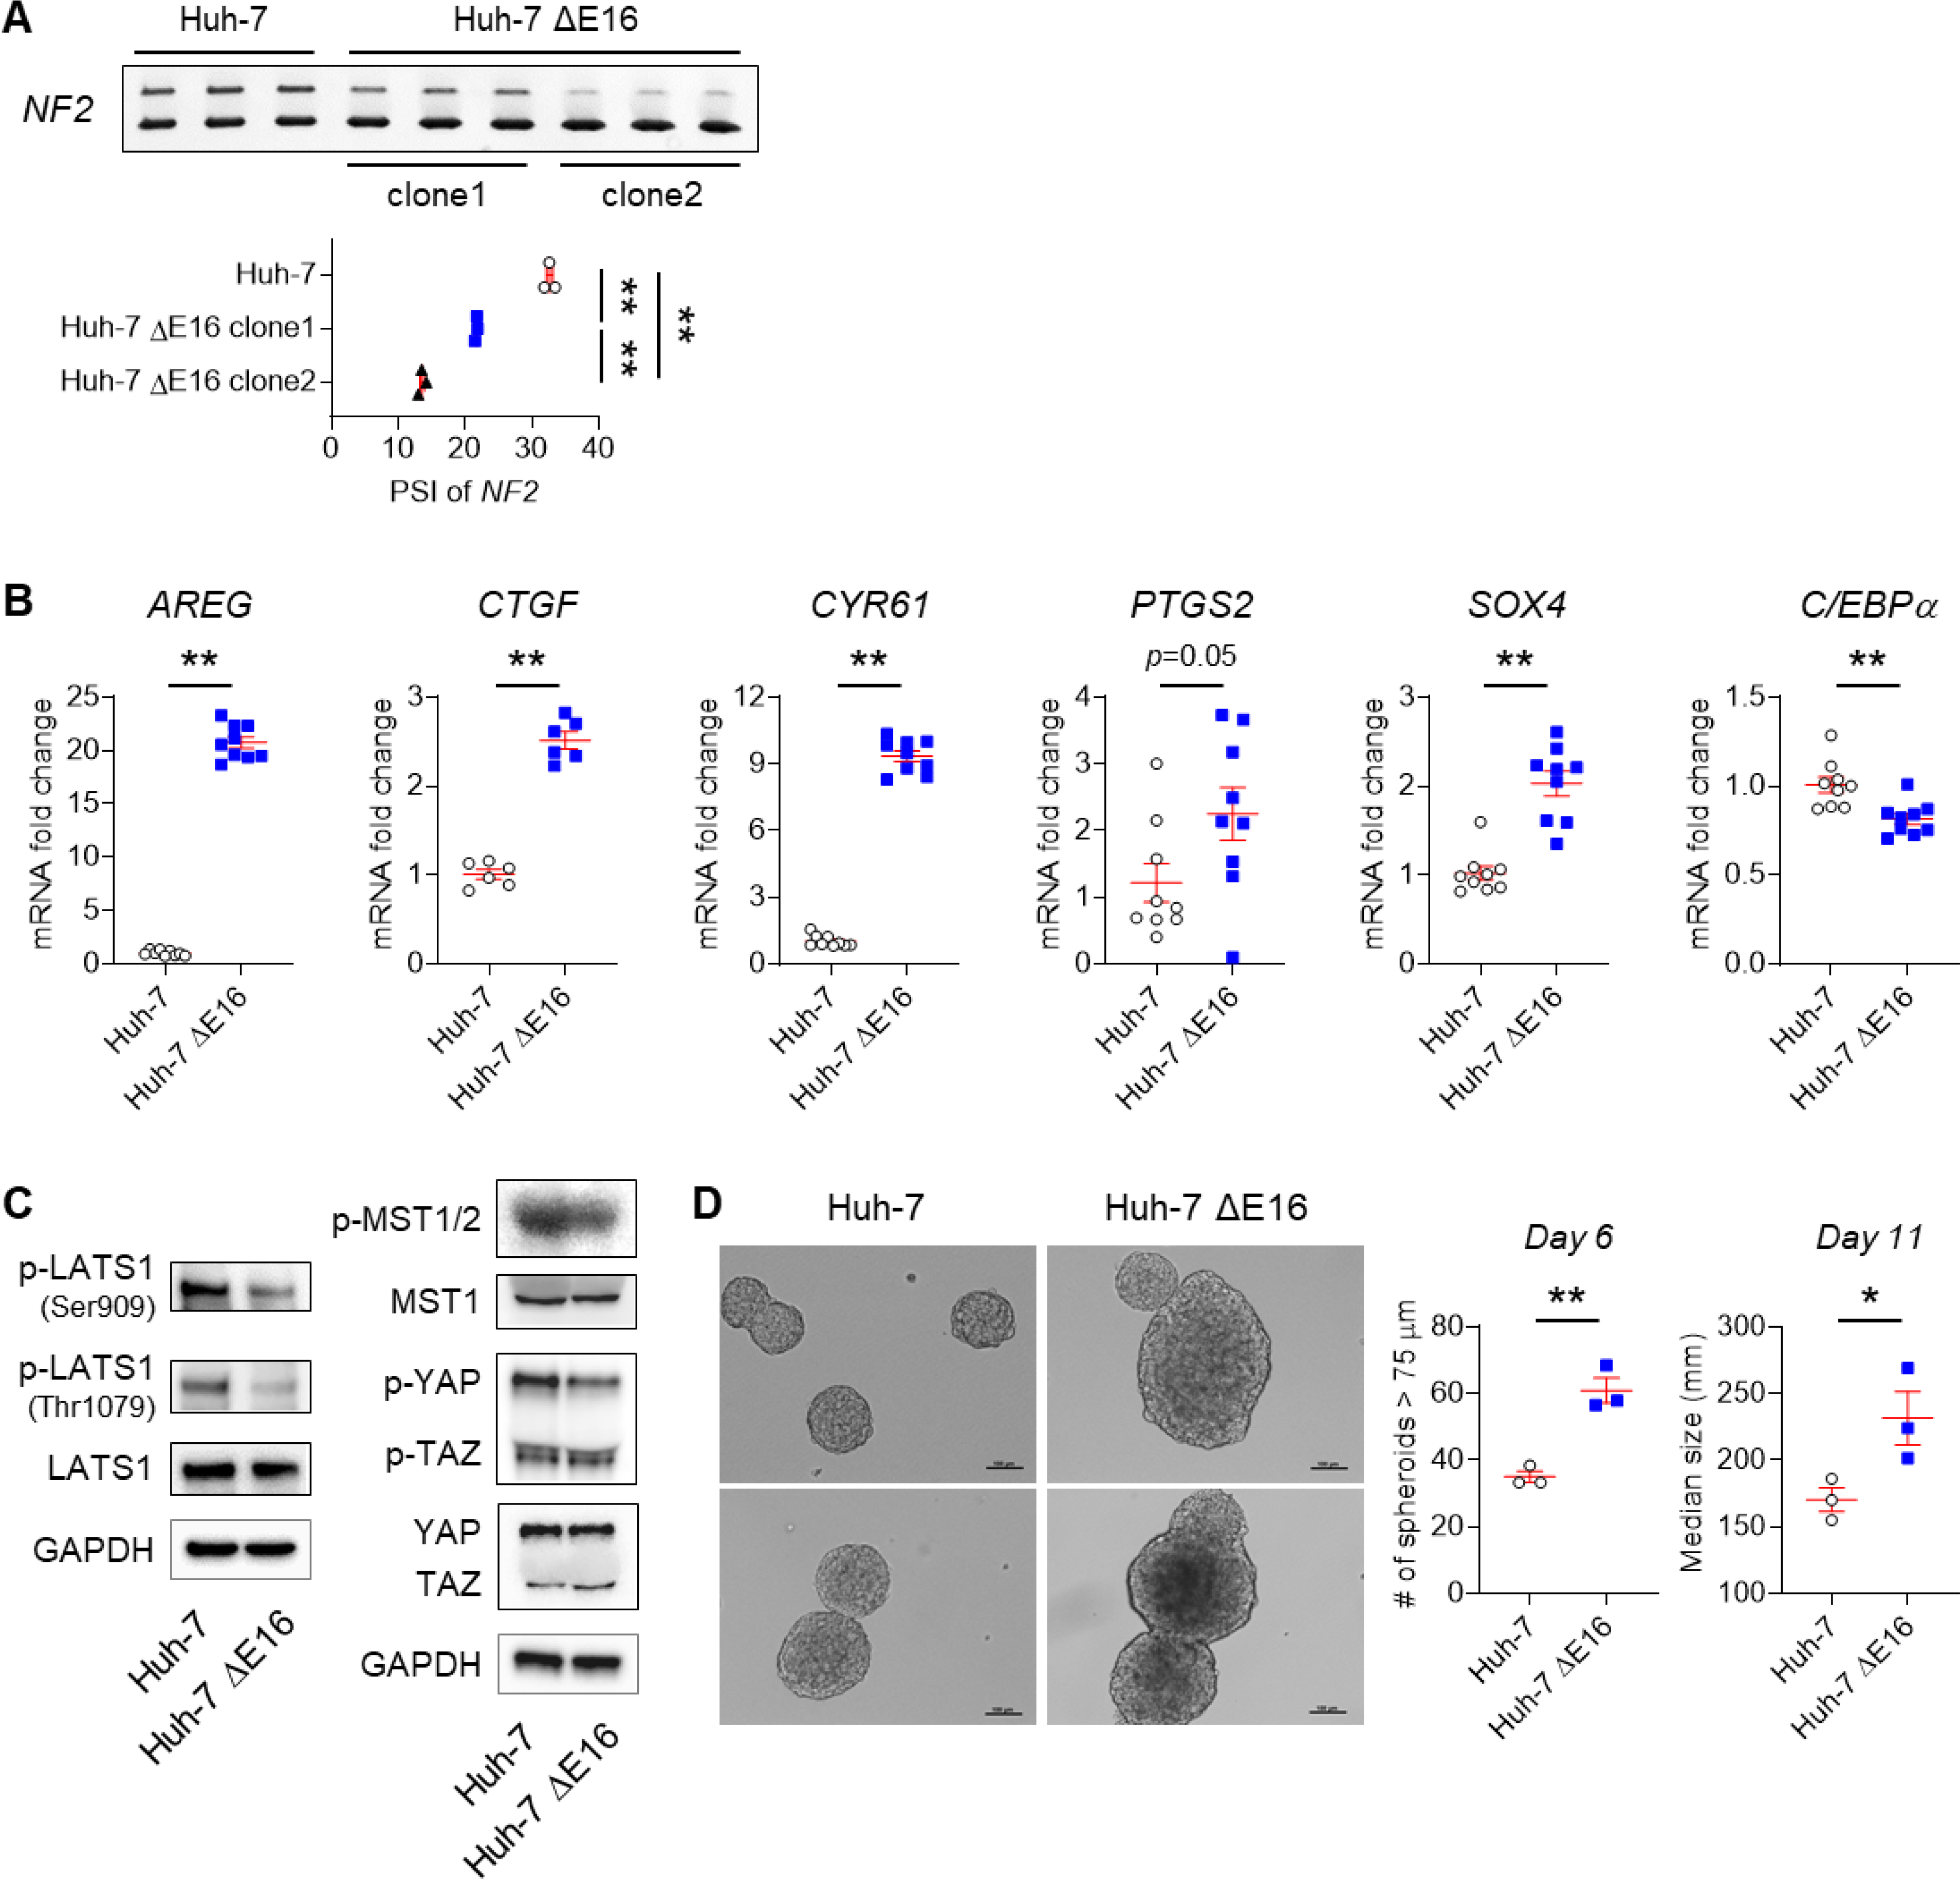
Results: Our results confirm the hypothesis that inflammation-related dysregulation of the ESRP2-NF2-YAP/TAZ axis promotes HB carcinogenesis, supporting a model whereby chronic inflammation suppresses hepatocyte expression of ESRP2, an RNA splicing factor that directly targets and activates NF2, a tumor suppressor that is necessary to constrain YAP/TAZ activation. The resultant loss of NF2 function permits sustained YAP/TAZ activity that drives hepatocyte proliferation and de-differentiation.
Conclusion: Herein, we report on a novel mechanism by which chronic inflammation leads to sustained activation of YAP/TAZ activity; this imposes a selection pressure that favors liver cells with mutations enabling survival during chronic oncogenic stress.
Lay summary: Non-alcoholic fatty liver disease (NAFLD) increases the risk of hepatobiliary carcinogenesis. However, the underlying mechanism remains unknown. Our study demonstrates that chronic inflammation suppresses hepatocyte expression of ESRP2, an adult RNA splicing factor that activates NF2. Thus, inactive (fetal) NF2 loses the ability to activate Hippo kinases, leading to the increased activity of downstream YAP/TAZ and promoting hepatobiliary carcinogenesis in chronically injured livers.
Keywords: alternative RNA splicing; epithelial splicing regulatory protein-2 (ESRP2); hepatocellular carcinoma (HCC); hippo kinase; liver cancer; neurofibromatosis-2 (NF2); nonalcoholic fatty liver disease (NAFLD); yes-associated protein (YAP).
Copyright © 2021 The Author(s). Published by Elsevier B.V. All rights reserved.
Conflict of interest statement
Conflict of interest The authors have declared that no conflict of interest exists. Please refer to the accompanying ICMJE disclosure forms for further details.
Figures

Similar articles
-
WWC1 and NF2 Prevent the Development of Intrahepatic Cholangiocarcinoma by Regulating YAP/TAZ Activity through LATS in Mice.Mol Cells. 2020 May 31;43(5):491-499. doi: 10.14348/molcells.2020.0093. Mol Cells. 2020. PMID: 32451369 Free PMC article.
-
YAP/TAZ Inhibition Induces Metabolic and Signaling Rewiring Resulting in Targetable Vulnerabilities in NF2-Deficient Tumor Cells.Dev Cell. 2019 May 6;49(3):425-443.e9. doi: 10.1016/j.devcel.2019.04.014. Dev Cell. 2019. PMID: 31063758 Free PMC article.
-
Hepatocyte Stress Increases Expression of Yes-Associated Protein and Transcriptional Coactivator With PDZ-Binding Motif in Hepatocytes to Promote Parenchymal Inflammation and Fibrosis.Hepatology. 2020 May;71(5):1813-1830. doi: 10.1002/hep.30928. Epub 2020 Jan 3. Hepatology. 2020. PMID: 31505040 Free PMC article.
-
Physiological and pathological roles of the Hippo-YAP/TAZ signaling pathway in liver formation, homeostasis, and tumorigenesis.Cancer Sci. 2022 Jun;113(6):1900-1908. doi: 10.1111/cas.15352. Epub 2022 Apr 17. Cancer Sci. 2022. PMID: 35349740 Free PMC article. Review.
-
Hepatic Hippo signaling inhibits development of hepatocellular carcinoma.Clin Mol Hepatol. 2020 Oct;26(4):742-750. doi: 10.3350/cmh.2020.0178. Epub 2020 Sep 28. Clin Mol Hepatol. 2020. PMID: 32981290 Free PMC article. Review.
Cited by
-
Research and development prospects of TRIM65.J Cancer Res Clin Oncol. 2025 Aug 22;151(8):232. doi: 10.1007/s00432-025-06285-9. J Cancer Res Clin Oncol. 2025. PMID: 40844633 Free PMC article. Review.
-
Lipophilic statins inhibit YAP coactivator transcriptional activity in HCC cells through Rho-mediated modulation of actin cytoskeleton.Am J Physiol Gastrointest Liver Physiol. 2023 Sep 1;325(3):G239-G250. doi: 10.1152/ajpgi.00089.2023. Epub 2023 Jun 27. Am J Physiol Gastrointest Liver Physiol. 2023. PMID: 37366601 Free PMC article.
-
ESRP2-microRNA-122 axis promotes the postnatal onset of liver polyploidization and maturation.Genes Dev. 2025 Mar 3;39(5-6):325-347. doi: 10.1101/gad.352129.124. Genes Dev. 2025. PMID: 39794125 Free PMC article.
-
Mouse models of nonalcoholic fatty liver disease (NAFLD): pathomechanisms and pharmacotherapies.Int J Biol Sci. 2022 Sep 6;18(15):5681-5697. doi: 10.7150/ijbs.65044. eCollection 2022. Int J Biol Sci. 2022. PMID: 36263163 Free PMC article. Review.
-
Dysregulation of RNA splicing in early non-alcoholic fatty liver disease through hepatocellular carcinoma.Sci Rep. 2024 Jan 30;14(1):2500. doi: 10.1038/s41598-024-52237-7. Sci Rep. 2024. PMID: 38291075 Free PMC article.
References
-
- Baffy G, Brunt EM, Caldwell SH. Hepatocellular carcinoma in non-alcoholic fatty liver disease: an emerging menace. J Hepatol 2012;56:1384–1391. - PubMed
-
- Alexander J, Torbenson M, Wu TT, Yeh MM. Non-alcoholic fatty liver disease contributes to hepatocarcinogenesis in non-cirrhotic liver: A clinical and pathological study. J Gastroenterol Hepatol 2013;28:848–854. - PubMed
-
- Lonardo A, Ballestri S, Marchesini G, Angulo P, Loria P. Nonalcoholic fatty liver disease: a precursor of the metabolic syndrome. Dig Liver Dis 2015;47:181–190. - PubMed
Publication types
MeSH terms
Substances
Grants and funding
LinkOut - more resources
Full Text Sources
Other Literature Sources
Medical
Research Materials
Miscellaneous
