. 2021 Aug:104:32-41.
doi: 10.1016/j.neurobiolaging.2021.03.005. Epub 2021 Mar 12.

Follistatin-induced muscle hypertrophy in aged mice improves neuromuscular junction innervation and function

Affiliations

Follistatin-induced muscle hypertrophy in aged mice improves neuromuscular junction innervation and function

Chitra C Iyer et al. Neurobiol Aging. 2021 Aug.

Abstract

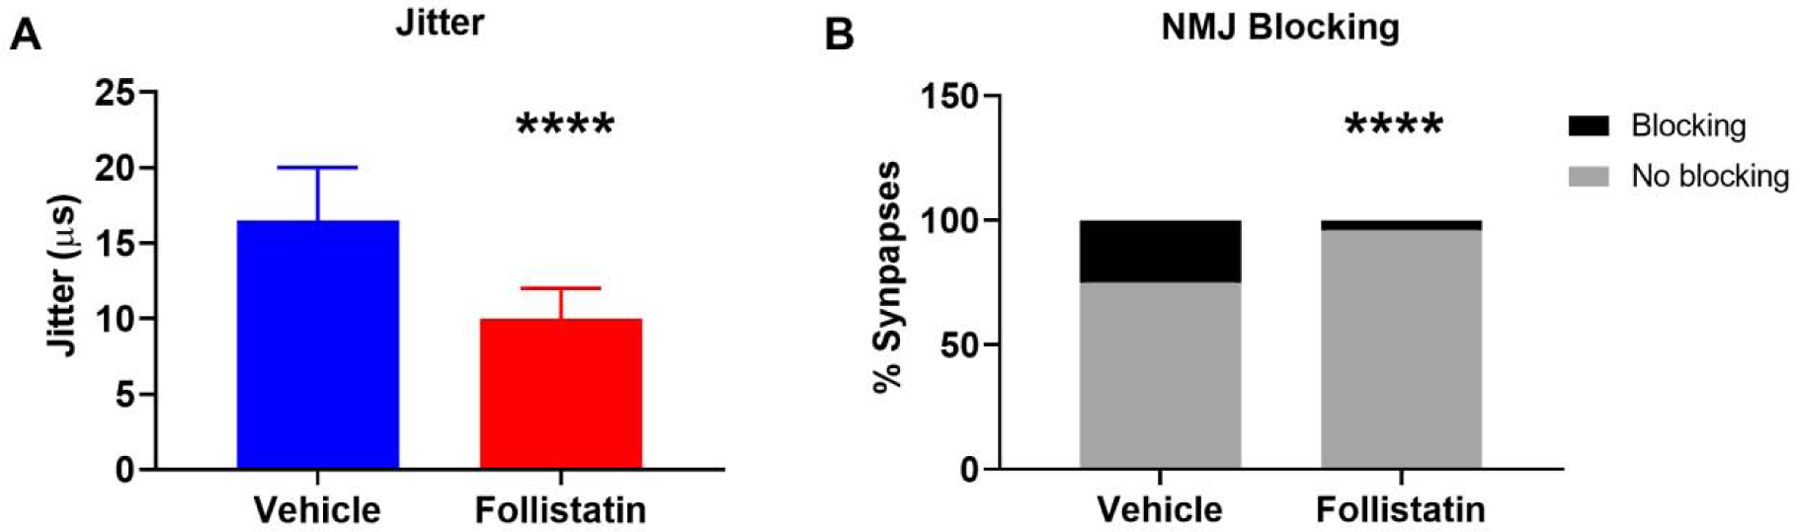
Sarcopenia, or age-related loss of muscle mass and strength, is an important contributor to loss of physical function in older adults. The pathogenesis of sarcopenia is likely multifactorial, but recently the role of neurological degeneration, such as motor unit loss, has received increased attention. Here, we investigated the longitudinal effects of muscle hypertrophy (via overexpression of human follistatin, a myostatin antagonist) on neuromuscular integrity in C57BL/6J mice between the ages of 24 and 27 months. Following follistatin overexpression (delivered via self-complementary adeno-associated virus subtype 9 injection), muscle weight and torque production were significantly improved. Follistatin treatment resulted in improvements of neuromuscular junction innervation and transmission but had no impact on age-related losses of motor units. These studies demonstrate that follistatin overexpression-induced muscle hypertrophy not only increased muscle weight and torque production but also countered age-related degeneration at the neuromuscular junction in mice.

Keywords: Adeno-associated; Contractility; Follistatin; Motor unit number estimate; Myostatin; Neuromuscular junction; Sarcopenia; Single fiber electromyography; Tetanic; Twitch.


Conflict of interest statement

Disclosure statement The authors have no conflicts of interests to report.

Figures

Figure 1.
Figure 1.. Study Timeline.
AAV-FST344 was injected in the right and left gastrocnemius and tibialis anterior muscles in equal volumes to a total dosage of 1.13 × 10¹¹ vg/mouse. Physiological measurements of motor unit and muscle function were done at baseline before injection and then every two weeks after the injection for 12 weeks. The mice were euthanized at 12 weeks post-injection at the age of 27 months for the measurement of wet muscle mass and morphological and biochemical analyses of muscle tissues.
Figure 2.
Figure 2.. Human FST overexpression following AAV-9 and expression of endogenous FST and myostatin with age and following AAV9-FST injection.
(A) Overexpression of human FST following AAV9-FST. Human FST protein expression was increased in gastrocnemius muscle homogenate from FST-injected mice [n=10 (8 males, 2 females)] compared with vehicle-injected controls [n=9 (6 males, 3 females),] at end point (Mann-Whitney, p=0.0004). (B) Left: Endogenous Mouse FST in Untreated Mice. Endogenous mouse FST protein expression showed a significant change over time in aged untreated C57BL/6J mice (Kruskal-Wallis test: p=0.0405). On multiple comparisons to 12 months (Dunn’s multiple comparison test), follistatin expression at 27 months was significantly increased versus 12 months (p=0.0231), but there was no significant difference between 24 versus 12 months (p=0.2054). [12 months: n=6 (3 males, 3 females); 24 months: n=9 (5 males, 4 females); 27 months: n=8 (4 males, 4 females)]. Right: Mouse FST following AAV9-FST. Endogenous mouse FST protein expression was similar between vehicle [n=9 (6 males, 3 females) and AAV9-FST treated mice [n=9 (4 males, 5 females)] (Mann-Whitney, p=0.7304). (C) Left: Endogenous Mouse FST in Untreated Mice. Endogenous mouse myostatin levels did not show statistically significant changes between 12 and 27 months of age in untreated mice (one way ANOVA, F (2, 16) = 3.097, p=0.0730, multiple comparisons to 12 months (Dunnett’s multiple comparisons test): 12 m vs 24: p=0.2039 and 12m vs 27m: p=0.8826 [12 months: n=4 (2 males, 2 females); 24 months: n=8 (4 males, 4 females); 27 months: n=7 (4 males, 3 females)] Right: Endogenous Mouse Myostatin following AAV9-FST. Mouse myostatin protein expression was similar between vehicle [n=6 (5 males, 1 female)] and AAV9-FST [n=4 (3 males, 1 female)] treated mice (unpaired t-test, p=0.4937). Data shown as mean ± standard deviation for mouse follistatin and as median ± 95% confidence interval for mouse and human FST. *** p<0.001 * p<0.05
Figure 3.
Figure 3.. Injection of AAV9-FST increased muscle weights.
(A) AAV9-FST injected mice demonstrated significantly increased gastrocnemius muscle weight (unpaired t-test, p=0.0066). (B-C) Similar trends were seen in both the soleus (unpaired t-test, p=0.0682) and the triceps brachii (unpaired t-test, p=0.0883). (D) When ratios of muscle weights (to control mean) for gastrocnemius and triceps brachii AAV9-FST-injected mice were compared, there were no significant differences suggesting a similar systemic hypertrophy effect at the site of AAV9-FST injection and remotely (One Way ANOVA, F (2, 42) = 0.3365, p=0.7162). Data shown as mean ± standard deviation. (gastrocnemius and triceps brachii weights). Sample sizes: Vehicle n=13 (10 males, 3 females); AAV9-FST n=16 (10 males, 6 females). One outlier (vehicle male) removed from vehicle soleus weights. ** p<0.01
Figure 4.
Figure 4.. Follistatin overexpression resulted in increased muscle contractility torque.
(A-B) Plantarflexion twitch contractility [shown as absolute (A) and normalized to baseline (B)] demonstrated no change with time (p=0.3931) or treatment alone (p=0.1624) but there was a significant increase of twitch over time in the AAV9-FST treated group (p=0.0089). (C-D) Tetanic contractility [shown as absolute (C) and normalized to baseline (D)] showed significant reduction over time (p=0.0482) and increase with follistatin treatment (p=0.0308) but no interaction between time and treatment (p=0.2183). (E) Muscle twitch torque normalized to gastrocnemius and soleus muscle weight was reduced in the AAV9-FST group compared with the vehicle treated group (p=0.0438). (F) Tetanic contractility normalized to weight of gastrocnemius and soleus muscle was unchanged between groups (p=0.2369). Mixed effect model was used to analyze longitudinal twitch and tetanic values. Unpaired t-test was used to compare twitch and tetanic normalized to muscle mass. Data shown as mean ± standard deviation. [For the longitudinal studies, n=17 mice (11 males, 6 females) per group; for normalized muscle torque at endpoint, n=13 in vehicle (10 males, 3 females) and n=14 in AAV9-FST group (8 males, 6 females)]. * p<0.05, ** p<0.01
Figure 5.
Figure 5.. Follistatin overexpression increases compound muscle action potential (CMAP) amplitude but does not alter single motor unit potential size (SMUP) or motor unit number estimation (MUNE).
(A) CMAP amplitude demonstrated a significant decline with age (p<0.0001). Treatment with AAV9-FST resulted in increased amplitude compared with controls (p=0.0083), but there was no interaction between time and treatment (p=0.8412). (B) SMUP demonstrated a significant change with time (p=0.0150), no effect of treatment (p=0.4161) or interaction between time and treatment (p=0.5087). (C) MUNE demonstrated a significant reduction with time (p<0.0001) but no change with treatment (p=0.2062) or interaction with treatment over time (p=0.6018). (D) The CMAP amplitude when normalized to the weight of the gastrocnemius and soleus muscle demonstrated no significant differences between the vehicle and AAV9-FST treated groups (AAV9-FST n=15, vehicle n=12, p=0.4040). Mixed effect model was used to analyze longitudinal CMAP, SMUP, and MUNE. Unpaired t-test was used to analyze the CMAP data normalized to muscle weights. Data shown as mean ± standard deviation. Longitudinal studies: [n=17 mice (11 males, 6 females) per group.] * p<0.05
Figure 6.
Figure 6.. Neuromuscular junction transmission fidelity was improved with follistatin overexpression.
(A) Jitter was reduced in 27-months-old treated with AAV9-FST injection (median: 10 μs [95% CI: 12.30, 17.93] and mean: 15.12±17.14.96μs) compared with vehicle treated mice (median: 16.5 μs, [95% CI: 22.17, 31.25] and mean: 26.71 ± 24.01μs) (p<0.0001). (B) Blocking frequency was significantly reduced in the AAV9-FST injected cohort of mice (4%, 6 of 146 synapses, n=15 mice, 9 males, 6 females) as compared with vehicle treated mice (25%, 28 of 110 synapses, n=13 mice, 10 males, 3 females) (p<0.0001). Mann Whitney test was used to compare groups for jitter due to non-normal distribution. Fisher’s Exact test was used to compare frequency of blocking between group. Jitter data shown as median ± 95% confidence interval (CI). **** p<0.0001
Figure 7.
Figure 7.. NMJ morphology was improved following follistatin overexpression.
Immunohistochemistry of longitudinal sections of gastrocnemius muscle was performed to investigate NMJ morphology following follistatin overexpression. (A, B) Representative NMJ staining images of Vehicle and AAV9-FST groups of mice respectively. P represents partially innervation junctions, while F indicates fully innervated junctions. (C) Quantification of innervation status of junctions revealed that the AAV9-FST group had significantly higher number of fully innervated NMJs (p=0.0381). (D) There was no significant change in the fragmentation status of the NMJs upon injection of AAV9-FST, as compared to the vehicle injected group (p=0.0848). Fisher’s exact test was used to compare the categories of fully innervated versus not fully innervated and fragmented versus non-fragmented between the two groups of mice. (Neurofilament and synapsin = red, bungarotoxin = green, n=3 males per group) * p<0.05

Similar articles

Cited by

References

    1. Al-Zaidy SA, Sahenk Z, Rodino-Klapac LR, Kaspar B, Mendell JR, 2015. Follistatin Gene Therapy Improves Ambulation in Becker Muscular Dystrophy. Journal of Neuromuscular Diseases 2, 185–192. - PMC - PubMed
    1. Amthor H, Macharia R, Navarrete R, Schuelke M, Brown SC, Otto A, Voit T, Muntoni F, Vrbóva G, Partridge T, Zammit P, Bunger L, Patel K, 2007. Lack of myostatin results in excessive muscle growth but impaired force generation. Proceedings of the National Academy of Sciences 104(6), 1835–1840. - PMC - PubMed
    1. Arnold WD, Sheth KA, Wier CG, Kissel JT, Burghes AH, Kolb SJ, 2015. Electrophysiological Motor Unit Number Estimation (MUNE) Measuring Compound Muscle Action Potential (CMAP) in Mouse Hindlimb Muscles. Journal of visualized experiments : JoVE(103). - PMC - PubMed
    1. Augustin H, McGourty K, Steinert JR, Cochemé HM, Adcott J, Cabecinha M, Vincent A, Halff EF, Kittler JT, Boucrot E, Partridge L, 2017. Myostatin-like proteins regulate synaptic function and neuronal morphology. Development 144(13), 2445–2455. - PMC - PubMed
    1. Balice-Gordon R, Lichtman J, 1990. In vivo visualization of the growth of pre- and postsynaptic elements of neuromuscular junctions in the mouse. The Journal of Neuroscience 10(3), 894–908. - PMC - PubMed

Publication types

MeSH terms