5 ns electric pulses induce Ca2+-dependent exocytotic release of catecholamine from adrenal chromaffin cells
- PMID: 33965669
- PMCID: PMC8187336
- DOI: 10.1016/j.bioelechem.2021.107830
5 ns electric pulses induce Ca2+-dependent exocytotic release of catecholamine from adrenal chromaffin cells
Abstract
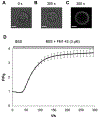
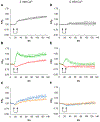
Previously we reported that adrenal chromaffin cells exposed to a 5 ns, 5 MV/m pulse release the catecholamines norepinephrine (NE) and epinephrine (EPI) in a Ca2+-dependent manner. Here we determined that NE and EPI release increased with pulse number (one versus five and ten pulses at 1 Hz), established that release occurs by exocytosis, and characterized the exocytotic response in real-time. Evidence of an exocytotic mechanism was the appearance of dopamine-β-hydroxylase on the plasma membrane, and the demonstration by total internal reflection fluorescence microscopy studies that a train of five or ten pulses at 1 Hz triggered the release of the fluorescent dye acridine orange from secretory granules. Release events were Ca2+-dependent, longer-lived relative to those evoked by nicotinic receptor stimulation, and occurred with a delay of several seconds despite an immediate rise in Ca2+. In complementary studies, cells labeled with the plasma membrane fluorescent dye FM 1-43 and exposed to a train of ten pulses at 1 Hz underwent Ca2+-dependent increases in FM 1-43 fluorescence indicative of granule fusion with the plasma membrane due to exocytosis. These results demonstrate the effectiveness of ultrashort electric pulses for stimulating catecholamine release, signifying their promise as a novel electrostimulation modality for neurosecretion.
Keywords: Acridine orange; Catecholamine release; Dopamine-β-hydroxylase; FM 1-43; Fluorescence imaging; Total internal reflection fluorescence microscopy.
Copyright © 2021 Elsevier B.V. All rights reserved.
Conflict of interest statement
Declaration of Competing Interest The authors declare that they have no known competing financial interests or personal relationships that could have appeared to influence the work reported in this paper.
Figures


Similar articles
-
Gap junctions mediate electrical signaling and ensuing cytosolic Ca2+ increases between chromaffin cells in adrenal slices: A role in catecholamine release.J Neurosci. 2001 Aug 1;21(15):5397-405. doi: 10.1523/JNEUROSCI.21-15-05397.2001. J Neurosci. 2001. PMID: 11466411 Free PMC article.
-
Therapeutic concentrations of varenicline increases exocytotic release of catecholamines from human and rat adrenal chromaffin cells in the presence of nicotine.Neuropharmacology. 2021 Sep 1;195:108632. doi: 10.1016/j.neuropharm.2021.108632. Epub 2021 Jun 4. Neuropharmacology. 2021. PMID: 34097947
-
Extracellular Ca²⁺ per se inhibits quantal size of catecholamine release in adrenal slice chromaffin cells.Cell Calcium. 2014 Sep;56(3):202-7. doi: 10.1016/j.ceca.2014.07.006. Epub 2014 Jul 22. Cell Calcium. 2014. PMID: 25103334
-
Dynamin and myosin regulate differential exocytosis from mouse adrenal chromaffin cells.Cell Mol Neurobiol. 2010 Nov;30(8):1351-7. doi: 10.1007/s10571-010-9591-z. Cell Mol Neurobiol. 2010. PMID: 21061163 Free PMC article. Review.
-
GPCRs of adrenal chromaffin cells & catecholamines: The plot thickens.Int J Biochem Cell Biol. 2016 Aug;77(Pt B):213-9. doi: 10.1016/j.biocel.2016.02.003. Epub 2016 Feb 3. Int J Biochem Cell Biol. 2016. PMID: 26851510 Review.
Cited by
-
Dynamics of cell membrane lesions and adaptive conductance under the electrical stress.Cell Stress. 2024 Aug 9;8:69-82. doi: 10.15698/cst2024.08.298. eCollection 2024. Cell Stress. 2024. PMID: 39135750 Free PMC article.
-
High signal-to-noise imaging of spontaneous and 5 ns electric pulse-evoked Ca2+ signals in GCaMP6f-expressing adrenal chromaffin cells isolated from transgenic mice.PLoS One. 2023 Mar 31;18(3):e0283736. doi: 10.1371/journal.pone.0283736. eCollection 2023. PLoS One. 2023. PMID: 37000822 Free PMC article.
-
Effects of Nanosecond Pulsed Electric Field (nsPEF) on a Multicellular Spheroid Tumor Model: Influence of Pulse Duration, Pulse Repetition Rate, Absorbed Energy, and Temperature.Int J Mol Sci. 2023 Oct 8;24(19):14999. doi: 10.3390/ijms241914999. Int J Mol Sci. 2023. PMID: 37834447 Free PMC article.
-
Modulating Ca2+ influx into adrenal chromaffin cells with short-duration nanosecond electric pulses.Biophys J. 2024 Aug 20;123(16):2537-2556. doi: 10.1016/j.bpj.2024.06.021. Epub 2024 Jun 21. Biophys J. 2024. PMID: 38909279 Free PMC article.
-
Human toxicity of polybrominated diphenyl ethers (PBDEs) and their derivatives: A comprehensive review.Curr Res Food Sci. 2024 Nov 8;9:100918. doi: 10.1016/j.crfs.2024.100918. eCollection 2024. Curr Res Food Sci. 2024. PMID: 39619643 Free PMC article. Review.
References
-
- Jaberzadeh S, Bastani A, Zoghi M, 2014. Anodal transcranial pulsed current stimulation: A novel technique to enhance corticospinal excitability. Clin. Neurophysiol 125:344–351. - PubMed
MeSH terms
Substances
Grants and funding
LinkOut - more resources
Full Text Sources
Other Literature Sources
Miscellaneous

