. 2021 May 8;12(5):464.
doi: 10.1038/s41419-021-03730-8.

CXCR4 intracellular protein promotes drug resistance and tumorigenic potential by inversely regulating the expression of Death Receptor 5

Affiliations

CXCR4 intracellular protein promotes drug resistance and tumorigenic potential by inversely regulating the expression of Death Receptor 5

Mushtaq A Nengroo et al. Cell Death Dis. .

Abstract

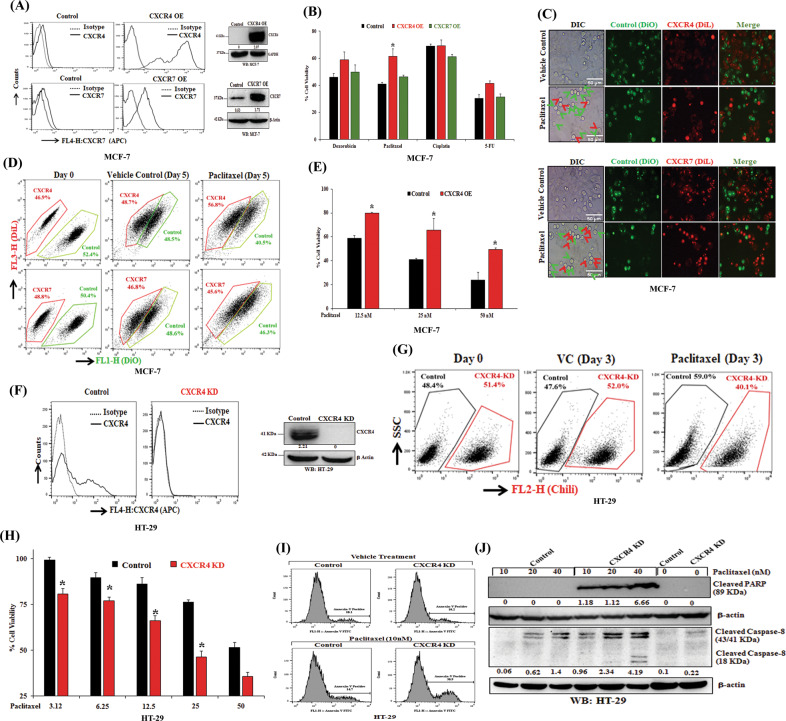
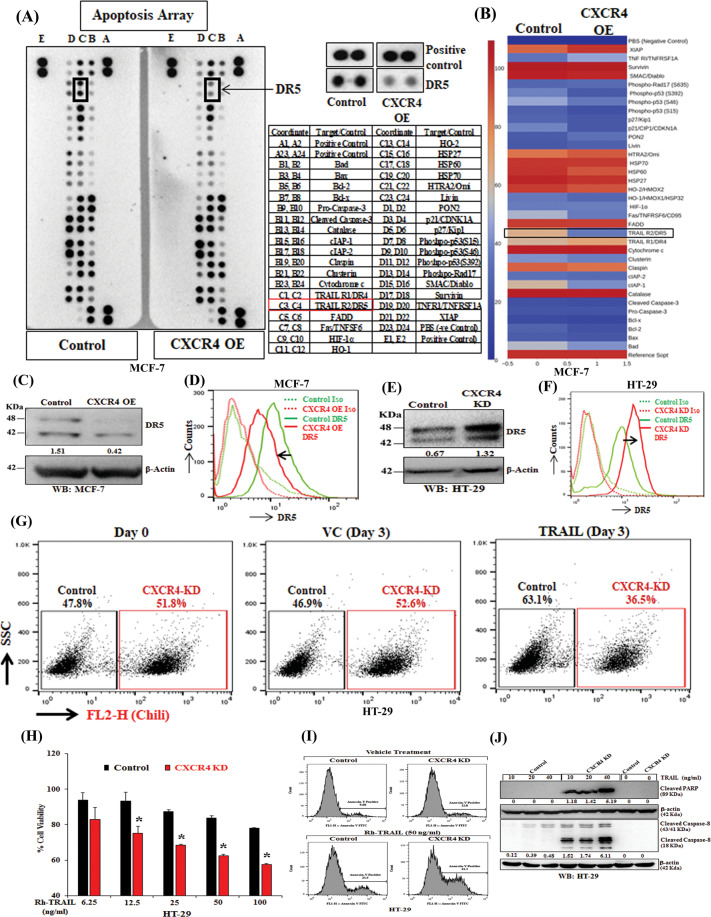
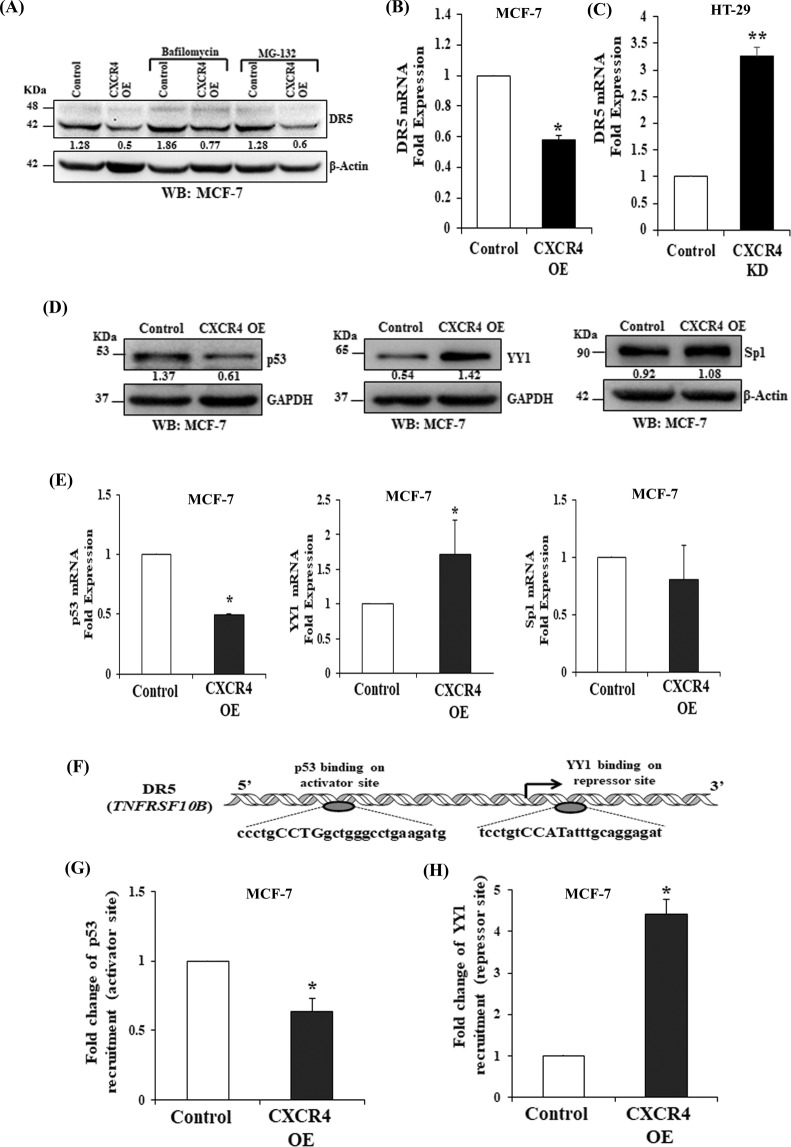
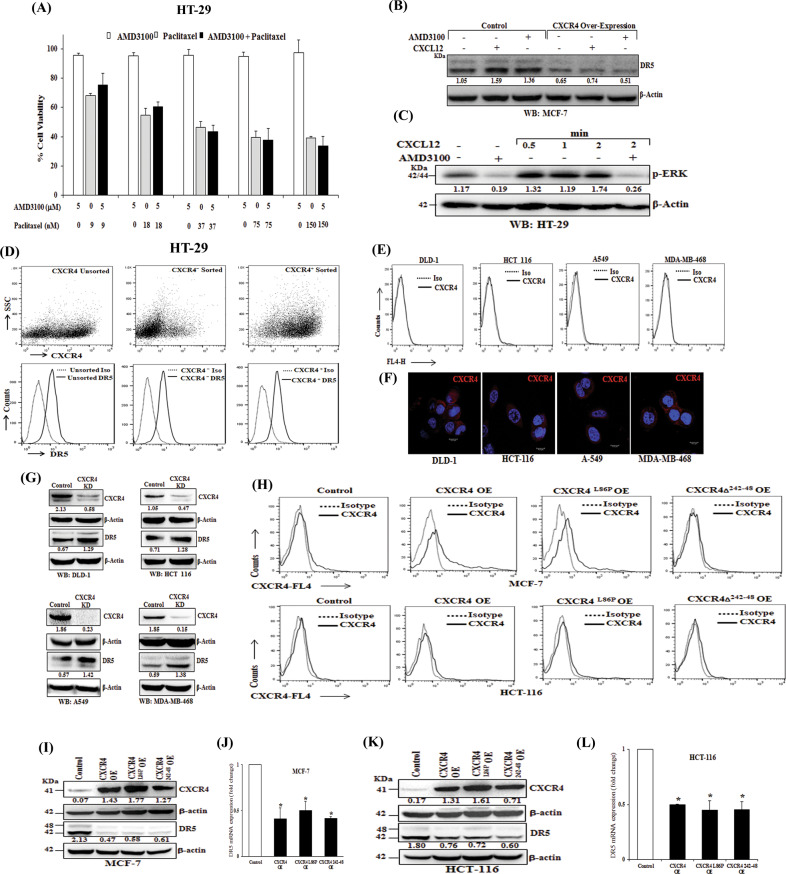
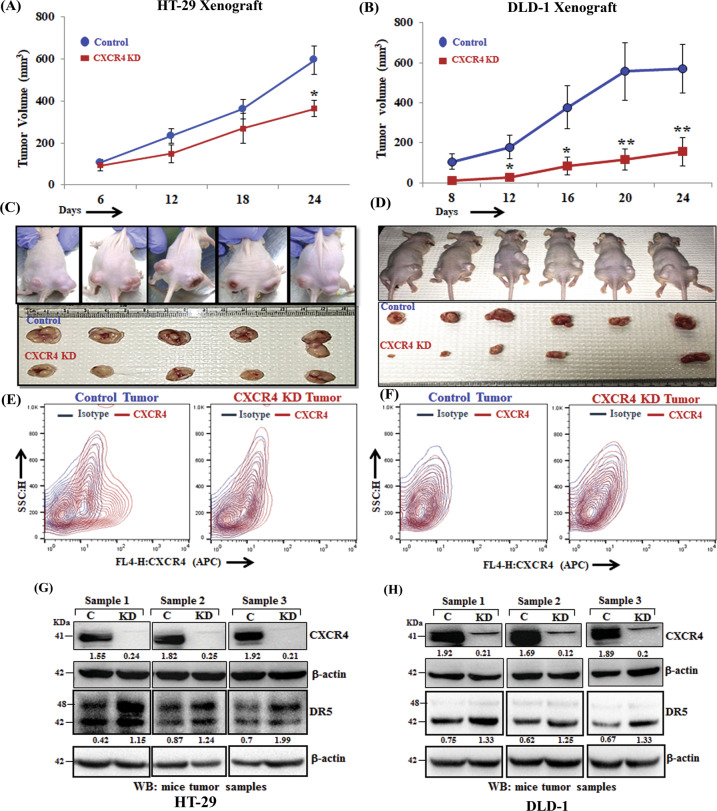
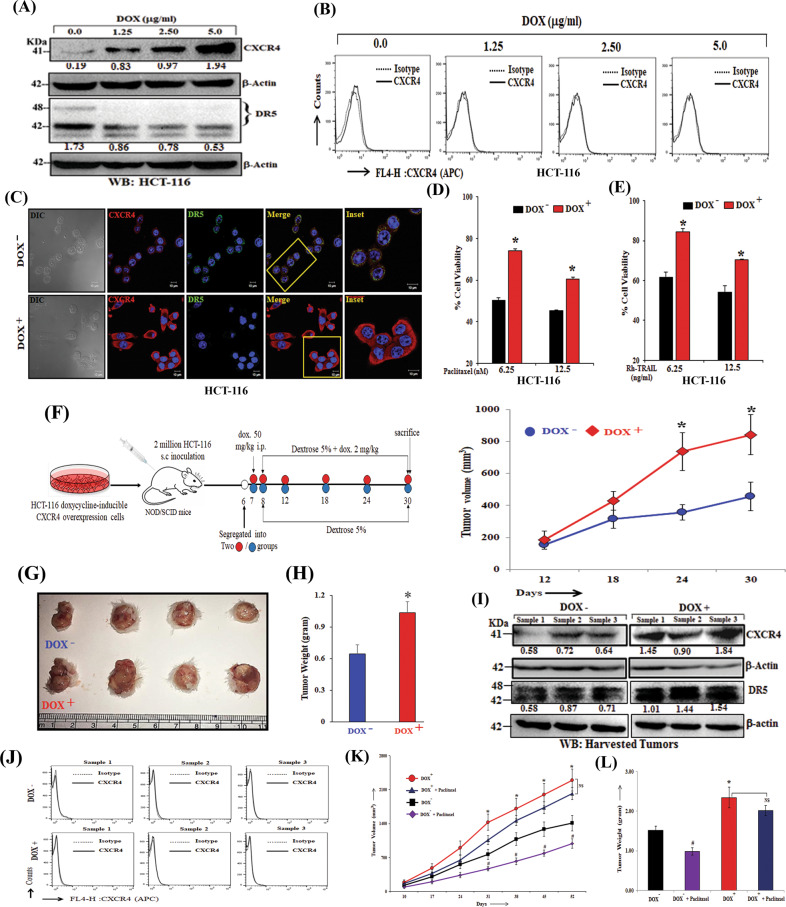
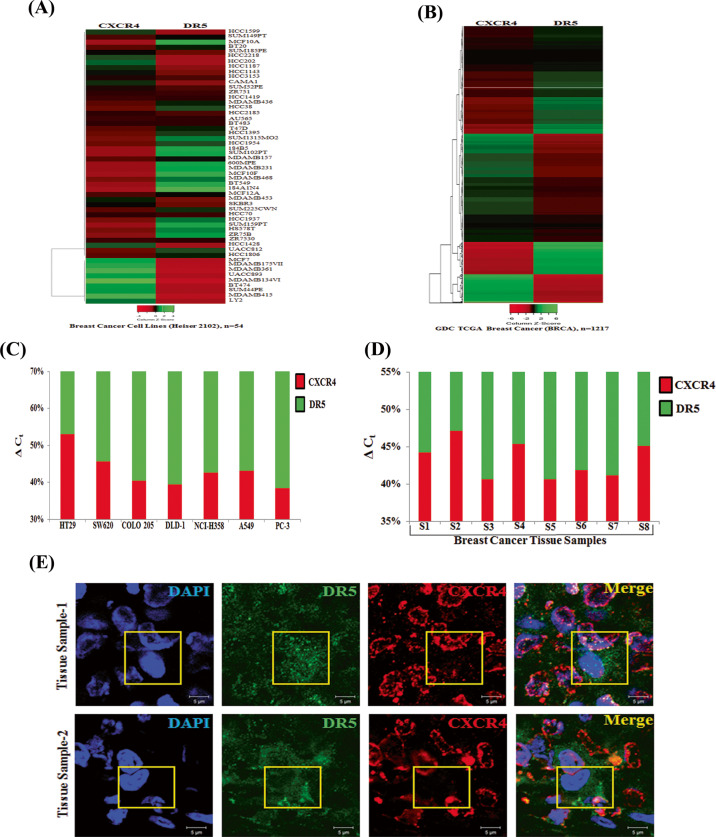
Chemokine receptor CXCR4 overexpression in solid tumors has been strongly associated with poor prognosis and adverse clinical outcome. However, blockade of CXCL12-CXCR4 signaling axis by inhibitors like Nox-A12, FDA approved CXCR4 inhibitor drug AMD3100 have shown limited clinical success in cancer treatment. Therefore, exclusive contribution of CXCR4-CXCL12 signaling in pro-tumorigenic function is questionable. In our pursuit to understand the impact of chemokine signaling in carcinogenesis, we reveal that instead of CXCR4-CXCL12 signaling, presence of CXCR4 intracellular protein augments paclitaxel resistance and pro-tumorigenic functions. In search of pro-apoptotic mechanisms for CXCR4 mediated drug resistance; we discover that DR5 is a new selective target of CXCR4 in breast and colon cancer. Further, we detect that CXCR4 directs the differential recruitment of transcription factors p53 and YY1 to the promoter of DR5 in course of its transcriptional repression. Remarkably, inhibiting CXCR4-ligand-mediated signals completely fails to block the above phenotype. Overexpression of different mutant versions of CXCR4 lacking signal transduction capabilities also result in marked downregulation of DR5 expression in colon cancer indeed confirms the reverse relationship between DR5 and intracellular CXCR4 protein expression. Irrespective of CXCR4 surface expression, by utilizing stable gain and loss of function approaches, we observe that intracellular CXCR4 protein selectively resists and sensitizes colon cancer cells against paclitaxel therapy in vitro and in vivo. Finally, performing TCGA data mining and using human breast cancer patient samples, we demonstrate that expression of CXCR4 and DR5 are inversely regulated. Together, our data suggest that targeting CXCR4 intracellular protein may be critical to dampen the pro-tumorigenic functions of CXCR4.


Conflict of interest statement

The authors declare no competing interests.

Figures

Fig. 1
Fig. 1. CXCR4 regulates paclitaxel resistance in cancer.
A MCF7 cells were transfected with either empty vector pcDNA3.1 or vector containing the gene for the overexpression of either chemokine receptor CXCR4 or CXCR7 and made stable. These stable cell lines were stained with either APC-conjugated anti-human CXCR4 (CD184) or anti-human CXCR7 antibodies along with their respective isotype control antibodies and analyzed by flow cytometry. The surface expression levels of CXCR4 and CXCR7 are represented in histogram overlays (left panel). Western blot analysis of CXCR4 and CXCR7 in the lysate of control and CXCR4/CXCR7 overexpression MCF-7 cells; GAPDH and β-Actin were used as the protein loading control (right panel). B CXCR4 or CXCR7 overexpressing and control MCF7 cells were treated with Doxorubicin (250 nmol/L), Paclitaxel (25 nmol/L), Cisplatin (2.5 μmol/L), or 5-Fluorouracil (25 μmol/L) for 72 h and cytotoxicity was measured by SRB assay as described in materials and methods. Percent cell viability was tabulated. Columns, an average of triplicate readings of samples; error bars ± SEM. *p < 0.05, compared with control cells. C DiL (red) stained CXCR4 or CXCR7 overexpressing MCF7 cells and DiO (green) stained control MCF7 cells were mixed in equal numbers, seeded in 6-well plate and treated with vehicle or Paclitaxel (10 nmol/L) for 3 days and then analyzed via fluorescence microscopy; red arrows indicate DiL stained dead CXCR4 or CXCR7 overexpressing cells, while green arrows indicate DiO stained dead control cells. Photomicrographs are representative of three independent experiments. D DiL stained CXCR4 overexpressing or CXCR7 overexpressing MCF7 cells were equally mixed with DiO stained control MCF7 cells, and a small aliquot of mixture was acquired as day 0 reading by FACS. The rest of the cells were treated either with vehicle or Paclitaxel (10 nmol/L) for 5 days and subsequently analyzed by FACS. Data are representative of at least three independent experiments. E CXCR4 overexpressing and control MCF7 cells were treated with different concentrations of paclitaxel (12.5, 25, 50 nM) for 48 h, and cytotoxicity was evaluated by SRB assay. Percent cell viability was tabulated. Columns, an average of triplicate readings of samples; error bars ± SEM.*p < 0.05, compared to control cells treated with respective doses of paclitaxel. F Chili tagged HT-29 cells were made stable for the knockdown of CXCR4 via shRNA mediated lentiviral transduction; scramble shRNA transduced stable HT-29 cells were used as control. CXCR4 knockdown and control HT-29 cells were stained either with APC-conjugated anti-human CXCR4 (CD184) antibody or with appropriate isotype control antibody and analyzed by FACS. Histogram overlays represent the cell surface expression of CXCR4 (left panel). Western blot analysis of CXCR4 in the lysate of control and CXCR4 knockdown HT29 cells; β-Actin was used as the protein loading control (right panel). G Control and CXCR4 knockdown Chili tagged HT29 cells were mixed equally and analyzed by FACS either at day 0 or after three days of vehicle/paclitaxel (20 nmol/L) treatments. H CXCR4 knockdown and control HT-29 cells were treated with different concentrations of Paclitaxel (3.12, 6.25, 12.5, 25, 50 nM) for 48 h and cytotoxicity was measured by SRB assay. Percent cell viability was tabulated. Columns, an average of triplicate readings of samples; error bars ± SEM.*p < 0.05 compared to control cells. I Control and CXCR4 knockdown HT29 cells were treated with paclitaxel for 24 h and stained with FITC conjugated Annexin-V. Histogram overlays show the Annexin-V positive cells. J Western blot analysis of cleaved PARP and Caspase-8 in the lysate of 24 h post vehicle or Paclitaxel treated (10, 20, and 40 nM) control and CXCR4 knockdown HT-29 cells; β-Actin was used as the protein loading control. Western Blot densitometric quantification numbers are shown above the loading control blot of all immunoblot studies.
Fig. 2
Fig. 2. CXCR4 inversely regulates the expression and function of DR5.
CXCR4 overexpressing or control stable MCF7 cells were harvested for protein extraction and analyzed for the expression of apoptotic genes by utilizing proteome profiler apoptosis array of individual western blot analysis. A Chemiluminescent image of the expression of 35 apoptosis-related genes with positive and negative controls in duplicates for control and CXCR4 overexpressed cells was shown (left panel). The enlarged images of selected apoptotic protein (DR5) found to be markedly altered in the proteome profiler array (middle-upper) and spot coordinates (middle-lower) were shown. B Heatmaps depicting differentially regulated proteins in CXCR4 overexpressing and control stable MCF7 cells. C Immunoblot analysis of DR5 protein in CXCR4 overexpressing or control MCF7 cells; β-Actin was used as an internal protein loading control. D CXCR4 overexpression and control MCF7 cells were either stained with PE-conjugated anti-human DR5 or PE tagged isotype (IgG) control antibodies, and cell surface expression of DR5 was analyzed by histogram overlays using FACS. E Immunoblot analysis of DR5 protein in CXCR4 knockdown or control HT-29 cells; β-Actin was used as an internal protein loading control. F CXCR4 knockdown and control HT-29 stable cells were stained either with PE-conjugated anti-human DR5 or PE tagged isotype control antibodies. Cell surface expression of CXCR4 was analyzed by histogram overlays using FACS. G Chili tagged CXCR4 knockdown and control HT-29 stable cells were mixed equally and subjected to FACS analysis at Day 0 and 3 days after recombinant human TRAIL (50 ng/mL) treatment. H CXCR4 knockdown and control stable cells were treated with different concentrations of TRAIL (6.25, 12.5, 25, 50, 100 ng/mL) for 48 h, and cytotoxicity was measured by SRB assay. Percent cell viability was tabulated. Columns, an average of triplicate readings of samples; error bars ± S.D. **p < 0.01; #, p < 0.05, compared to TRAIL-treated control cells. I Control and CXCR4 knockdown HT29 cells were treated with Rh-TRAIL for 24 h and stained with FITC conjugated Annexin-V. Histogram overlays show the Annexin-V positive cells. J Immunoblot analysis of cleaved PARP and Caspase-8 in 24 h post vehicle or TRAIL-treated (10, 20, and 40 ng/mL) control and CXCR4 knockdown HT-29 cell lysates; β-Actin was used as the protein loading control. Western Blot densitometric quantification numbers are shown above the loading control blot of all immunoblot studies.
Fig. 3
Fig. 3. CXCR4 regulates DR5 transcription by differentially modulating the recruitment of transcription factors p53 and YY1 at the promoter site of DR5.
A Western blot analysis of DR5 in control and CXCR4 overexpressing MCF-7 cells after bafilomycin or MG132 treatment for 5 h; β-actin was used as the protein loading control. B, C Total RNA was isolated from CXCR4 overexpressing (MCF-7) and knockdown (HT-29) stable cells along with their respective controls and reverse transcribed. Fold change in DR5 mRNA expression was measured by RT-qPCR as described in Materials and Methods. Data are representative of three independent experiments, resulting from duplicate readings of two different samples; Columns, average value of DR5 mRNA expression; bars ± SEM. *, p < 0.05, compared with respective controls. D Western blot analysis of p53, YY1, and Sp1 in control and CXCR4 overexpressing MCF-7 cells; GAPDH or β-actin was used as the protein loading control. Western Blot densitometric quantification numbers are shown above the loading control blot of all immunoblot studies. E Fold change in mRNA expression of p53, YY1, and Sp1 in control and CXCR4 overexpressing stable MCF-7 cells was assessed by RT-qPCR; Columns, average value of p53/yy1/sp1 mRNA expression; bars ± SEM. *, p < 0.05, compared with respective control. F Diagrammatic representation for the p53 binding on activator site as well as YY1 binding on repressor site of the DR5 gene promoter region. G, H ChIP assay for the analysis of YY1 and p53 recruitment on the DR5 gene promoter in CXCR4 overexpressing and control stable MCF7 cells followed by RT-qPCR. Fold change in p53 and YY1 recruitment on the respective activator and repressor sites of the DR5 gene promoter were assessed in control and CXCR4 overexpressing MCF-7 cells. Results are representative of at least two independent experiments; Columns, an average of duplicate readings of samples; error bars ± S.D. *p < 0.05 versus control MCF7 cells.
Fig. 4
Fig. 4. CXCR4 mediated DR5 regulation is independent of CXCR4-CXCL12 signaling.
A HT-29 cells were treated with either different concentrations of paclitaxel (9, 18, 37, 75, 150 nM) or AMD3100 (5 μM) alone or in combinations for 48 h and cytotoxicity was measured by SRB assay. Percent cell viability was tabulated. Columns, an average of triplicate readings of samples; error bars ± SEM. B Control and CXCR4 overexpressed MCF-7 cells were treated with CXCR4 ligand CXCL12 (100 ng/ml) or CXCR4 antagonist AMD3100 (5 μmol/L) for 12 h, and subjected to Western blot analysis for DR5 and β-actin. C HT-29 cells were either pre-treated with vehicle or AMD3100 (5 μM) for 12 h, followed by treatment with CXCR4 ligand CXCL12 (100 ng/ml) for different time points (0.5, 1, and 2 mins) and subjected to Western blot analysis for p-ERK and β-actin. D CXCR4+ and CXCR4 HT-29 cells were flow-sorted and plated. After 5 days of culture, cells were stained with either APC-conjugated CXCR4 (CD184) and PE-conjugated DR5 or their respective matched isotype control antibodies and analyzed by FACS. In the upper panel, dot plots represent CXCR4 staining in unsorted, CXCR4+sorted and, CXCR4 sorted cells. In the lower panel histograms represent DR5 staining in the above-mentioned respective cells. E DLD-1, HCT-116, A-549, and MDA-MB-468 cells were stained with either APC-conjugated anti-human CXCR4 (CD184) or isotype control antibodies and analyzed by FACS. The cell surface expression of CXCR4 is represented in histogram overlays. F DLD-1, HCT-116, A-549, and MDA-MB-468 cells were seeded on coverslips for 24 h and subjected to immunofluorescence staining for CXCR4 and analyzed by confocal microscopy; Scale bar 10 μm. G DLD-1, HCT-116, A-549, and MDA-MB-468 cells were made stable for CXCR4 knockdown via shRNA mediated lentiviral transduction and scramble shRNA transduced cells were used as control. Immunoblot analysis of CXCR4 and DR5 protein in control or CXCR4 knockdown cells are shown; β-Actin was used as an internal protein loading control. HL MCF-7 and HCT-116 cells were transfected with scrambled, wild type CXCR4, CXCR4L86P, or CXCR4δ242-248 containing vectors and cultured. After 48 h, cells were either stained with APC-conjugated anti-human CXCR4 (CD184)/isotype control antibodies and analyzed by FACS, or subjected to western blot or total RNA isolation. H The cell surface expression of CXCR4 is represented in histogram overlays. I, K Immunoblot analysis of CXCR4 and DR5 protein in control, wild type CXCR4, CXCR4L86P, or CXCR4δ242-248 transfected MCF-7 and HCT-116 cells; β-Actin was used as an internal protein loading control. Western Blot densitometric quantification numbers are shown above the loading control blot of all immunoblot studies. J, L Fold change in DR5 mRNA expression was measured by RT-qPCR as described in Materials and Methods. Data are representative of three independent experiments, resulting from duplicate readings of two different samples; Columns, average value of DR5 mRNA expression; bars ± SEM. *, p < 0.05, compared with respective controls.
Fig. 5
Fig. 5. CXCR4 protein knockdown results in compromised tumor growth and DR5 overexpression in vivo.
In total, 2 × 106 stable control (HT-29 and DLD-1) or CXCR4 knockdown (HT-29 and DLD-1) cells in 100μl PBS were injected subcutaneously in the flanks of the right or left hind leg of 4–6 weeks old Crl: CD1-Foxn1nu mice respectively. Tumor volumes were measured after regular intervals by using a caliper. Growth curves for HT-29 (A) and DLD-1 (B) are shown for tumors generated from control and CXCR4 knockdown cells; points are indicative of the average value of tumor volume ± SE (n = 5 for HT-29, n = 6 for DLD-1); *p < 0.05 compared to control tumors. C, D Upper panels represent images of tumor-bearing mice, control (right flank), and CXCR4 knockdown (left flank). Mice were sacrificed, and the respective tumors from HT29 (C) and DLD-1 (D) were harvested and shown in photographs in lower panels. Single cells from respective control and CXCR4 knockdown HT-29 (E) and DLD-1 (F) were harvested and stained with either APC-conjugated anti-human CXCR4 (CD184) or isotype control antibodies, and contour FACS plots analyzed cell surface expression of CXCR4. Harvested tumors generated from control and CXCR4 knockdown cells HT-29 (G) and DLD-1 (H) were subjected to Western blot analysis for CXCR4 and DR5. β-actin was used as protein loading control. Western Blot densitometric quantification numbers are shown above the loading control blot of all immunoblot studies.
Fig. 6
Fig. 6. Intra-cellular CXCR4 overexpression promotes tumorigenesis and paclitaxel resistance in vitro and in vivo.
A Western blot analysis of CXCR4 and DR5 in doxycycline-inducible CXCR4 overexpression HCT-116 cells after treatment with different concentrations of doxycycline (1.25 μg/ml, 2.50 μg/ml, 5 μg/ml) for 48 h. β-Actin was used as an internal protein loading control. B Doxycycline inducible CXCR4 overexpression HCT-116 cells were cultured under different concentrations of doxycycline (1.25 μg/ml, 2.5 μg/ml, 5 μg/ml) for 48 h. The cells were stained with APC-conjugated anti-human CXCR4 (CD184) antibody, and APC tagged IgG was used as isotype. The cells were analyzed by flow cytometry. Histogram overlays represent the surface expression level of CXCR4. C Doxycycline inducible CXCR4 overexpression HCT-116 cells were seeded on coverslips, treated with doxycycline (2μg/ml) for 48 h, subjected to immunofluorescence staining for CXCR4 as well as DR5 and analyzed by confocal microscopy. Inset photomicrographs represent the magnified area of the box. Scale bar, 10 µm. D Doxycycline inducible CXCR4 overexpression HCT-116 cells were treated with doxycycline (2 µg/ml) and Paclitaxel (6.25 nM, 12.5 nM) for 48 h and cytotoxicity was measured by SRB assay. Percent cell viability was tabulated. Columns, an average of triplicate readings of samples; error bars ± SEM. *p < 0.05 compared to uninduced cells. E Doxycycline inducible CXCR4 overexpression HCT-116 cells were treated with doxycycline (2 µg/ml) and TRAIL (6.25, 12.5 ng/ml) for 48 h and cytotoxicity was measured by SRB assay. Percent cell viability was tabulated. Columns, an average of triplicate readings of samples; error bars ± SEM. *p < 0.05 compared to un-induced cells. FG, H In total, 2 × 106 Doxycycline inducible CXCR4 overexpression HCT-116 cells in 100 μl PBS were injected subcutaneously in the right flank of 4–6 weeks old NOD/SCID mice respectively. Mice were fed with doxycycline (2 mg/ml, 5% dextrose in water). Tumor volumes were measured after regular intervals by using a digital caliper. Diagrammatic representation of experimental plan (F, left panel), tumor growth curve (F, right panel), harvested tumor pictures (G) and tumor weight bar graph (H) are shown. Results are reported as the mean ± SE. *p < 0.05 compared to vehicle-fed mice. I Western blot analysis of CXCR4 and DR5 in tumors harvested from the Dox- and Dox+ mice. β-Actin was used as an internal protein loading control. Western Blot densitometric quantification numbers are shown above the loading control blot of all immunoblot studies. J Single cells were isolated from the Dox+ and Dox harvested tumors. The cells were either stained with APC-conjugated anti-human CXCR4 (CD184) antibody and PE-conjugated EpCAM (CD326) antibody or respective isotype control antibodies. The cells were analyzed by flow cytometry. Histogram overlays represent the surface expression level of CXCR4 in EpCAM positive HCT116 cell population. K, L In total, 5 × 106 Doxycycline inducible CXCR4 overexpression HCT-116 cells in 100 μl PBS were injected subcutaneously in the flanks of the right or left hind leg of 4–6 weeks old NOD/SCID mice respectively. Mice were fed either with vehicle (5% dextrose in water) or doxycycline (2 mg/ml, 5% dextrose in water). Paclitaxel (5 mg/kg) was administered per week for 7 weeks. The tumor growth curve (K) and tumor weight (L) are shown, where points are indicative of the average value of tumor (n = 7) volume; mean ± SE. *p < 0.05 compared to vehicle-fed mice. #p < 0.05 compared to vehicle-fed mice.
Fig. 7
Fig. 7. Expression of CXCR4 inversely correlates with DR5 expression in cancer cell lines, human breast cancer patient cohort and human breast cancer tissue samples.
Heat maps are displaying CXCR4 and DR5 expression in (A) breast cancer cell lines (n = 54) and in (B) GDC TCGA Breast Cancer (BRCA) patient cohort (n = 1217). Shades of red and green represent expression values in fold change. Total RNA was isolated from various cancer cell lines (C) and breast cancer patient tumor tissue samples (D), reverse transcribed, and RT-qPCR was performed for CXCR4 and DR5 expression analysis. 18 s is used as an internal control. Percentage delta Ct was determined for each sample from quadruplicate Ct value and represented in bar graph having the differential contribution of CXCR4 (red) and DR5 (green) expression. E Human formalin-fixed paraffin-embedded mammary tumor tissues were subjected to immunofluorescence staining of CXCR4 (red) and DR5 (green) proteins and analyzed by confocal microscopy. Scale bar, 5 μm sections were viewed at 63X magnification. Yellow boxed merged confocal photomicrograph area represents cell positive for DR5 (green) staining having minimal CXCR4 (red) staining.

Similar articles

Cited by

References

    1. Bray F, et al. Global cancer statistics 2018: GLOBOCAN estimates of incidence and mortality worldwide for 36 cancers in 185 countries. CA: a cancer J. clinicians. 2018;68:394–424. - PubMed
    1. Fulda S. Tumor resistance to apoptosis. Int. J. cancer. 2009;124:511–515. doi: 10.1002/ijc.24064. - DOI - PubMed
    1. Fernald K, Kurokawa M. Evading apoptosis in cancer. Trends cell Biol. 2013;23:620–633. doi: 10.1016/j.tcb.2013.07.006. - DOI - PMC - PubMed
    1. Hanahan D., Weinberg R. A. Hallmarks of cancer: the next generation. Cell 144, 646–674 (2011). - PubMed
    1. Hata AN, Engelman JA, Faber AC. The BCL2 family: key mediators of the apoptotic response to targeted anticancer therapeutics. Cancer Disco. 2015;5:475–487. doi: 10.1158/2159-8290.CD-15-0011. - DOI - PMC - PubMed

Publication types

MeSH terms

Substances