A logistic regression model for prediction of glioma grading based on radiomics
- PMID: 33967085
- PMCID: PMC10930312
- DOI: 10.11817/j.issn.1672-7347.2021.200074
A logistic regression model for prediction of glioma grading based on radiomics
Abstract
Objectives: Glioma is the most common intracranial primary tumor in central nervous system. Glioma grading possesses important guiding significance for the selection of clinical treatment and follow-up plan, and the assessment of prognosis. This study aims to explore the feasibility of logistic regression model based on radiomics to predict glioma grading.
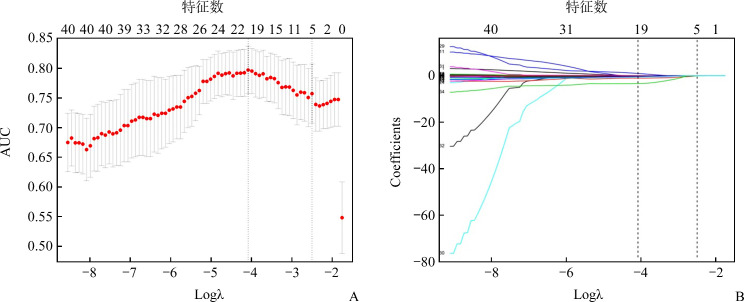
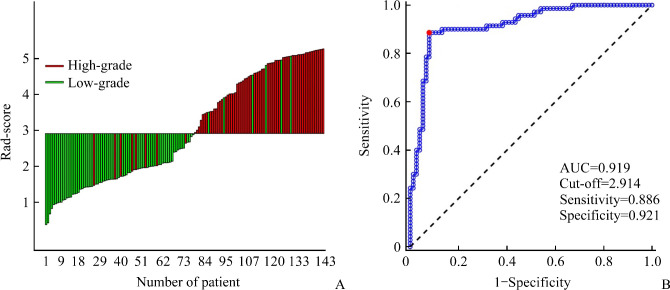
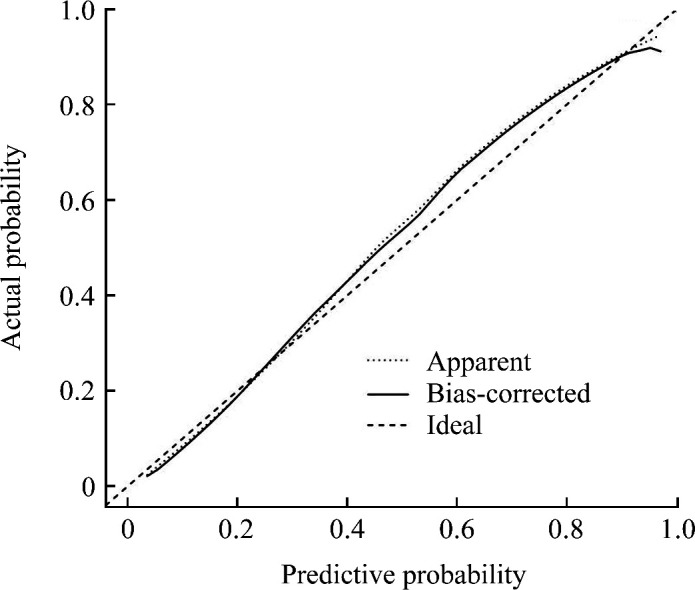
Methods: Retrospective analysis was performed on 146 glioma patients with confirmed pathological diagnosis from January, 2012 to December, 2018. A total of 41 radiomics features were extracted from contrast-enhanced T1-weighted imaging (T1WI+C) lesion by manual segmentation. Least absolute shrinkage and selection operator (LASSO) was used to select the most-predictive radiomics features for pathological grading and to calculate radiomics score (Rad-score) of each patient. A logistic regression model was built to explore the correlation between giloma grading and Rad-score. Receiver operating characteristic (ROC) curve was performed to evaluate the model's predictive ability with area under the curve (AUC) for the evaluation index. Hosmer-Lemeshow test was used to measure the model's predictive accuracy.
Results: A total of 5 imaging features selected by LASSO were used to establish a logistic regression model for predicting glioma grading. The model showed good discrimination with AUC value of 0.919. Hosmer-Lemeshow test showed no significant difference between the calibration curve and the ideal curve (P=0.808), indicating high predictive accuracy of the model.
Conclusions: The logistic regression model using radiomics exhibits a relatively high accuracy for predicting glioma grading, which may serve as a complementary tool for preoperative prediction of giloma grading.
目的: 胶质瘤是最常见的颅内原发中枢神经系统肿瘤,胶质瘤的分级对临床治疗及随访方案的选择、预后的评估有重要指导意义。本研究目的在于探讨基于影像组学的logistic回归模型预测胶质瘤病理分级的可行性。方法: 回顾性收集2012年1月至2018年12月经手术病理切片证实为胶质瘤的146例患者。手动分割患者增强T1加权成像(contrast-enhanced T1-weighted imaging,T1WI+C)图像中的胶质瘤区域,形成3D感兴趣区(region of interest,ROI);提取41个影像特征;采用最小绝对收缩和选择运算(least absolute shrinkage and selection operator,LASSO)二元logistic回归法筛选与胶质瘤病理分级最相关的特征并计算影像组学得分(radiomics score,Rad-score);采用单因素logistic回归建模方法建立预测模型;用受试者操作特征(receiver operating characteristic,ROC)曲线评估模型的区分能力,评估指标为曲线下面积(area under the curve,AUC)。利用Hosmer-Lemeshow检验衡量模型预测的准确性。结果: 筛选出5个与胶质瘤病理分级最相关的特征,用这5个特征构建的预测胶质瘤病理分级的logistic回归模型的ROC曲线AUC为0.919,具有很好的区分能力,其校准曲线经Hosmer-Lemeshow检验,与理想曲线的差异无统计学意义(P=0.808),预测准确性高。结论: 基于影像组学的logistic回归模型可以有效地对胶质瘤病理分级进行预测,有望成为术前预测胶质瘤分级的辅助方法。.
Keywords: glioma; grading; least absolute shrinkage and selection operator; logistic regression; radiomics.
Conflict of interest statement
作者声称无任何利益冲突。
Figures
Similar articles
-
Glioma grading prediction using multiparametric magnetic resonance imaging-based radiomics combined with proton magnetic resonance spectroscopy and diffusion tensor imaging.Med Phys. 2022 Jul;49(7):4419-4429. doi: 10.1002/mp.15648. Epub 2022 Apr 18. Med Phys. 2022. PMID: 35366379
-
Radiomics Nomogram Building From Multiparametric MRI to Predict Grade in Patients With Glioma: A Cohort Study.J Magn Reson Imaging. 2019 Mar;49(3):825-833. doi: 10.1002/jmri.26265. Epub 2018 Sep 8. J Magn Reson Imaging. 2019. PMID: 30260592
-
Application of Enhanced T1WI of MRI Radiomics in Glioma Grading.Int J Clin Pract. 2022 May 13;2022:3252574. doi: 10.1155/2022/3252574. eCollection 2022. Int J Clin Pract. 2022. PMID: 35685548 Free PMC article. Clinical Trial.
-
Diffusion- and perfusion-weighted MRI radiomics model may predict isocitrate dehydrogenase (IDH) mutation and tumor aggressiveness in diffuse lower grade glioma.Eur Radiol. 2020 Apr;30(4):2142-2151. doi: 10.1007/s00330-019-06548-3. Epub 2019 Dec 11. Eur Radiol. 2020. PMID: 31828414
-
Radiomics in glioma: emerging trends and challenges.Ann Clin Transl Neurol. 2025 Mar;12(3):460-477. doi: 10.1002/acn3.52306. Epub 2025 Feb 3. Ann Clin Transl Neurol. 2025. PMID: 39901654 Free PMC article. Review.
Cited by
-
Brain Tumor Imaging: Applications of Artificial Intelligence.Semin Ultrasound CT MR. 2022 Apr;43(2):153-169. doi: 10.1053/j.sult.2022.02.005. Epub 2022 Feb 11. Semin Ultrasound CT MR. 2022. PMID: 35339256 Free PMC article.
-
Predictive model of systemic inflammatory response syndrome after percutaneous nephrolithotomy for kidney calculi based on logistic regression.Am J Transl Res. 2023 Jun 15;15(6):4138-4146. eCollection 2023. Am J Transl Res. 2023. PMID: 37434839 Free PMC article.
-
A Simple Logistic Regression Model for Predicting the Likelihood of Recurrence of Atrial Fibrillation Within 1 Year After Initial Radio-Frequency Catheter Ablation Therapy.Front Cardiovasc Med. 2022 Jan 27;8:819341. doi: 10.3389/fcvm.2021.819341. eCollection 2021. Front Cardiovasc Med. 2022. PMID: 35155619 Free PMC article.
References
-
- Louis DN, Perry A, Reifenberger G, et al. . The 2016 world health organization classification of tumors of the central nervous system: A summary[J]. Acta Neuropathol, 2016, 131(6): 803-820. - PubMed
-
- Tian Q, Yan LF, Zhang X, et al. . Radiomics strategy for glioma grading using texture features from multiparametric mri[J]. J Magn Reson Imaging, 2018, 48(6): 1518-1528. - PubMed
MeSH terms
Grants and funding
LinkOut - more resources
Full Text Sources
Medical