

Tuning parameter selection for a penalized estimator of species richness
- PMID: 33967371
- PMCID: PMC8098713
- DOI: 10.1080/02664763.2020.1754359
Tuning parameter selection for a penalized estimator of species richness
Abstract
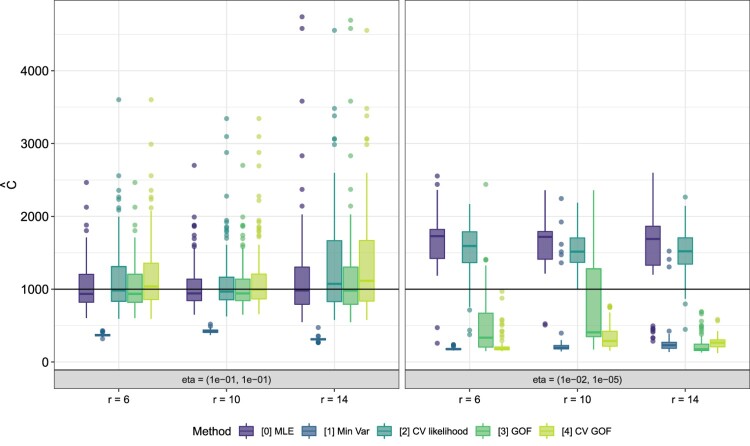
Our goal is to estimate the true number of classes in a population, called the species richness. We consider the case where multiple frequency count tables have been collected from a homogeneous population, and investigate a penalized maximum likelihood estimator under a negative binomial model. Because high probabilities of unobserved classes increase the variance of species richness estimates, our method penalizes the probability of a class being unobserved. Tuning the penalization parameter is challenging because the true species richness is never known, and so we propose and validate four novel methods for tuning the penalization parameter. We illustrate and contrast the performance of the proposed methods by estimating the strain-level microbial diversity of Lake Champlain over 3 consecutive years, and global human host-associated species-level microbial richness.
Keywords: diversity; ecology; maximum likelihood; microbiome; regularization.
Conflict of interest statement
Conflicts of Interest: None to declare.
Figures


References
-
- Bache S.M. and Wickham H., magrittr: A Forward-Pipe Operator for R, R package version 1.5, 2014.
-
- Barger K. and Bunge J., Objective Bayesian estimation for the number of species, Bayesian Anal. 5 (2010), pp. 765–785. doi: 10.1214/10-BA527 - DOI
-
- Bien J., The simulator: An engine to streamline simulations, preprint (2016). Available at http://www.arxiv.org/1607.00021.
-
- Bulmer M.G., On fitting the Poisson lognormal distribution to species-abundance data, Biometrics 30 (1974), pp. 101–110. doi: 10.2307/2529621 - DOI
-
- Bunge J. and Fitzpatrick M., Estimating the number of species: A review, J. Am. Stat. Assoc. 88 (1993), pp. 364–373.
Grants and funding
LinkOut - more resources
Full Text Sources