

Second-Order Conditioning and Conditioned Inhibition in Different Moments of the Same Training: The Effect of A+ and AX- Trial Number
- PMID: 33967712
- PMCID: PMC8097050
- DOI: 10.3389/fnbeh.2021.632548
Second-Order Conditioning and Conditioned Inhibition in Different Moments of the Same Training: The Effect of A+ and AX- Trial Number
Abstract
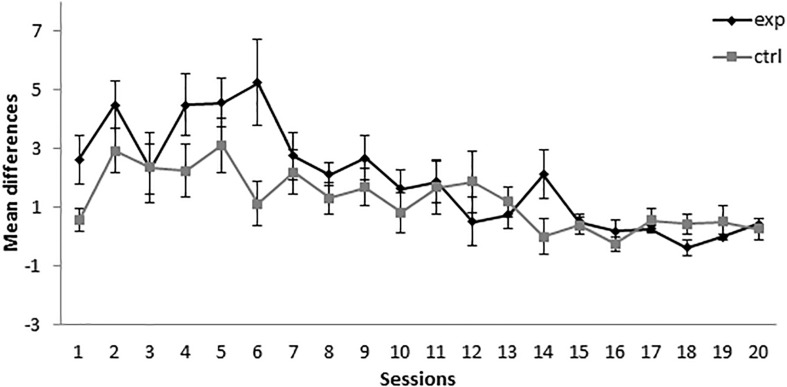
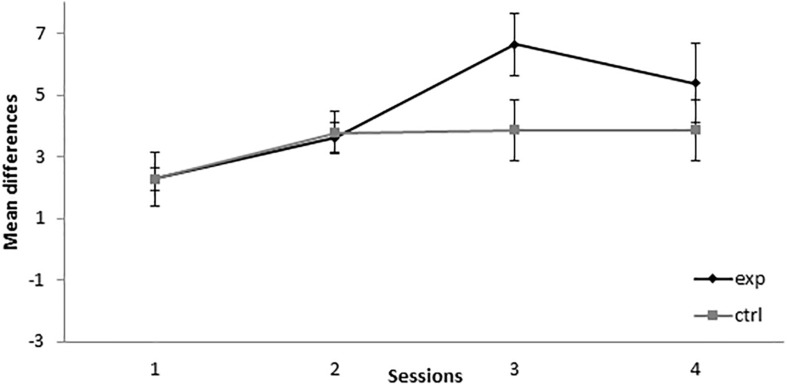
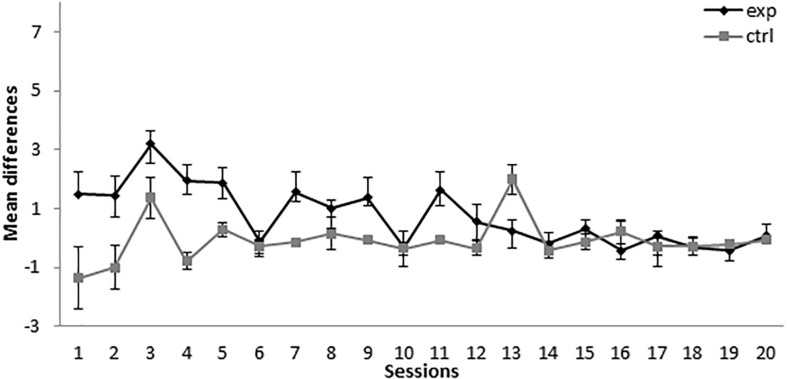
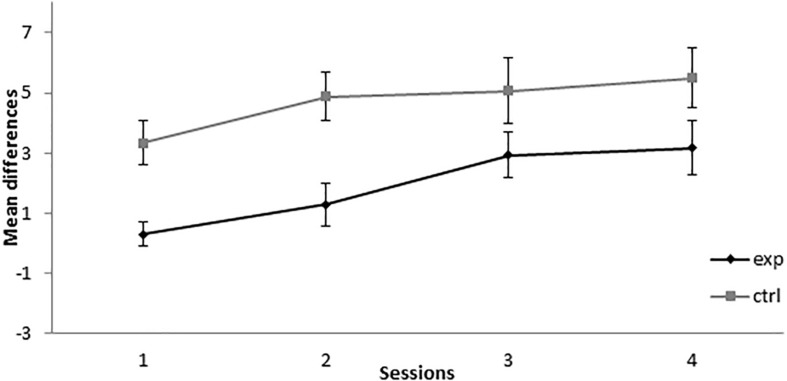
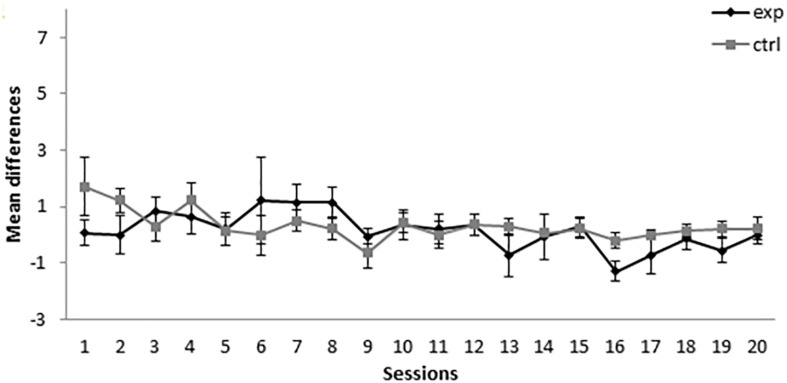
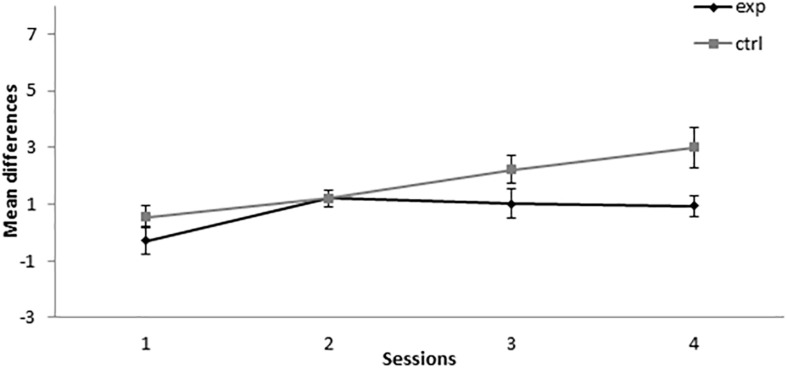
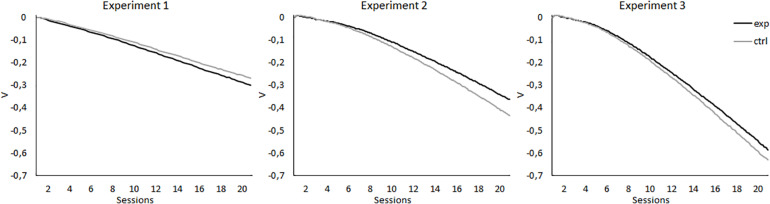
The feature negative discrimination (A+/AX-) can result in X gaining excitatory properties (second-order conditioning, SOC) or in X gaining inhibitory properties (conditioned inhibition, CI), a challenging finding for most current associative learning theories. Research on the variables that modulate which of these phenomena would occur is scarce but has clearly identified the trial number as an important variable. In the set of experiments presented here, the effect of trial number was assessed in a magazine training task with rats as a function of both the conditioning sessions and the number of A+ and AX- trials per session, holding constant the total number of trials per session. The results indicated that SOC is most likely to be found at the beginning of training when there are many A+ and few AX- trials, and CI (as assessed by a retardation test) is most likely to be found at the end of training when there are few A+ and many AX- trials. Both phenomena were also found at different moments of training when the number of A+ trials was equal to the number of AX- trials. These results cannot be predicted by acquisition-focused associative models but can be predicted by theories that distinguish between learning and performance.
Keywords: associative learning models; conditioned inhibition; cue interaction; feature negative discrimination; second-order conditioning.
Copyright © 2021 Muñiz-Diez, Muñiz-Moreno and Loy.
Conflict of interest statement
The authors declare that the research was conducted in the absence of any commercial or financial relationships that could be construed as a potential conflict of interest.
Figures
Similar articles
-
Second-Order Conditioning in Humans.Front Behav Neurosci. 2021 Jul 8;15:672628. doi: 10.3389/fnbeh.2021.672628. eCollection 2021. Front Behav Neurosci. 2021. PMID: 34305546 Free PMC article. Review.
-
Asymmetry between excitatory and inhibitory learning.J Exp Psychol Anim Learn Cogn. 2016 Oct;42(4):297-312. doi: 10.1037/xan0000110. Epub 2016 Sep 5. J Exp Psychol Anim Learn Cogn. 2016. PMID: 27598062
-
The fate of redundant cues: Further analysis of the redundancy effect.Learn Behav. 2015 Mar;43(1):72-82. doi: 10.3758/s13420-014-0162-x. Learn Behav. 2015. PMID: 25537840 Free PMC article.
-
Order effects after blocked preexposure to two compound flavors.Behav Processes. 2011 Oct;88(2):94-100. doi: 10.1016/j.beproc.2011.08.001. Epub 2011 Aug 25. Behav Processes. 2011. PMID: 21871952
-
AX+, BX- discrimination learning in the fear-potentiated startle paradigm: possible relevance to inhibitory fear learning in extinction.Learn Mem. 2004 Jul-Aug;11(4):464-75. doi: 10.1101/lm.74704. Epub 2004 Jul 14. Learn Mem. 2004. PMID: 15254216 Free PMC article.
Cited by
-
Second-Order Conditioning in Humans.Front Behav Neurosci. 2021 Jul 8;15:672628. doi: 10.3389/fnbeh.2021.672628. eCollection 2021. Front Behav Neurosci. 2021. PMID: 34305546 Free PMC article. Review.
References
-
- Byers J., Mondragón E., Alonso E. (2017). SOP Model Simulator. V. 1. CAL-R. PC. Available online at: https://www.cal-r.org/index.php?id=SOP-sim (accessed December 15, 2020).
-
- IBM Corp. (2016). IBM SPSS Statistics for Windows, Version 24.0. Armonk, NY: IBM Corp.
LinkOut - more resources
Full Text Sources
Other Literature Sources