

Nitrogen Use Efficiency in Sorghum: Exploring Native Variability for Traits Under Variable N-Regimes
- PMID: 33968102
- PMCID: PMC8097177
- DOI: 10.3389/fpls.2021.643192
Nitrogen Use Efficiency in Sorghum: Exploring Native Variability for Traits Under Variable N-Regimes
Abstract
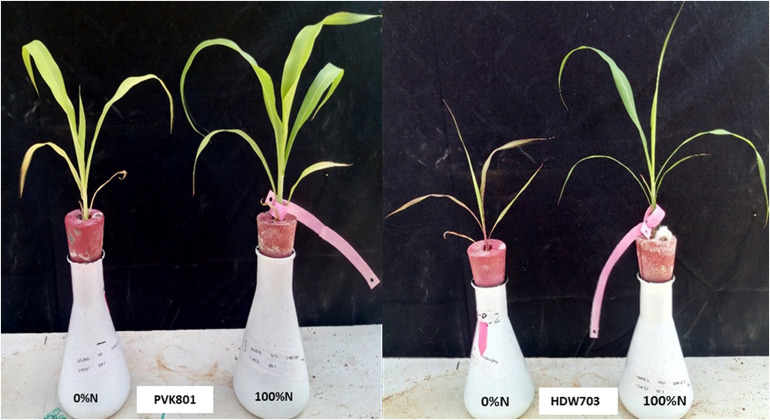
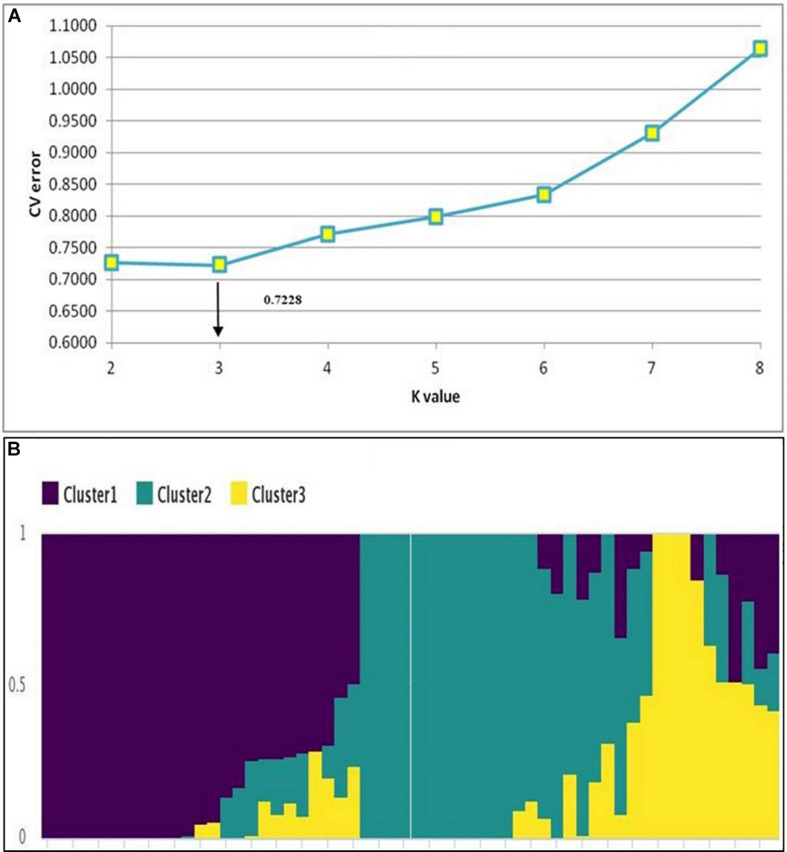
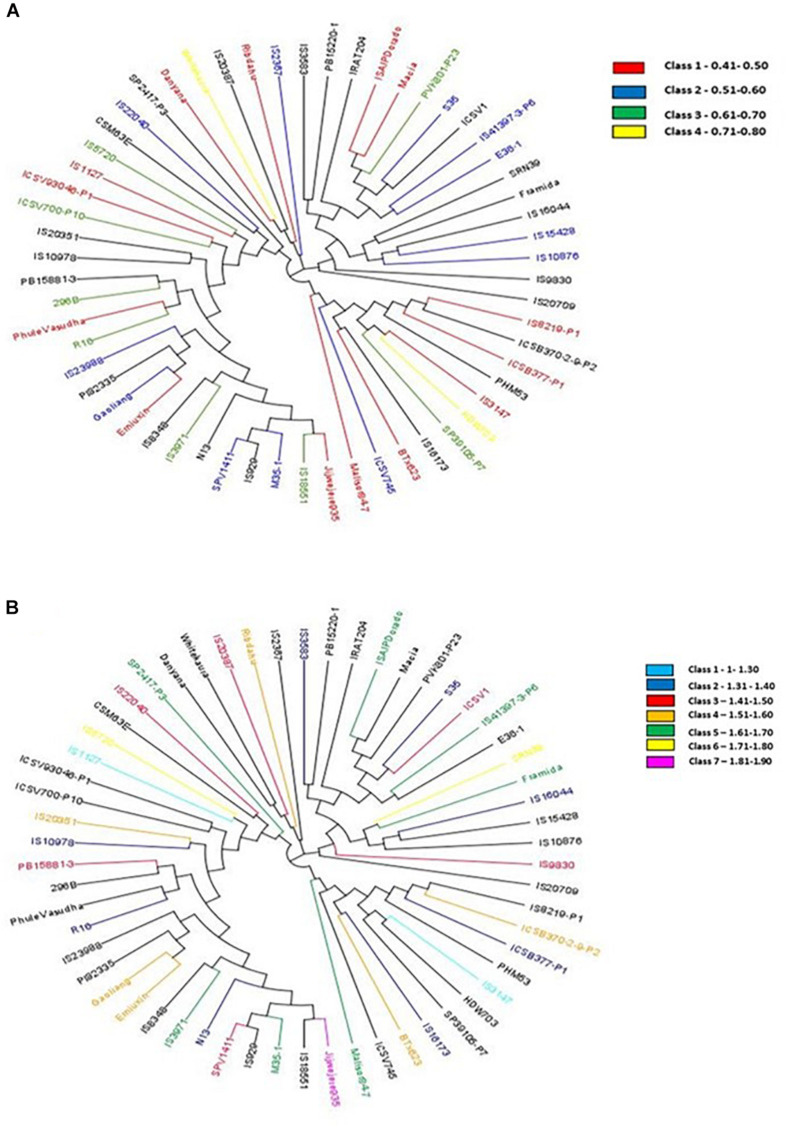
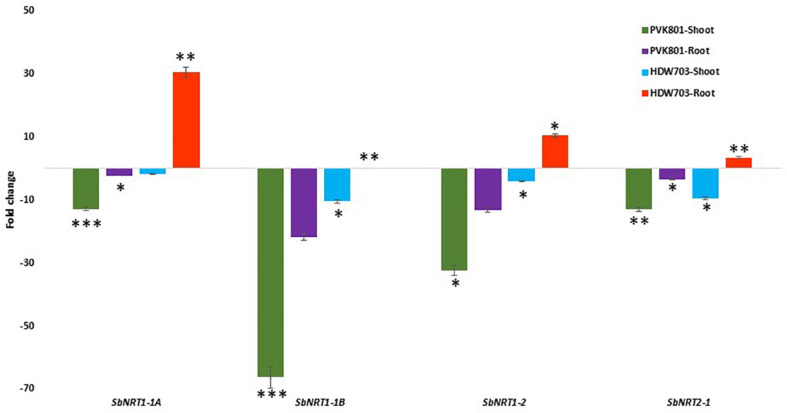
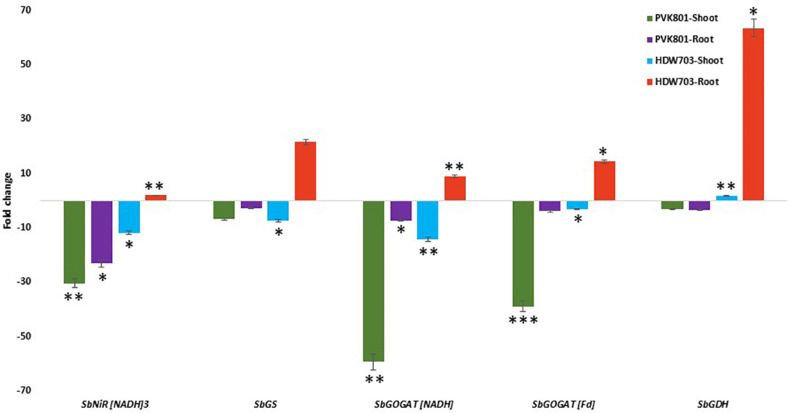
Exploring the natural genetic variability and its exploitation for improved Nitrogen Use Efficiency (NUE) in sorghum is one of the primary goals in the modern crop improvement programs. The integrated strategies include high-throughput phenotyping, next generation sequencing (NGS)-based genotyping technologies, and a priori selected candidate gene studies that help understand the detailed physiological and molecular mechanisms underpinning this complex trait. A set of sixty diverse sorghum genotypes was evaluated for different vegetative, reproductive, and yield traits related to NUE in the field (under three N regimes) for two seasons. Significant variations for different yield and related traits under 0 and 50% N confirmed the availability of native genetic variability in sorghum under low N regimes. Sorghum genotypes with distinct genetic background had interestingly similar NUE associated traits. The Genotyping-By-Sequencing based SNPs (>89 K) were used to study the population structure, and phylogenetic groupings identified three distinct groups. The information of grain N and stalk N content of the individuals covered on the phylogenetic groups indicated randomness in the distribution for adaptation under variable N regimes. This study identified promising sorghum genotypes with consistent performance under varying environments, with buffer capacity for yield under low N conditions. We also report better performing genotypes for varied production use-grain, stover, and dual-purpose sorghum having differential adaptation response to NUE traits. Expression profiling of NUE associated genes in shoot and root tissues of contrasting lines (PVK801 and HDW703) grown in varying N conditions revealed interesting outcomes. Root tissues of contrasting lines exhibited differential expression profiles for transporter genes [ammonium transporter (SbAMT), nitrate transporters (SbNRT)]; primary assimilatory (glutamine synthetase (SbGS), glutamate synthase (SbGOGAT[NADH], SbGOGAT[Fd]), assimilatory genes [nitrite reductase (SbNiR[NADH]3)]; and amino acid biosynthesis associated gene [glutamate dehydrogenase (SbGDH)]. Identification and expression profiling of contrasting sorghum genotypes in varying N dosages will provide new information to understand the response of NUE genes toward adaptation to the differential N regimes in sorghum. High NUE genotypes identified from this study could be potential candidates for in-depth molecular analysis and contribute toward the development of N efficient sorghum cultivars.
Keywords: N content; NUE; expression analysis; genetic variability; sorghum.
Copyright © 2021 Bollam, Romana, Rayaprolu, Vemula, Das, Rathore, Gandham, Chander, Deshpande and Gupta.
Conflict of interest statement
The authors declare that the research was conducted in the absence of any commercial or financial relationships that could be construed as a potential conflict of interest.
Figures
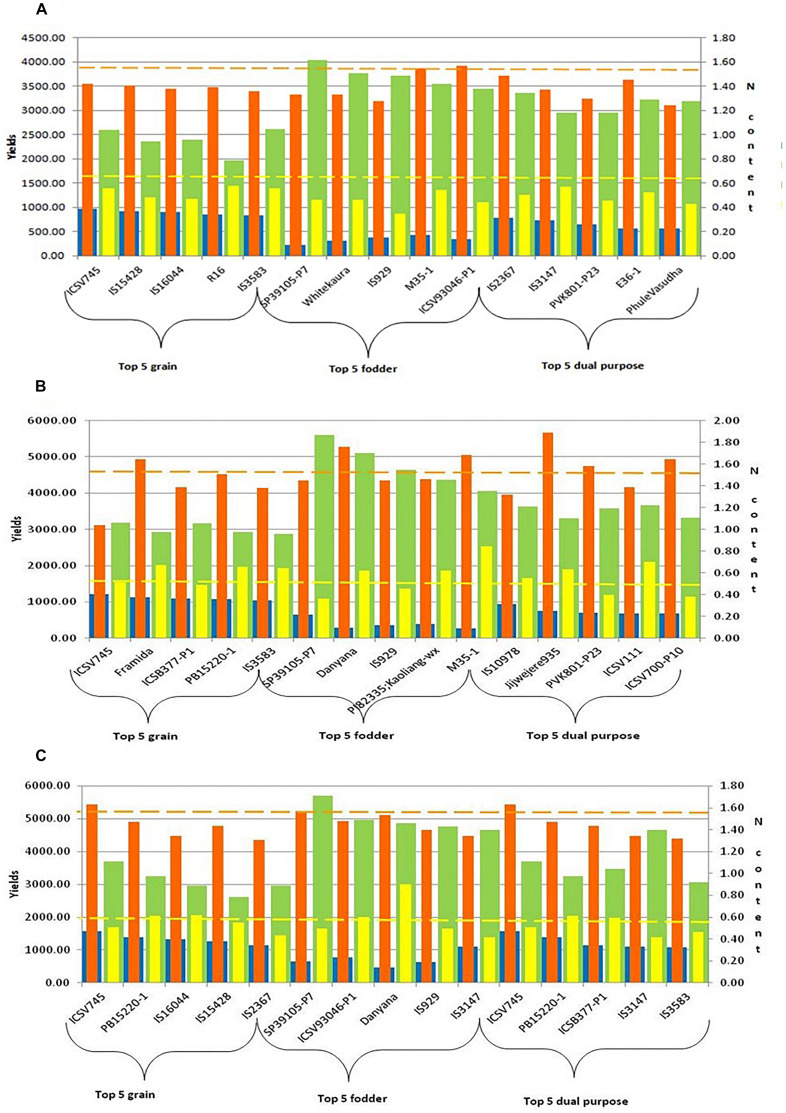
 GY (g): Grain yield (g);
 DSY (g): Dry stak yield (g);
  GN%: N content in grain;
  SN%: N content in stak].
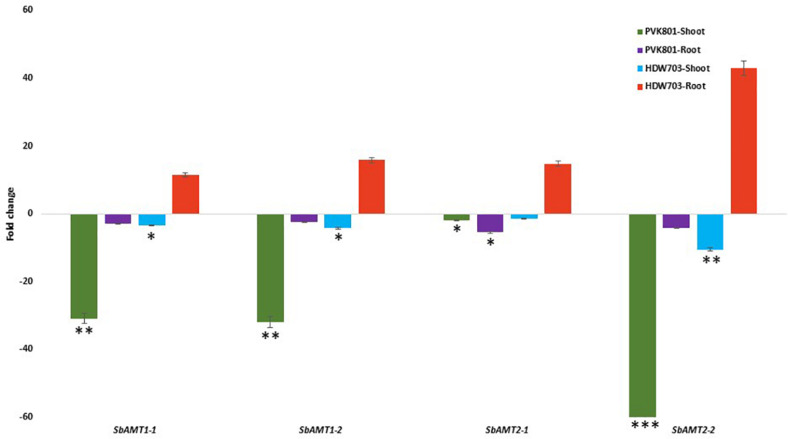
References
-
- Achakzai A. K. K., Rajpar H., Shah B. H., Wahid M. A. (2012). Effect of nitrogen fertilizer on the growth of mungbean [Vigna radiata (L.) Wilczek] grown in Quetta. Pakistan J. Bot. 44 981–987.
-
- Ajeigbe H. A., Akinseye F. M., Ayuba K., Jonah J. (2018). Productivity and Water Use Efficiency of Sorghum [Sorghum bicolor (L.) Moench] Grown under Different Nitrogen Applications in Sudan Savanna Zone, Nigeria. Int. J. Agron. 2018:20767605818. 10.1155/2018/7676058 - DOI
-
- Al Salameen F., Habibi N., Al Amad S., Kumar V., Dashti J., Talebi L., et al. (2020). Genetic diversity analysis of Rhanterium eppaposum Oliv. by ISSRs reveals a weak population structure. Curr. Plant Biol. 21:100138. 10.1016/j.cpb.2020.100138 - DOI
-
- Artacho P., Meza F., Alcalde J. A. (2011). Evaluation of the ORYZA2000 Rice Growth Model under Nitrogen-Limited Conditions in an Irrigated Mediterranean Environment. Chil. J. Agricult. Res. 71 23–33. 10.4067/s0718-58392011000100003 - DOI
LinkOut - more resources
Full Text Sources
Other Literature Sources