CRISPR/Cas9-Induced fad2 and rod1 Mutations Stacked With fae1 Confer High Oleic Acid Seed Oil in Pennycress (Thlaspi arvense L.)
- PMID: 33968108
- PMCID: PMC8100250
- DOI: 10.3389/fpls.2021.652319
CRISPR/Cas9-Induced fad2 and rod1 Mutations Stacked With fae1 Confer High Oleic Acid Seed Oil in Pennycress (Thlaspi arvense L.)
Abstract
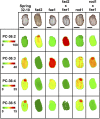
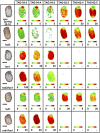
Pennycress (Thlaspi arvense L.) is being domesticated as an oilseed cash cover crop to be grown in the off-season throughout temperate regions of the world. With its diploid genome and ease of directed mutagenesis using molecular approaches, pennycress seed oil composition can be rapidly tailored for a plethora of food, feed, oleochemical and fuel uses. Here, we utilized Clustered Regularly Interspaced Short Palindromic Repeats (CRISPR)/Cas9 technology to produce knockout mutations in the FATTY ACID DESATURASE2 (FAD2) and REDUCED OLEATE DESATURATION1 (ROD1) genes to increase oleic acid content. High oleic acid (18:1) oil is valued for its oxidative stability that is superior to the polyunsaturated fatty acids (PUFAs) linoleic (18:2) and linolenic (18:3), and better cold flow properties than the very long chain fatty acid (VLCFA) erucic (22:1). When combined with a FATTY ACID ELONGATION1 (fae1) knockout mutation, fad2 fae1 and rod1 fae1 double mutants produced ∼90% and ∼60% oleic acid in seed oil, respectively, with PUFAs in fad2 fae1 as well as fad2 single mutants reduced to less than 5%. MALDI-MS spatial imaging analyses of phosphatidylcholine (PC) and triacylglycerol (TAG) molecular species in wild-type pennycress embryo sections from mature seeds revealed that erucic acid is highly enriched in cotyledons which serve as storage organs, suggestive of a role in providing energy for the germinating seedling. In contrast, PUFA-containing TAGs are enriched in the embryonic axis, which may be utilized for cellular membrane expansion during seed germination and seedling emergence. Under standard growth chamber conditions, rod1 fae1 plants grew like wild type whereas fad2 single and fad2 fae1 double mutant plants exhibited delayed growth and overall reduced heights and seed yields, suggesting that reducing PUFAs below a threshold in pennycress had negative physiological effects. Taken together, our results suggest that combinatorial knockout of ROD1 and FAE1 may be a viable route to commercially increase oleic acid content in pennycress seed oil whereas mutations in FAD2 will likely require at least partial function to avoid fitness trade-offs.
Keywords: CRISPR; MALDI-MSI; Thlaspi arvense; oilseed; oleic acid; pennycress; polyunsaturated fatty acid; triacylglycerol.
Copyright © 2021 Jarvis, Romsdahl, McGinn, Nazarenus, Cahoon, Chapman and Sedbrook.
Conflict of interest statement
Illinois State University has entered a licensing agreement with CoverCress, Inc. for use of the fae1 germplasm.
Figures


Similar articles
-
Functional analysis of β-ketoacyl-CoA synthase from biofuel feedstock Thlaspi arvense reveals differences in the triacylglycerol biosynthetic pathway among Brassicaceae.Plant Mol Biol. 2020 Oct;104(3):283-296. doi: 10.1007/s11103-020-01042-7. Epub 2020 Aug 1. Plant Mol Biol. 2020. PMID: 32740897
-
Molecular tools enabling pennycress (Thlaspi arvense) as a model plant and oilseed cash cover crop.Plant Biotechnol J. 2019 Apr;17(4):776-788. doi: 10.1111/pbi.13014. Epub 2018 Oct 25. Plant Biotechnol J. 2019. PMID: 30230695 Free PMC article.
-
Improved fatty acid composition of field cress (Lepidium campestre) by CRISPR/Cas9-mediated genome editing.Front Plant Sci. 2023 Jan 18;14:1076704. doi: 10.3389/fpls.2023.1076704. eCollection 2023. Front Plant Sci. 2023. PMID: 36755695 Free PMC article.
-
Domestication and engineering of pennycress (Thlaspi arvense L.): challenges and opportunities for sustainable bio-based feedstocks.Planta. 2024 Oct 29;260(6):127. doi: 10.1007/s00425-024-04560-6. Planta. 2024. PMID: 39470818 Review.
-
New approaches to facilitate rapid domestication of a wild plant to an oilseed crop: example pennycress (Thlaspi arvense L.).Plant Sci. 2014 Oct;227:122-32. doi: 10.1016/j.plantsci.2014.07.008. Epub 2014 Aug 4. Plant Sci. 2014. PMID: 25219314 Review.
Cited by
-
Downregulation of the GhROD1 Gene Improves Cotton Fiber Fineness by Decreasing Acyl Pool Saturation, Stimulating Small Heat Shock Proteins (sHSPs), and Reducing H2O2 Production.Int J Mol Sci. 2024 Oct 19;25(20):11242. doi: 10.3390/ijms252011242. Int J Mol Sci. 2024. PMID: 39457024 Free PMC article.
-
Towards DNA-free CRISPR/Cas9 genome editing for sustainable oil palm improvement.3 Biotech. 2024 Jun;14(6):166. doi: 10.1007/s13205-024-04010-w. Epub 2024 May 28. 3 Biotech. 2024. PMID: 38817736 Free PMC article. Review.
-
A Review of Erucic Acid Production in Brassicaceae Oilseeds: Progress and Prospects for the Genetic Engineering of High and Low-Erucic Acid Rapeseeds (Brassica napus).Front Plant Sci. 2022 May 11;13:899076. doi: 10.3389/fpls.2022.899076. eCollection 2022. Front Plant Sci. 2022. PMID: 35645989 Free PMC article. Review.
-
Chromosome-level Thlaspi arvense genome provides new tools for translational research and for a newly domesticated cash cover crop of the cooler climates.Plant Biotechnol J. 2022 May;20(5):944-963. doi: 10.1111/pbi.13775. Epub 2022 Feb 6. Plant Biotechnol J. 2022. PMID: 34990041 Free PMC article.
-
Multiplex CRISPR/Cas9 gene-editing platform in oil palm targeting mutations in EgFAD2 and EgPAT genes.J Genet Eng Biotechnol. 2023 Jan 11;21(1):3. doi: 10.1186/s43141-022-00459-5. J Genet Eng Biotechnol. 2023. PMID: 36630019 Free PMC article.
References
-
- Altendorf K., Isbell T., Wyse D. L., Anderson J. A. (2019). Significant variation for seed oil content, fatty acid profile, and seed weight in natural populations of field pennycress (Thlaspi arvense L.). Ind. Crops Prod. 129 261–268. 10.1016/j.indcrop.2018.11.054 - DOI
LinkOut - more resources
Full Text Sources
Other Literature Sources

