

Oncogenic WIP1 phosphatase attenuates the DNA damage response and sensitizes p53 mutant Jurkat cells to apoptosis
- PMID: 33968195
- PMCID: PMC8100942
- DOI: 10.3892/ol.2021.12740
Oncogenic WIP1 phosphatase attenuates the DNA damage response and sensitizes p53 mutant Jurkat cells to apoptosis
Abstract
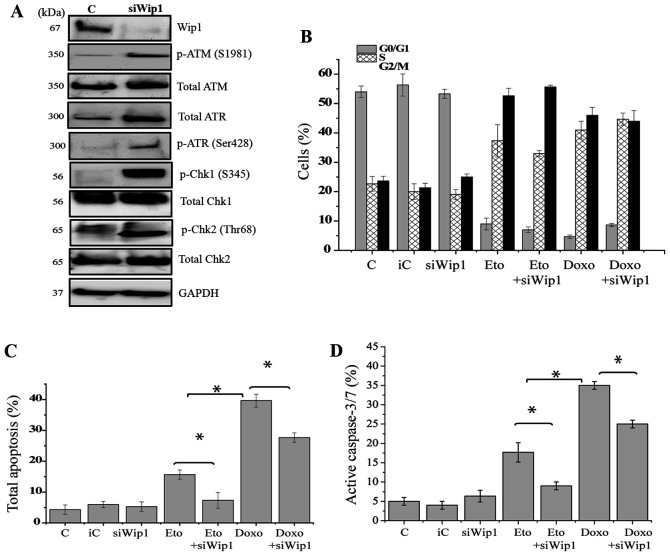
Wild-type (wt) p53-induced phosphatase 1 (Wip1), encoded by the protein phosphatase, Mg2+/Mn2+ dependent 1D (PPM1D) gene, is a serine/threonine phosphatase induced upon genotoxic stress in a p53-dependent manner. Wip1/PPM1D is frequently overexpressed, amplified and mutated in human solid tumors harboring wt p53 and is thus currently recognized as an oncogene. Oncogenic Wip1 dampens cellular stress responses, such as cell cycle checkpoints, apoptosis and senescence, and consequently increases resistance to anticancer therapeutics. Targeting Wip1 has emerged as a therapeutic strategy for tumors harboring wt p53. However, little is known about the efficacy of Wip1-targeted therapies in tumors lacking p53. The present study aimed to investigate the potential role of oncogenic Wip1 in p53 mutant (mt) Jurkat cells. In the present study, it was demonstrated that p53 mt Jurkat cells exhibited PPM1D/Wip1 gene amplification and expressed relatively high levels of Wip1, as confirmed by gene copy number and RNA expression analysis. In addition, Jurkat cells underwent G2 cell cycle arrest, apoptotic cell death and senescence in response to etoposide and doxorubicin, although the phosphorylation levels of DNA damage response (DDR) elements, including ataxia-telangiectasia mutated, ataxia-telangiestasia and Rad3-related, checkpoint kinase (Chk)1 and Chk2 were significantly low. Accordingly, the targeting of Wip1 phosphatase by RNA interference increased the phosphorylation of DDR elements, but decreased the rate of apoptosis in response to etoposide or doxorubicin in Jurkat cells. The induction of senescence or cell cycle arrest was not affected by the knockdown of Wip1. The results suggest that increased Wip1 expression enhances the apoptotic sensitivity of Jurkat cells in response to chemotherapeutic agents by attenuating DDR signaling. The present study highlights the possible pro-apoptotic role of Wip1 in a p53 mt T-cell acute lymphoblastic leukemia cell line. The data suggest the careful consideration of future treatment strategies aiming to manipulate or target Wip1 in human cancers lacking p53.
Keywords: Jurkat; apoptosis; doxorubicin; etoposide; p53; p53-induced phosphatase 1; senescence.
Copyright: © Eren et al.
Conflict of interest statement
The authors declare that they have no competing interests.
Figures


Similar articles
-
Arsenic trioxide augments Chk2/p53-mediated apoptosis by inhibiting oncogenic Wip1 phosphatase.J Biol Chem. 2008 Jul 4;283(27):18969-79. doi: 10.1074/jbc.M800560200. Epub 2008 May 15. J Biol Chem. 2008. PMID: 18482988
-
Wild-type p53-induced phosphatase 1 (Wip1) forestalls cellular premature senescence at physiological oxygen levels by regulating DNA damage response signaling during DNA replication.Cell Cycle. 2014;13(6):1015-29. doi: 10.4161/cc.27920. Epub 2014 Jan 31. Cell Cycle. 2014. PMID: 24552809 Free PMC article.
-
Inhibition of WIP1 phosphatase sensitizes breast cancer cells to genotoxic stress and to MDM2 antagonist nutlin-3.Oncotarget. 2016 Mar 22;7(12):14458-75. doi: 10.18632/oncotarget.7363. Oncotarget. 2016. PMID: 26883108 Free PMC article.
-
Regulation of the Wip1 phosphatase and its effects on the stress response.Front Biosci (Landmark Ed). 2012 Jan 1;17(4):1480-98. doi: 10.2741/3999. Front Biosci (Landmark Ed). 2012. PMID: 22201816 Free PMC article. Review.
-
The type 2C phosphatase Wip1: an oncogenic regulator of tumor suppressor and DNA damage response pathways.Cancer Metastasis Rev. 2008 Jun;27(2):123-35. doi: 10.1007/s10555-008-9127-x. Cancer Metastasis Rev. 2008. PMID: 18265945 Free PMC article. Review.
Cited by
-
Pentacyclic Triterpenoids-Based Ionic Compounds: Synthesis, Study of Structure-Antitumor Activity Relationship, Effects on Mitochondria and Activation of Signaling Pathways of Proliferation, Genome Reparation and Early Apoptosis.Cancers (Basel). 2023 Jan 26;15(3):756. doi: 10.3390/cancers15030756. Cancers (Basel). 2023. PMID: 36765714 Free PMC article.
-
Discovery of Novel Small-Molecule Scaffolds for the Inhibition and Activation of WIP1 Phosphatase from a RapidFire Mass Spectrometry High-Throughput Screen.ACS Pharmacol Transl Sci. 2022 Sep 28;5(10):993-1006. doi: 10.1021/acsptsci.2c00147. eCollection 2022 Oct 14. ACS Pharmacol Transl Sci. 2022. PMID: 36268125 Free PMC article.
-
Radiosensitizing effect of c-Met kinase inhibitor BPI-9016M in esophageal squamous cell carcinoma cells in vitro and in vivo.Ann Transl Med. 2021 Dec;9(24):1799. doi: 10.21037/atm-21-6586. Ann Transl Med. 2021. PMID: 35071493 Free PMC article.
References
LinkOut - more resources
Full Text Sources
Other Literature Sources
Molecular Biology Databases
Research Materials
Miscellaneous