. 2021 Apr 29;10(4):e1267.
doi: 10.1002/cti2.1267. eCollection 2021.

Categorisation of patients based on immune profiles: a new approach to identifying candidates for response to checkpoint inhibitors

Affiliations

Categorisation of patients based on immune profiles: a new approach to identifying candidates for response to checkpoint inhibitors

Svetlana Bornschlegl et al. Clin Transl Immunology. .

Abstract

Objectives: Inhibitors to the checkpoint proteins cytotoxic T-lymphocyte-associated protein 4 (CTLA-4) and programmed cell death protein 1 (PD-1) are becoming widely used in cancer treatment. However, a lack of understanding of the patient response to treatment limits accurate identification of potential responders to immunotherapy.

Methods: In this study, we assessed the expression of PD-1 and CTLA-4 on 19 leucocyte populations in the peripheral blood of 74 cancer patients. A reference data set for PD-1 and CTLA-4 was established for 40 healthy volunteers to determine the normal expression patterns for these checkpoint proteins.

Results: Unsupervised hierarchical clustering found four immune profiles shared across the solid tumor types, while chronic lymphocytic leukaemia patients had an immune profile largely unique to them. Furthermore, we measured these leucocyte populations on an additional cohort of 16 cancer patients receiving the PD-1 inhibitor pembrolizumab in order to identify differences between responders and non-responders, as well as compared to healthy volunteers (n = 20). We observed that cancer patients had pre-treatment PD-1 and CTLA-4 expression on their leucocyte populations at different levels compared to healthy volunteers and identified two leucocyte populations positive for CTLA-4 that had not been previously described. We found higher levels of PD-1+ CD3+ CD4- CD8- cells in patients with progressive disease and have identified it as a potential biomarker of response, as well as identifying other significant differences in phenotypes between responders and non-responders.

Conclusion: These results are suggestive that categorisation of patients based on immune profiles may differentiate responders from non-responders to immunotherapy for solid tumors.

Keywords: CTLA‐4; PD‐1; checkpoint inhibitors; immune monitoring; immune profile; programmed death 1.


Conflict of interest statement

MPG and ABD are inventors of technology used as a tool in this research (US Patent #20160077096, 2016). While this invention is not the target of these studies, the value may be brought to this invention by demonstrating new properties of the invention. MPG, ABD and Mayo Clinic have rights to this invention, and in the future, the invention may be licensed or sold to the benefit of the investigators or Mayo Clinic. Currently, this technology is not licensed.

Figures
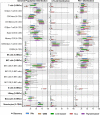
Figure 1
Figure 1
Distribution of general populations, CTLA‐4‐pos cells and PD‐1‐pos cells. Each of the seven parent populations was measured as percentage of MNCs except granulocytes, which were measured as a total of CD45‐pos cells. Child populations were measured as a percentage of the parent population. CTLA‐4‐pos and PD‐1‐pos cells were plotted as a percentage of the specific parent or child population indicated. Box and whiskers plots of each set of values are shown. An asterisk indicates statistical differences compared with the HV cohort. False discovery rate with a set q‐value of 10% was used for multiple t‐test comparisons. A dotted line indicates even counts too low to analyse. CLL, chronic lymphocytic leukaemia; CTLA‐4, cytotoxic T‐lymphocyte‐associated protein 4; GBM, glioblastoma multiforme; HV, healthy volunteer; LINneg, lineage‐negative; MNC, mononuclear cell; NK, natural killer; NKT, natural killer T cell; PD‐1, programmed death 1; pos, positive.
Figure 2
Figure 2
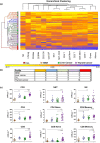
Hierarchical clustering and profiling of PD‐1. (a) Hierarchical clustering of PD‐1‐positive cells was performed on patients with GBM, liver tumor, CLL and thyroid cancer. B cells were removed from the analysis because of high levels in the CLL cohort. NKT‐DP, NKT‐CD4 and NKT‐DN did not reach minimum event criteria and were not included. Five major profiles clustered, and samples that did not fall into a cluster were removed for clarity. (b) Five clusters were identified as 1 (orange), 2 (blue), 3 (green), 4 (purple) and 5 (red). (c) PD‐1‐positive cells of patients in each profile were plotted, and a one‐way analysis of variance was performed to determine statistical significance between profiles. Profile 5 patients were not shown because of extremely high values that did not fit well with graph parameters. CLL indicates chronic lymphocytic leukaemia; GBM, glioblastoma multiforme; grans, granulocytes; LINneg, lineage‐negative; mem, memory; monos, monocytes; nai, naïve; NK, natural killer; NKT, natural killer T cell; PD‐1, programmed death 1.
Figure 3
Figure 3
(a) Absolute cell counts of patients on pembrolizumab. (b) Percentage of cells of parent population for patients on pembrolizumab. Denotation for disease groups is as follows: ‘CR’, clear and complete response; ‘benefit’, patients who achieved a clear partial response; and ‘PD’, those who had disease progression at their first disease reassessment. Patients with ‘questionable benefit’ who either achieved a mixed response (progression at some sites with regression or stable disease at other sites) or had clinical benefit that was not clearly related to immunotherapy were not included in the analysis.
Figure 4
Figure 4
Percentage of cells of the parent population for patients on pembrolizumab.
Figure 5
Figure 5
Hierarchical clustering and profiling of healthy volunteers (n = 20) patients on pembrolizumab pre‐treatment (n = 16) and their post‐treatment follow‐up visit. Two profiles were created, profile 1 consisting of all healthy volunteers, all pre‐treatment samples and one follow‐up sample. Profile 2 consisted of all follow‐up samples.
Figure 6
Figure 6
Characterisation of T‐cell signalling markers, CD152 PE and PD‐1 PC7 antibody validation. (a) A whole blood sample from a healthy volunteer was stained with the T‐cell signalling panel. Histograms were generated from each of 10 antibodies (except CD45) and used to delineate mononuclear populations (defined by CD45+SSClo/med). In most cases, two regions (R1 and R2) were created for each peak of expression, including peaks with no expression (i.e. N). Forward scatter (FS) and side scatter density plots were created for each histogram peak. Together, the specific peaks are used to identify unique phenotype combinations. (b) Validation of CD152 was done with isolated PBMCs. A fraction of the cells were stained directly after isolation (day 0). The remaining cells were cultured for 24 h (day 1) with and without CD3CD28 Dynabeads. Stimulated cells show increased CD152 levels. Histograms were generated to show stimulation‐induced CD152, as seen by R1, which was not seen among healthy volunteers. The three samples were overlaid. (c) PD‐1 antibody was validated by blocking. PBMCs with anti‐PD‐1 antibody before the addition of T‐cell signalling mix. An FMO for PD‐1 was performed on PBMCs. Both anti‐PD‐1 antibody and FMO showed no R1 region. Three samples were overlaid to show reduction in PD‐1. FMO indicates Fluorescence Minus One; N, no expression; PD‐1, programmed death 1; PBMC, peripheral blood mononuclear cell.

References

    1. Postow MA, Callahan MK, Wolchok JD. immune checkpoint blockade in cancer therapy. J Clin Oncol 2015; 33: 1974–1982. - PMC - PubMed
    1. Pardoll DM. The blockade of immune checkpoints in cancer immunotherapy. Nat Rev Cancer 2012; 12: 252–264. - PMC - PubMed
    1. Ansell SM, Lesokhin AM, Borrello I et al. PD‐1 blockade with Nivolumab in relapsed or refractory Hodgkin's lymphoma. N Engl J Med 2015; 372: 311–319. - PMC - PubMed
    1. Topalian SL, Hodi FS, Brahmer JR et al. Safety, activity, and immune correlates of anti–PD‐1 antibody in cancer. N Engl J Med 2012; 366: 2443–2454. - PMC - PubMed
    1. Salomon B, Bluestone JA. Complexities of CD28/B7: CTLA‐4 costimulatory pathways in autoimmunity and transplantation. Ann Rev Immunol 2001; 19: 225–252. - PubMed