. 2021 Jul;7(7):924-935.
doi: 10.1016/j.eng.2021.03.014. Epub 2021 May 3.

COVID-19 Vaccine Allocation: Modeling Health Outcomes and Equity Implications of Alternative Strategies

Affiliations

COVID-19 Vaccine Allocation: Modeling Health Outcomes and Equity Implications of Alternative Strategies

Maddalena Ferranna et al. Engineering (Beijing). 2021 Jul.

Abstract

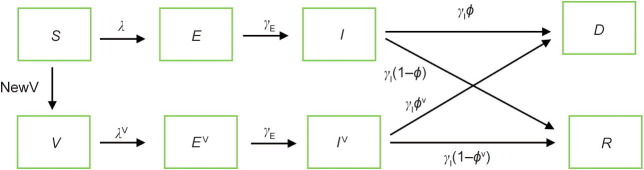
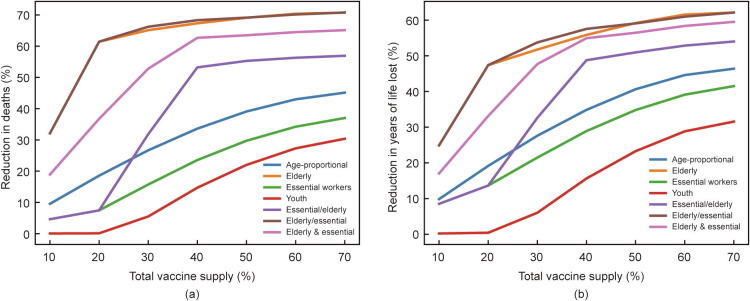
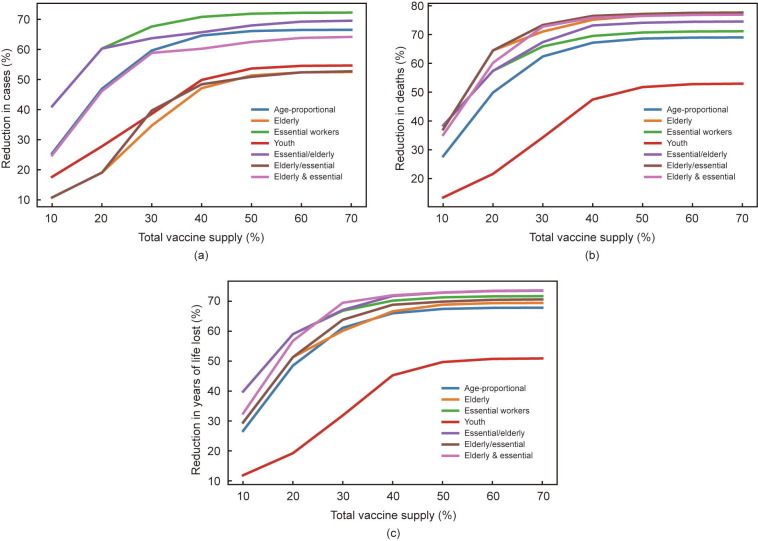
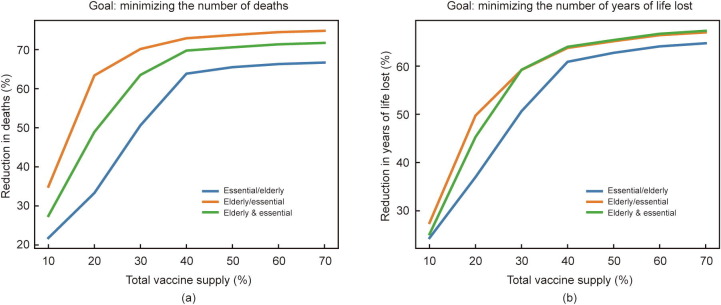
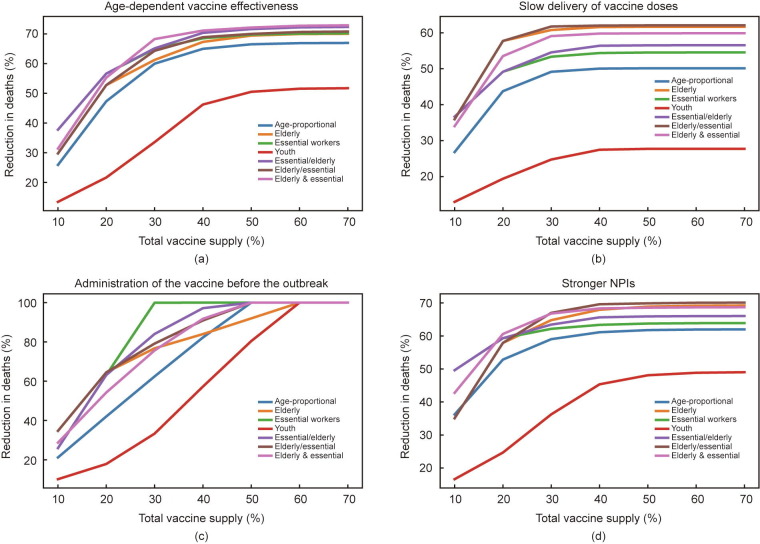
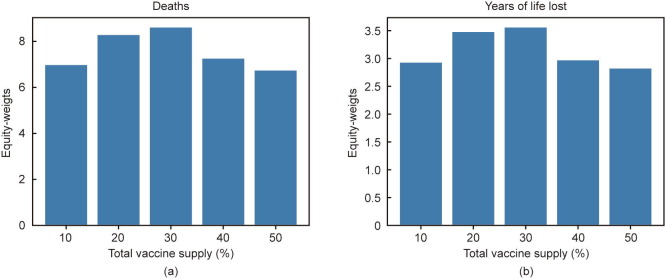
Given the scarcity of safe and effective COVID-19 vaccines, a chief policy question is how to allocate them among different sociodemographic groups. This paper evaluates COVID-19 vaccine prioritization strategies proposed to date, focusing on their stated goals; the mechanisms through which the selected allocations affect the course and burden of the pandemic; and the main epidemiological, economic, logistical, and political issues that arise when setting the prioritization strategy. The paper uses a simple, age-stratified susceptible-exposed-infectious-recovered model applied to the United States to quantitatively assess the performance of alternative prioritization strategies with respect to avoided deaths, avoided infections, and life-years gained. We demonstrate that prioritizing essential workers is a viable strategy for reducing the number of cases and years of life lost, while the largest reduction in deaths is achieved by prioritizing older adults in most scenarios, even if the vaccine is effective at blocking viral transmission. Uncertainty regarding this property and potential delays in dose delivery reinforce the call for prioritizing older adults. Additionally, we investigate the strength of the equity motive that would support an allocation strategy attaching absolute priority to essential workers for a vaccine that reduces infection-fatality risk.

Keywords: COVID-19; Equity; SEIR model; Vaccine allocation.


Figures

Fig. 1
Fig. 1
Diagram of the SEIR model with vaccination. The variables next to the arrows denote the probability of transitioning from one compartment to the next. Probabilities marked with the superscript V may have been altered by vaccination. λ and λV represent the probabilities of infection. γE is the probability of transitioning from the exposed to the infectious state. γI is the probability of exiting the infectious states I and IV. ϕ and ϕV represent the infection-fatality rates. NewV denotes the number of individuals vaccinated in a single day.
Fig. 2
Fig. 2
Impact of a vaccine that is 90% effective at reducing infection-fatality risk as a function of total vaccine supply. The y-axis represents (a) the percentage reduction in deaths and (b) the percentage reduction in years of life lost compared to a scenario with no vaccine. The x-axis represents the percentage of the population that would eventually be vaccinated.
Fig. 3
Fig. 3
Impact of a vaccine that is 90% effective at reducing infection risk as a function of total vaccine supply. The y-axis represents (a) the percentage reduction in cases, (b) the percentage reduction in deaths, and (c) the percentage reduction in years of life lost compared to a scenario with no vaccine. The x-axis represents the percentage of the population that would eventually be vaccinated.
Fig. 4
Fig. 4
Expected impact of a vaccine that is 90% effective at reducing fatality risk but with uncertain effectiveness at reducing transmission risk as a function of total vaccine supply. The y-axis represents (a) the average percentage reduction in the number of deaths and (b) the average percentage reduction in the number of years of life lost compared to a scenario with no vaccine. Thus, a 50% reduction in deaths indicates that the allocation averts 50% of deaths on average. Uncertainty was modeled by assuming that the effectiveness at reducing transmission risk was uniformly distributed between 0% and 90%. The x-axis represents the percentage of the population that would eventually be vaccinated.
Fig. 5
Fig. 5
Sensitivity analysis: percentage reduction in the number of deaths for a vaccine that is 90% effective at reducing infection risk in alternative scenarios as a function of total vaccine supply. (a) Age-dependent vaccine effectiveness: The vaccine was considered 90%, 85%, 80%, 75%, and 70% effective for the 0–49, 50–59, 60–69, 70–79, and 80+ year-old age groups, respectively. (b) Slow delivery of vaccine doses: 0.5% of the population was vaccinated daily, regardless of the total vaccine supply. (c) Administration of the vaccine before the outbreak: The first doses were administered in the absence of infection-acquired immunity and with only one infection per sociodemographic group. (d) Stronger NPIs: The reproductive number was equal to 1.3. The y-axis represents the percentage reduction in number of deaths compared to that in a scenario with no vaccine. The x-axis represents the percentage of the population that would eventually be vaccinated.
Fig. 6
Fig. 6
Equity-weights attached to preserving (a) the life or (b) the life-years of an essential worker such that essential workers would receive absolute priority in the allocation of a vaccine that is 90% effective at reducing fatalities (the equity-weight attached to preserving the life/life years of an older person is 1). The y-axis represents the equity-weight attached to preserving (a) the life or (b) life years of an essential worker compared to the life or life years of an older adult. For example, a weight of two indicates that preserving the life (a year of life) of an essential worker was equity-weighted to preserving the life of two older adults (two years of life of an older adult). The x-axis represents the maximum percentage of the population that would be vaccinated.

References

    1. coronavirus.jhu.edu [Internet]. Baltimore: Johns Hopkins University & Medicine; 2020 [cited 2020 Dec 14]. Available from: https://coronavirus.jhu.edu/map.html.
    1. International Monetary Fund. World Economic Outlook, October 2020: a long and difficult ascent [Internet]. Washington, DC: International Monetary Fund 2020 [cited 2020 Dec 13]. Available from: https://www.imf.org/en/Publications/WEO/Issues/2020/09/30/world-economic....
    1. Bloom D.E., Cadarette D., Ferranna M., Hyer R.N., Tortorice D.L. How new models of vaccine development for COVID-19 have helped address an epic public health crisis. Health Aff. 2021;40(3):410–418. - PubMed
    1. Zimmer C., Corum J., Wee S.L. The New York Times Company; New York: 2020. Coronavirus vaccine tracker [Internet] [cited 2021 Feb 24]. Available from: https://www.nytimes.com/interactive/2020/science/coronavirus-vaccine-tra....
    1. Institute of Medicine . The National Academy Press; Washington, DC: 2010. The 2009 H1N1 influenza vaccination campaign: summary of a workshop series. Available from: http://www.ncbi.nlm.nih.gov/books/NBK54185/ - PubMed

LinkOut - more resources