. 2021 Apr 22:11:665763.
doi: 10.3389/fonc.2021.665763. eCollection 2021.

Adipocytes Provide Fatty Acids to Acute Lymphoblastic Leukemia Cells

Affiliations

Adipocytes Provide Fatty Acids to Acute Lymphoblastic Leukemia Cells

Jonathan Tucci et al. Front Oncol. .

Abstract

Background: There is increasing evidence that adipocytes play an active role in the cancer microenvironment. We have previously reported that adipocytes interact with acute lymphoblastic leukemia (ALL) cells, contributing to chemotherapy resistance and treatment failure. In the present study, we investigated whether part of this resistance is due to adipocyte provision of lipids to ALL cells.

Methods: We cultured 3T3-L1 adipocytes, and tested whether ALL cells or ALL-released cytokines induced FFA release. We investigated whether ALL cells took up these FFA, and using fluorescent tagged BODIPY-FFA and lipidomics, evaluated which lipid moieties were being transferred from adipocytes to ALL. We evaluated the effects of adipocyte-derived lipids on ALL cell metabolism using a Seahorse XF analyzer and expression of enzymes important for lipid metabolism, and tested whether these lipids could protect ALL cells from chemotherapy. Finally, we evaluated a panel of lipid synthesis and metabolism inhibitors to determine which were affected by the presence of adipocytes.

Results: Adipocytes release free fatty acids (FFA) when in the presence of ALL cells. These FFA are taken up by the ALL cells and incorporated into triglycerides and phospholipids. Some of these lipids are stored in lipid droplets, which can be utilized in states of fuel deprivation. Adipocytes preferentially release monounsaturated FFA, and this can be attenuated by inhibiting the desaturating enzyme steroyl-CoA decarboxylase-1 (SCD1). Adipocyte-derived FFA can relieve ALL cell endogenous lipogenesis and reverse the cytotoxicity of pharmacological acetyl-CoA carboxylase (ACC) inhibition. Further, adipocytes alter ALL cell metabolism, shifting them from glucose to FFA oxidation. Interestingly, the unsaturated fatty acid, oleic acid, protects ALL cells from modest concentrations of chemotherapy, such as those that might be present in the ALL microenvironment. In addition, targeting lipid synthesis and metabolism can potentially reverse adipocyte protection of ALL cells.

Conclusion: These findings uncover a previously unidentified interaction between ALL cells and adipocytes, leading to transfer of FFA for use as a metabolic fuel and macromolecule building block. This interaction may contribute to ALL resistance to chemotherapy, and could potentially be targeted to improve ALL treatment outcome.

Keywords: FFA; adipocytes; leukemia; lipid droplets; microenvironment.


Conflict of interest statement

The authors declare that the research was conducted in the absence of any commercial or financial relationships that could be construed as a potential conflict of interest.

Figures

Figure 1
Figure 1
3T3-L1 adipocytes release FFA in the presence of ALL cells. (A) Representative images of adipocytes after 72-hour incubation in control (left) or 8093 conditioned media (LCM; right; Red = Oil Red O; Blue = DAPI counterstain). (B) Adipocyte lipid content after 72-hour co-culture (left) or culture in conditioned media (right) of 3T3-L1 fibroblasts, murine (8093) ALL cells, or human (BV173) ALL cells. Lipid content was quantified by pixel count of Oil Red O stained images divided by number of adipocytes in each image. Values are normalized to control conditions (20 images per condition per n; n=3) (C) FFA concentration in media after BV173 ALL and 3T3-L1 adipocytes were cultured for 24 hours alone or together in transwell systems (n=6). (D) FFA release from 3T3-L1 adipocytes after 24 hours in standard media or LCM from various ALL cell lines. ISO = 1 mM isoproterenol. n= 5. *’s represent significance vs. RPMI alone. (E) FFA released by adipocytes into media after 24 hour incubation with complete media, non-leukemic pre-B cell conditioned media or BV173 LCM (n=3). (F) FFA concentrations in RPMI, BV173 LCM, or 1 mM isoproterenol culture alone (left) or over adipocytes (right). *represent significance vs. RPMI bars (n=6-7). (G) Glycerol concentrations from the same experiments described in (F). (H) Glycerol released from human SVF-derived adipocytes after culture with RPMI, LCM, or 1 mM isoproterenol (n=6). *p < 0.05, **p < 0.01, ***p < 0.001.
Figure 2
Figure 2
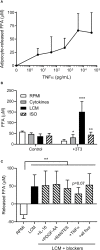
Effects of cytokines on 3T3-L1 adipocyte FFA release. (A) Measurement of adipocyte FFA release following TNFα exposure for 24 hours at various doses. (n=3/dose). (B) FFA concentrations in various media incubated alone or over 3T3-L1 adipocytes (n=6); *, **, *** indicate significance compared to RPMI alone over 3T3. (C) Net release of FFA from 3T3-L1 adipocytes after 24 hour incubation with LCM in the presence of four different cytokine receptor blockers. Blockers were added to LCM 30 minutes prior to adipocytes. (n=5) *p<0.05, **p<0.01, ***p<0.001.
Figure 3
Figure 3
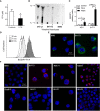
ALL cell uptake of adipocyte-derived FFA. (A) FFA concentration in complete media and BV173 LCM. (n=3; *p < 0.05). (B) Ultraviolet exposure of thin-layer chromatography plate with BODIPY-labeled lipids in 3T3-L1 adipocyte, BV173 and 8093 cells.*, Alkaline hydrolyzed lipid extracts from each cell; PL, Phospholipid; TG, Triglyceride. (C) BODIPY quantification in 8093 and BV173 ALL cells cultured for 48 hours in transwells alone (Control) or over fibroblasts (Fibro) or adipocytes (Adipo) pre-labeled with BODIPY-FFA. The median value of BODIPY fluorescence was determined by flow cytometry. (n=4/condition; *p < 0.05, ***p < 0.001) (D) Flow cytometry histogram of BV173 cells co-cultured for 0, 1 or 2 hours over BODIPY-FFA pre-labeled adipocytes. (E) Representative confocal images of ALL cells co-cultured for 48 hours over adipocytes pre-labeled with BODIPY-FFA. (Green: BODIPY-FFA; Blue: DAPI) (F) Oil Red O and DAPI stained murine and human ALL cell lines cultured under standard conditions, as well as leukemic blasts from patient-derived bone marrow smears (ALL01, ALL02, ALL03).
Figure 4
Figure 4
Stable-isotope lipidomic identification of adipocyte-derived FFA. (A) Representative spectra from nanoDESI-MS analysis of adipocytes differentiated without (left) and with (right) U-13C-glucose. Spectra are cropped to highlight triglycerides in the m/z range 850-875, and demonstrate the prevalence of 13C-enriched moieties. (B) Percent 13C2 enrichment of four FFA in media following adipocyte and ALL cell co-culture for 0, 6, 24 or 48 hours. Values are derived from average peak intensity for each FFA over 4 samplings. (C) 13C enrichment of media FFA following co-culture with adipocytes differentiated with U-13C-glucose in the presence or absence of the SCD1 inhibitor, Cay10566. Saturated FFA (SFA) represent the summation of C16:0 and C18:0, while monounsaturated FFA (MUFA) are the summation of C16:1 and C18:1 (n=4). *p < 0.05, **p < 0.01, ***p < 0.001. (D, E) 13C2 enrichment in FFA in BV173 ALL cells following adipocyte and ALL cell co-culture, as described for panels (B, C) above. *p < 0.05, **p < 0.01, ***p < 0.001.
Figure 5
Figure 5
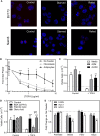
ALL cell dependence on de novo lipogenesis is relieved by adipocytes. (A) Confocal microscopy of BV173 and Nalm6 human ALL cells stained with Oil Red O after standard culture (Control), 24 hours in low-glucose serum-free medium (Starved), and 24 hours “refeeding” in standard medium after starvation (Refed). Representative of 6 pictures for each condition. (B) Viable BV173 cells after 72 hour co-culture in serum-free complete media with various doses of the ACC1 inhibitor, TOFA. (*p < 0.05, ***p < 0.001; n=3). (C) Viable BV173 cells after 72 hour culture in regular or conditioned media in the presence of 2 μg/mL TOFA (ACM, adipocyte-conditioned media; ALCM, adipocyte and leukemia cell-conditioned media; *p < 0.05, **p < 0.01 vs. media; n=3). (D) Viable BV173 cells after 72 hour culture in serum-free complete media supplemented with 1% BSA or 200 μM BSA-conjugated FFA, with and without 2 μg/mL TOFA (*p < 0.05, ***p < 0.001 vs. control; n=3). (E) Gene expression by rtPCR of FASN, ACC1 and SCD1 of BV173 ALL cells following 24 hour culture in serum free, low glucose media supplemented with 200μM exogenous FFA, or in co-culture with fibroblasts (Fibro) or adipocytes (Adipo) for 72 hours. Genes are normalized to β-actin before normalization to media only condition (*p < 0.05, **p < 0.01, ***p < 0.001, n=4).
Figure 6
Figure 6
ALL cells rely on FFA oxidation in the presence of adipocytes. (A) Representative tracing of BV173 ALL cell O2 consumption rates (OCR) measured during extracellular flux analysis using the Seahorse XF96 analyzer. ALL cells had been cultured for one day in transwells alone or over 3T3-L1 adipocytes until just prior to analysis (n=4-6). (B) Representative day #3 tracing from experiments similar to A above (n=4-6) (C, D) ATP-linked basal (C) and maximal (D) OCR from experiments described above. *’s indicate significance vs. alone condition. (E) Lactate efflux was calculated from extracellular acidification rate (ECAR) from above experiments. (F) ATP production rates in ALL cells from experiments above. On day 3, glycolysis, oxidative phosphorylation, and total ATP production were lower in ALL cells cultured over adipocytes. (G) Difference in basal oxygen consumption of BV173 cells measured without and with BSA-conjugated oleic acid, after culture alone or over adipocytes (n=3). (H) Oxygen consumption rates for permeabilized BV173 ALL cells offered palmitoyl-CoA after culture alone or over adipocytes (n=3). *p < 0.05, **p < 0.01.
Figure 7
Figure 7
Expression of proteins regulating lipid metabolism in ALL cells (A) Representative western blot of BV173 lysate following culture in serum-free media alone or with fibroblasts or adipocytes for 72 hours. (B) Average CPT1A protein expression of BV173 cells described in A (*p<0.05, n=6). (C) Representative western blot of BV173 after culture as described above showing phospho- and total PDH. (D) Ratio of phospho-PDH to total PDH by densitometric analysis of western blots as in D (n=6).
Figure 8
Figure 8
Targeting adipocyte protection of ALL cells (A) BV173 cells were cultured in serum free RPMI with 1% free fatty acid-free BSA, supplemented with various concentrations of oleic acid and treated with DNR or VCR for 72 hours. Low dose: DNR 25 nM, VCR 2 nM; high dose (not shown): DNR 60 nM, VCR 5 nM. (B) BV173 ALL cells were cultured in RPMI with 10% FBS in transwells over no feeder vs. 3T3-L1 adipocytes, and treated for 72 hours with inhibitors of fatty acid synthesis or desaturation, used at their estimated EC50 concentration. (C) BV173 ALL cells were treated as above, with inhibitors of fatty acid oxidation or triglyceride synthesis at their EC50 concentration. (D) BV173 ALL cells were treated with 0.7 nM vincristine alone or in combination with selected lipid-targeting drugs in transwells alone or over 3T3-L1 adipocytes. *p < 0.05, **p < 0.01, ***p < 0.001; n=4-5 for all experiments.

Similar articles

Cited by

References

    1. Calle EE, Rodriguez C, Walker-Thurmond K, Thun MJ. Overweight, Obesity, and Mortality From Cancer in a Prospectively Studied Cohort of U.S. Adults. N Engl J Med (2003) 348:1625–38. 10.1056/NEJMoa021423 - DOI - PubMed
    1. Surveillance,Epidemiology. End Results (SEER) Program . Seer*Stat Database (2018). Available at: www.seer.cancer.gov.
    1. Butturini AM, Dorey FJ, Lange BJ, Henry DW, Gaynon PS, Fu C, et al. . Obesity and Outcome in Pediatric Acute Lymphoblastic Leukemia. J Clin Oncol (2007) 25:2063–9. 10.1200/JCO.2006.07.7792 - DOI - PubMed
    1. Orgel E, Genkinger JM, Aggarwal D, Sung L, Nieder M, Ladas EJ. Association of Body Mass Index and Survival in Pediatric Leukemia: A Meta-Analysis. Am J Clin Nutr (2016) 103:808–17. 10.3945/ajcn.115.124586 - DOI - PMC - PubMed
    1. Orgel E, Tucci J, Alhushki W, Malvar J, Sposto R, Fu CH, et al. . Obesity is Associated With Residual Leukemia Following Induction Therapy for Childhood B-precursor Acute Lymphoblastic Leukemia. Blood (2014) 124:3932–8. 10.1182/blood-2014-08-595389 - DOI - PubMed