. 2021 Apr 23:9:634355.
doi: 10.3389/fcell.2021.634355. eCollection 2021.

Recovery of Depleted miR-146a in ALS Cortical Astrocytes Reverts Cell Aberrancies and Prevents Paracrine Pathogenicity on Microglia and Motor Neurons

Affiliations

Recovery of Depleted miR-146a in ALS Cortical Astrocytes Reverts Cell Aberrancies and Prevents Paracrine Pathogenicity on Microglia and Motor Neurons

Marta Barbosa et al. Front Cell Dev Biol. .

Abstract

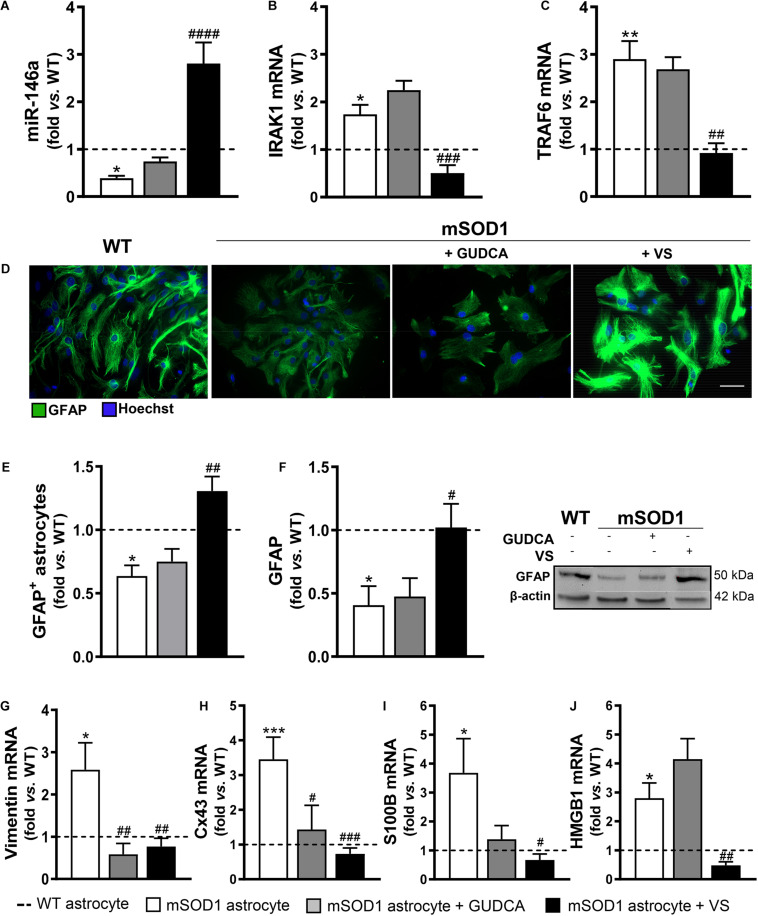
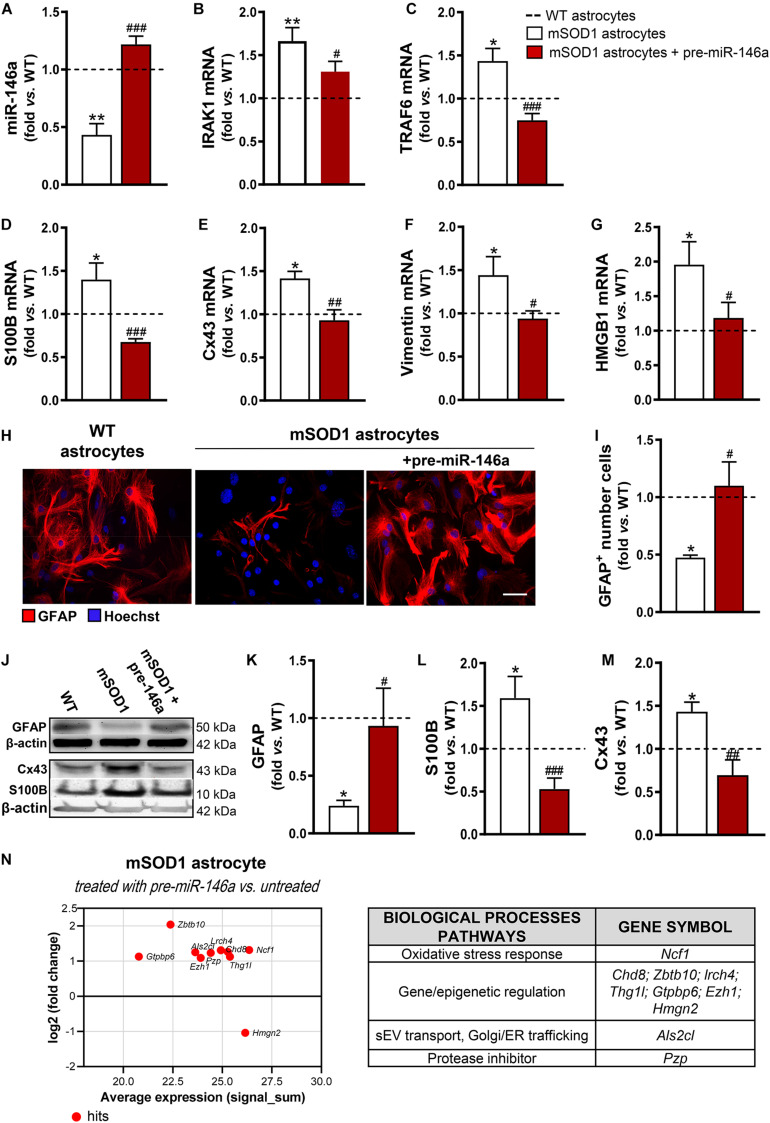
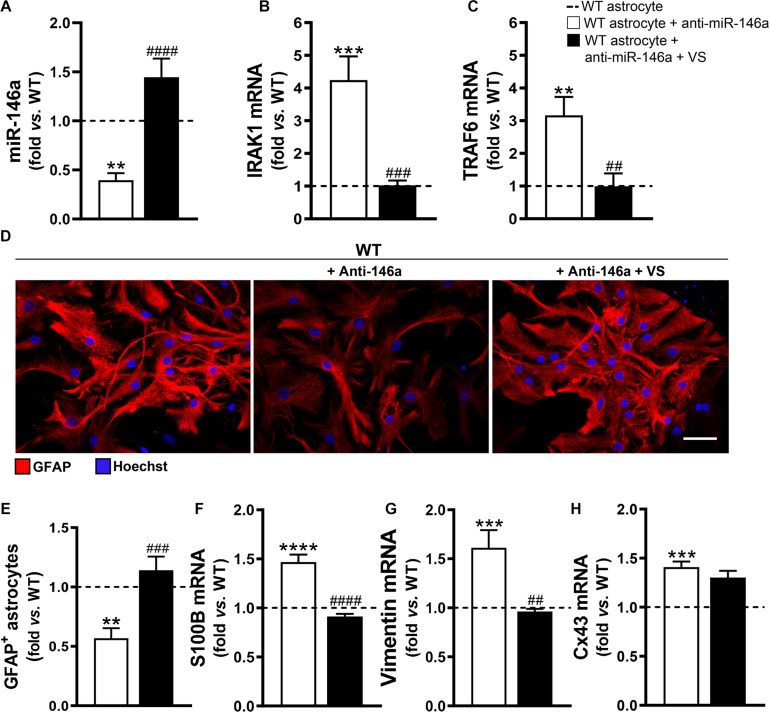
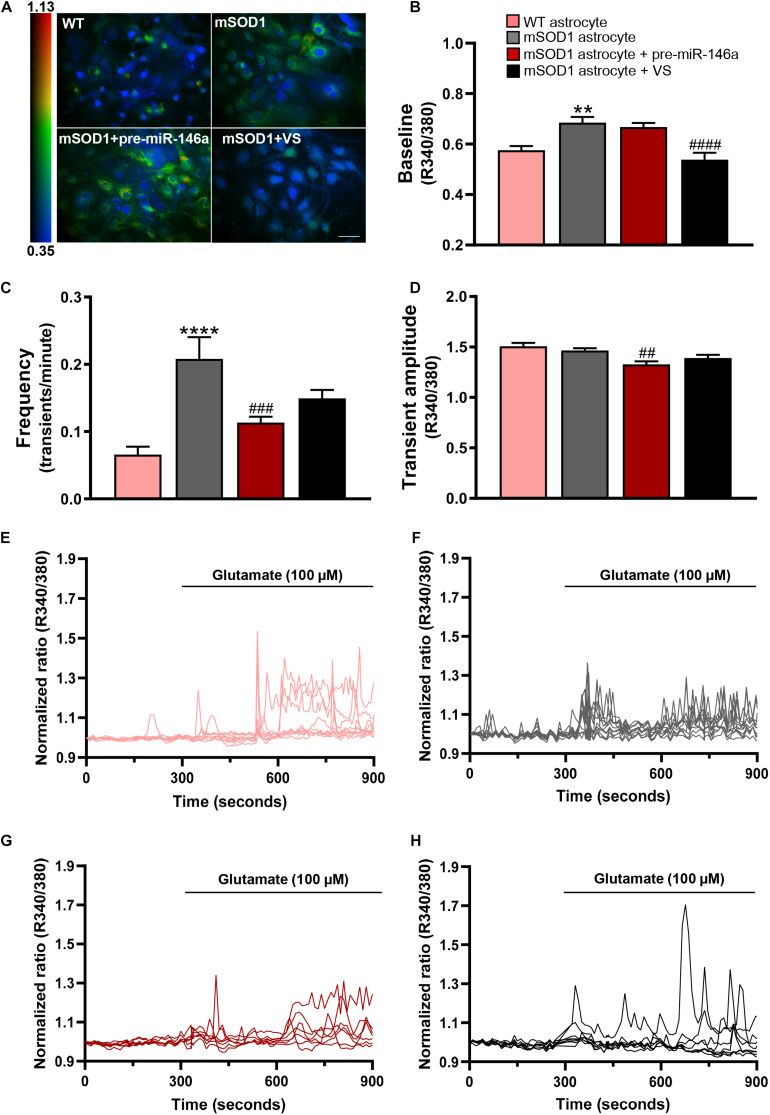
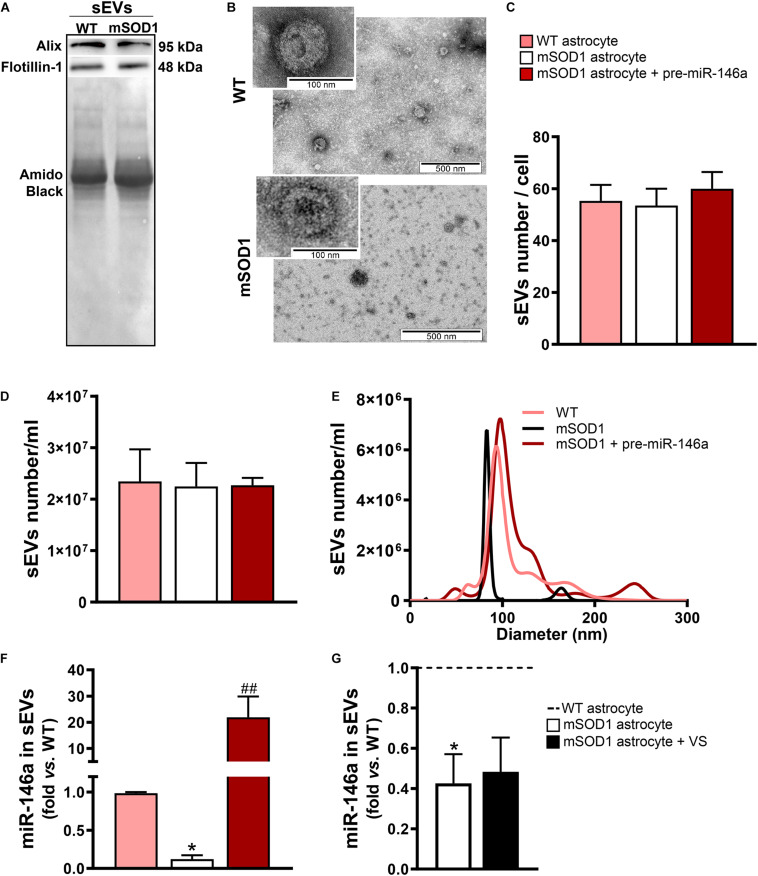
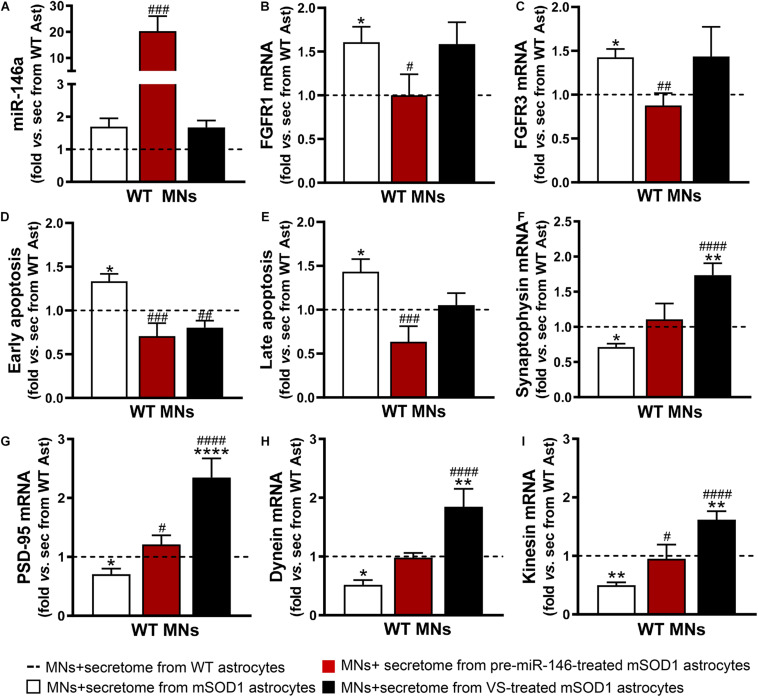
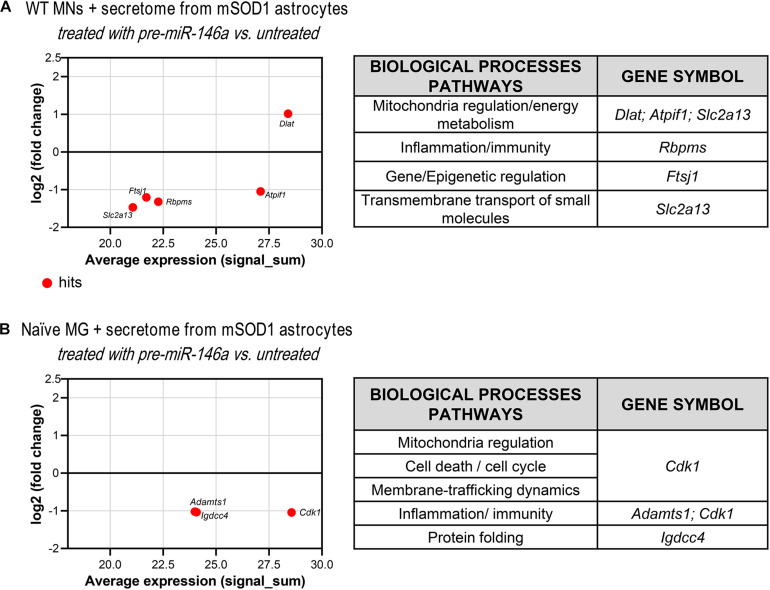
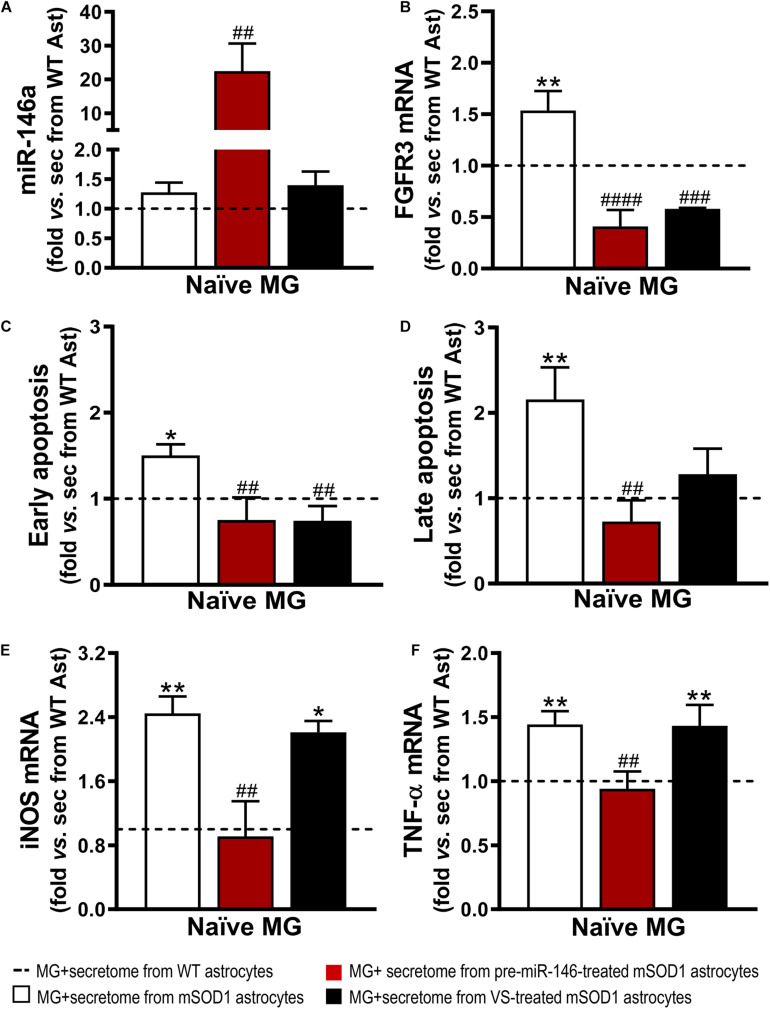
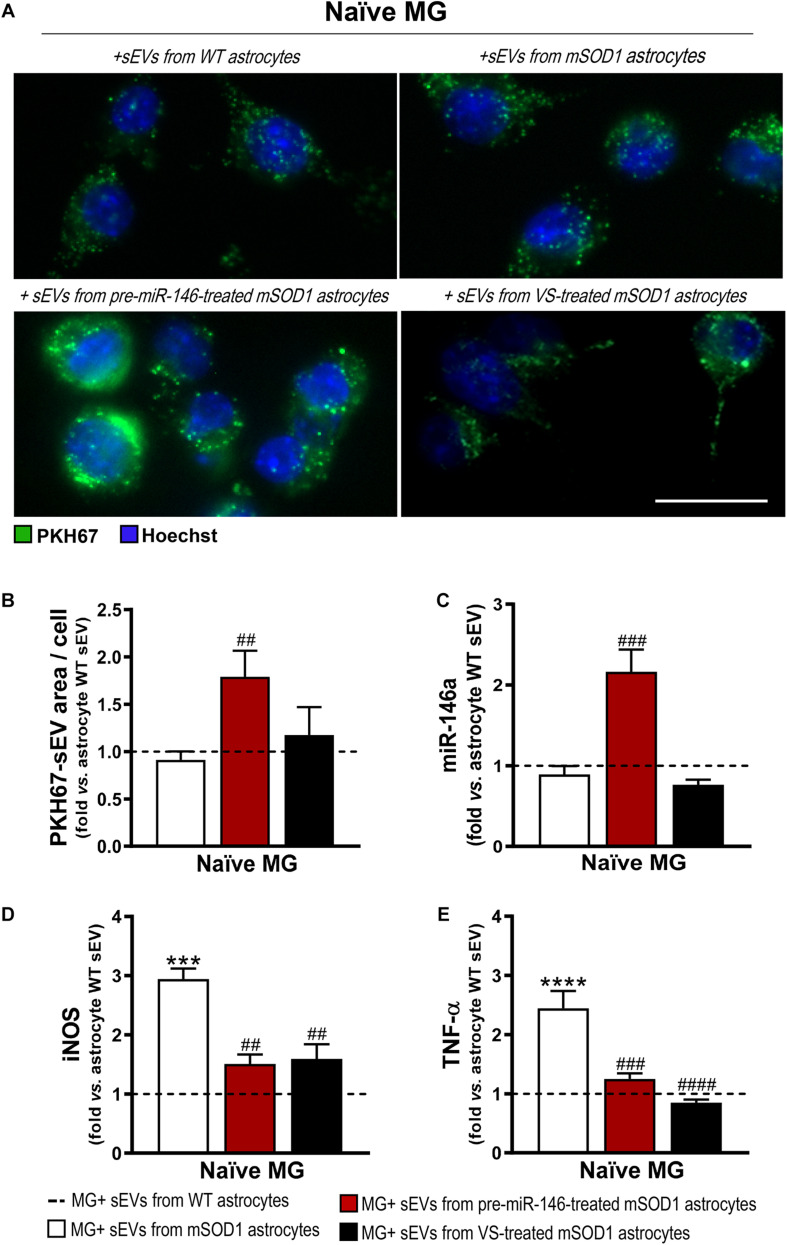
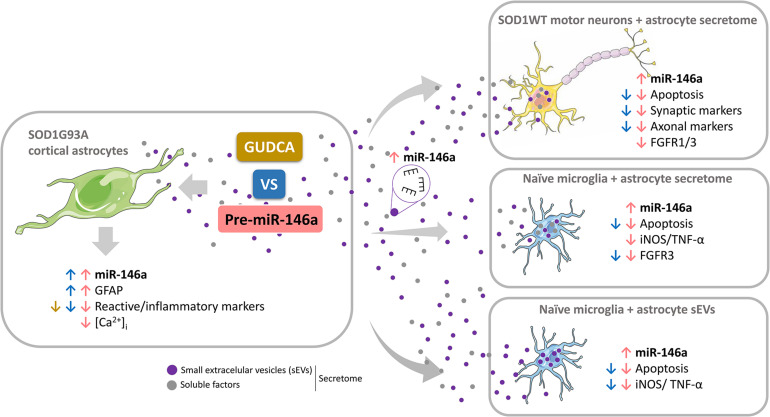
Reactive astrocytes in Amyotrophic Lateral Sclerosis (ALS) change their molecular expression pattern and release toxic factors that contribute to neurodegeneration and microglial activation. We and others identified a dysregulated inflammatory miRNA profile in ALS patients and in mice models suggesting that they represent potential targets for therapeutic intervention. Such cellular miRNAs are known to be released into the secretome and to be carried by small extracellular vesicles (sEVs), which may be harmful to recipient cells. Thus, ALS astrocyte secretome may disrupt cell homeostasis and impact on ALS pathogenesis. Previously, we identified a specific aberrant signature in the cortical brain of symptomatic SOD1-G93A (mSOD1) mice, as well as in astrocytes isolated from the same region of 7-day-old mSOD1 mice, with upregulated S100B/HMGB1/Cx43/vimentin and downregulated GFAP. The presence of downregulated miR-146a on both cases suggests that it can be a promising target for modulation in ALS. Here, we upregulated miR-146a with pre-miR-146a, and tested glycoursodeoxycholic acid (GUDCA) and dipeptidyl vinyl sulfone (VS) for their immunoregulatory properties. VS was more effective in restoring astrocytic miR-146a, GFAP, S100B, HMGB1, Cx43, and vimentin levels than GUDCA, which only recovered Cx43 and vimentin mRNA. The miR-146a inhibitor generated typical ALS aberrancies in wild type astrocytes that were abolished by VS. Similarly, pre-miR-146a transfection into the mSOD1 astrocytes abrogated aberrant markers and intracellular Ca2+ overload. Such treatment counteracted miR-146a depletion in sEVs and led to secretome-mediated miR-146a enhancement in NSC-34-motor neurons (MNs) and N9-microglia. Secretome from mSOD1 astrocytes increased early/late apoptosis and FGFR3 mRNA in MNs and microglia, but not when derived from pre-miR-146a or VS-treated cells. These last strategies prevented the impairment of axonal transport and synaptic dynamics by the pathological secretome, while also averted microglia activation through either secretome, or their isolated sEVs. Proteomic analysis of the target cells indicated that pre-miR-146a regulates mitochondria and inflammation via paracrine signaling. We demonstrate that replenishment of miR-146a in mSOD1 cortical astrocytes with pre-miR-146a or by VS abrogates their phenotypic aberrancies and paracrine deleterious consequences to MNs and microglia. These results propose miR-146a as a new causal and emerging therapeutic target for astrocyte pathogenic processes in ALS.

Keywords: amyotrophic lateral sclerosis; astrocyte-microglia communication; astrocyte-motor neuron crosstalk; calcium signaling aberrancies; glycoursodeoxycholic acid; reactive astrocytes; small extracellular vesicles; vinyl sulfone.


Conflict of interest statement

The authors declare that the research was conducted in the absence of any commercial or financial relationships that could be construed as a potential conflict of interest.

Figures

FIGURE 1
FIGURE 1
mSOD1 astrocytic aberrancies are more efficiently counteracted by VS than by GUDCA. Astrocytes were isolated from the cortex of SOD1-G93A (mSOD1) and wild type (WT) mice pups at 7-day-old and cultured for 13 days in vitro. Treatment with glycoursodeoxycholic acid (GUDCA) or dipeptidyl vinyl sulfone (VS) was performed in mSOD1 astrocytes. RT-qPCR analysis of (A) miRNA(miR)-146a, (B) interleukin-1 receptor associated kinase-1 (IRAK1) and (C) TNF receptor associated factor 6 (TRAF6), (G) vimentin, (H) connexin-43 (Cx43), (I) S100 calcium-binding protein B (S100B) and (J) high mobility group box 1 (HMGB1) was performed. (D) Representative images of astrocytes stained with glial fibrillary acidic protein (GFAP, in green) by immunocytochemistry and (E) quantification of GFAP-positive cells. Cell nuclei were stained with Hoechst dye (blue). (F) GFAP performed by Western blot analysis and the representative results from one blot are shown. Expression of β-actin was used as an endogenous control for Western Blot and RT-qPCR assays. SNORD110 was used as a reference gene for (A) analysis. Results are mean (±SEM) fold change vs. WT astrocytes from at least four independent experiments. *p < 0.05, **p < 0.01, and ***p < 0.001 vs. WT astrocytes; #p < 0.05, ##p < 0.01, ###p < 0.001, and ####p < 0.0001 vs. untreated mSOD1 astrocytes. One-way ANOVA followed by Bonferroni post hoc test was used. Scale bar represents 20 μm.
FIGURE 2
FIGURE 2
miR-146a upregulation successfully recovers GFAP expression and counteracts deregulated reactive markers in mSOD1 astrocytes. Astrocytes were isolated from the cortex of SOD1-G93A (mSOD1) and wild type (WT) mice with 7-day-old and cultured for 13 days in vitro. Transfection with pre-miR-146a was performed in mSOD1 astrocytes. RT-qPCR analysis of (A) miRNA(miR)-146a, (B) interleukin-1 receptor associated kinase-1 (IRAK1) and (C) TNF receptor associated factor 6 (TRAF6), (D) S100 calcium-binding protein B (S100B), (E) connexin-43 (Cx43), (F) vimentin, and (G) high mobility group box 1 (HMGB1) was performed. (H) Representative images of astrocytes stained with glial fibrillary acidic protein (GFAP, in red) by immunocytochemistry and (I) quantification of GFAP-positive cells. Cell nuclei were stained with Hoechst dye (blue). Protein expression of (K) GFAP, (L) S100B, and (M) Cx43 was performed by Western blot analysis and (J) representative results from one blot are shown. Expression of β-actin was used as an endogenous control for Western Blot and RT-qPCR assays. SNORD110 was used as reference gene for (A) analysis. Results are mean (±SEM) fold change vs. WT astrocytes from at least four independent experiments. *p < 0.05 and **p < 0.01 vs. WT astrocytes; #p < 0.05, ##p < 0.01, and ###p < 0.001 vs. untreated mSOD1 astrocytes. One-way ANOVA followed by Bonferroni post hoc test was used. Scale bar represents 20 μm. (N) MA plot (left) was obtained by comparison of the proteomic profiles of pre-miR-146a treated mSOD1 astrocytes and the untreated ones. Here, x axis is the mean log2 intensity (fold change) of each protein between two profiles (A-value) and y axis is the average expression (signal_sum) of protein intensities (M-value). Summary tables (right panels) show the hits and their classification according to biological processes using PANTHER Classification System, as indicated in methods.
FIGURE 3
FIGURE 3
VS rescues GFAP levels and abolishes vimentin- and S100B-associated reactivity induced by the miR-146a inhibitor in WT astrocytes. Astrocytes were isolated from the cortex of wild type (WT) mice with 7-day-old and cultured for 13 days in vitro. Transfection with anti-miR-146a followed by treatment with dipeptidyl vinyl sulfone (VS) was performed in these cells. RT-qPCR analysis of (A) miRNA(miR)-146a, (B) interleukin-1 receptor associated kinase-1 (IRAK1), (C) TNF receptor associated factor 6 (TRAF6), (F) S100 calcium-binding protein B (S100B), (G) vimentin and (H) connexin-43 (Cx43) was performed. SNORD110 was used as reference gene for (A) analysis and β-actin for (B,C,F–H) analysis. (D) Representative images of astrocytes stained with glial fibrillary acidic protein (GFAP, red) in red by immunocytochemistry and (E) respective quantification of the GFAP-positive cells. Cell nuclei were stained with Hoechst dye (blue). Results are mean (±SEM) fold change vs. untreated WT astrocytes from at least three independent experiments. **p < 0.01, ***p < 0.001, and ****p < 0.0001 vs. untreated WT astrocytes; ##p < 0.01, ###p < 0.001, and ####p < 0.0001 vs. WT astrocytes treated with anti-miR-146a. One-way ANOVA followed by Bonferroni post hoc test was used. Scale bar represents 20 μm.
FIGURE 4
FIGURE 4
VS reduces the upregulated intracellular Ca2+, while pre-miR-146a normalizes the number and amplitude of glutamate-induced Ca2+ transients in mSOD1 astrocytes. Astrocytes were isolated from the cortex of SOD1-G93A (mSOD1) and wild type (WT) mice with 7-day-old and cultured for 13 days in vitro. Transfection with pre-miR-146a or treatment with dipeptidyl vinyl sulfone (VS) was performed in mSOD1 astrocytes. Cells were incubated at 37°C for 45 min with the calcium (Ca2+) sensitive fluorescent dye fura-2 acetoxymethyl ester (Fura-2), followed by glutamate addition (100 μM). (A) Pseudocolored Fluo4 fluorescence images in WT, untreated and treated-mSOD1 astrocytes show a prominent rise in intracellular Ca2+ and respective (B) changes in the baseline of Fura-2 fluorescence. The color code refers to the fluorescence ratio 340 nm/380 nm, with higher ratio reflecting higher intracellular Ca2+. (C) Summary plot of the frequency of transients per minute and (D) the amplitude of the Ca2+ responses. Results are mean (±SEM) from at least 40 responsive cells from six independent experiments. Representative profiles of normalized Ca2+ responses of at least 8 cells in (E) WT astrocytes and (F) mSOD1 astrocytes treated with (G) pre-miR-146a and (H) VS. The first 300 s represents the changes of Fura-2 fluorescence in the baseline. The remaining 600 s refers to changes after glutamate addition. **p < 0.01 and ****p < 0.0001 vs. WT astrocytes; ##p < 0.01, ###p < 0.001, and ####p < 0.0001 vs. untreated mSOD1 astrocytes. One-way ANOVA followed by Bonferroni post hoc test was used. Scale bar represents 20 μm.
FIGURE 5
FIGURE 5
sEVs derived from pre-miR-146a-treated mSOD1 astrocytes show enriched content in miR-146a, but not those from VS-treated cells. Astrocytes were isolated from the cortex of SOD1-G93A (mSOD1) and wild type (WT) mice pups at 7-day-old and cultured for 13 days in vitro. Transfection with pre-miR-146a and treatment with dipeptidyl vinyl sulfone (VS) were performed in mSOD1 astrocytes. Small extracellular vesicles (sEVs) were isolated from the secretome of astrocytes by differential ultracentrifugation. (A) Results from one blot shows the expression of sEV markers (Alix and Flotillin-1). (B) Representative images obtained by transmission electron microscopy of sEVs show their cup shape morphology. Results from (C) number of sEVs per cell, (D) concentration (sEVs number/mL), and (E) size distribution derived from Nanoparticle Tracking Analysis using NanoSight. (F,G) RT-qPCR analysis of miRNA(miR)-146a expression in sEVs was performed. Spike and SNORD were used as endogenous controls. Results are mean (±SEM) fold change vs. sEVs-derived WT astrocytes from at least three independent experiments. *p < 0.05 vs. sEVs from WT astrocytes; ##p < 0.01 vs. sEVs from untreated mSOD1 astrocytes. One-way ANOVA followed by Bonferroni post hoc test was used.
FIGURE 6
FIGURE 6
Both VS and pre-miR-146a treatment are effective in restoring the neuroprotective profile of mSOD1 astrocytes but reveal distinct benefits. Astrocytes (Ast) were isolated from the cortex of SOD1-G93A (mSOD1) and wild type (WT) mice with 7-day-old and cultured for 13 days in vitro. Transfection with pre-miR-146a or treatment with dipeptidyl vinyl sulfone (VS) was performed in mSOD1 astrocytes. Cell-derived secretome (sec) was incubated in WT NSC-34 motor neurons (MNs) for 48 h. Analysis of (A) miRNA(miR)-146a, (B) fibroblast growth factor receptor 1 (FGFR1), (C) FGFR3, (F) synaptophysin, (G) post-synaptic protein 95 (PSD95), (H) dynein, and (I) kinesin in WT MNs were assessed by RT-qPCR. SNORD110 was used as reference gene for (A) analysis and β-actin for (B,C,F–I) analysis. (D) Early apoptotic cells (annexin V-PE positive and 7-AA negative) and (E) late apoptotic/necrotic cells (annexin V-PE and 7-AA positive) were assessed by Guava Nexin® Reagent in the WT MNs after secretome interaction. Results are mean (±SEM) fold change vs. MNs + secretome from WT astrocytes from at least three independent experiments. p < 0.05, ∗∗p < 0.01, and **** p < 0.0001 vs. MNs + secretome from WT astrocytes; #p < 0.05, ##p < 0.01, ###p < 0.001, and ####p < 0.0001 vs. MNs + secretome from mSOD1 astrocytes. One-way ANOVA followed by Bonferroni post hoc test was used.
FIGURE 7
FIGURE 7
Proteomic analysis reveals that treatment of mSOD1 astrocytes with pre-miR-146a reverts MN dysfunction and microglia activation by paracrine mediators. Astrocytes were isolated from the cortex of SOD1-G93A (mSOD1) mice with 7-day-old and cultured for 13 days in vitro. Transfection with pre-miR-146a was performed. Cell-derived secretome was added to (A) WT NSC-34 motor neurons (MNs) for 48 h or (B) naïve N9 microglia for 24 h. MA plots (left panels) were obtained by comparison of the proteomic profiles of the treatment with the secretome of pre-miR-146a treated mSOD1 astrocytes and the untreated ones. Here, x axis is the mean log2 intensity (fold change) of each protein between two profiles (A-value) and y axis is the average expression (signal_sum) of protein intensities (M-value). Summary tables (right panels) show the obtained hits and their classification according to biological processes using PANTHER Classification System as indicated in methods.
FIGURE 8
FIGURE 8
Secretome from pre-miR-146a-treated mSOD1 astrocytes translates into microglial miR-146 increase and regulation of cell activation by the untreated secretome, while also prevents cell demise similarly to VS modulation. Astrocytes (Ast) were isolated from the cortex of SOD1-G93A (mSOD1) and wild type (WT) mice with 7-day-old and cultured for 13 days in vitro. Transfection with pre-miR-146a or treatment with dipeptidyl vinyl sulfone (VS) was performed in mSOD1 astrocytes. Secretome was isolated and incubated in naïve N9 microglia for 24 h. Expression of (A) miRNA(miR)-146a, (B) fibroblast growth factor receptor 3 (FGFR3), (E) inducible nitric oxide synthase (iNOS) and (F) tumor necrosis alpha (TNF-α) in microglia was assessed by RT-qPCR. SNORD110 was used as reference gene for (A) analysis and β-actin for (B,E,F) analysis. (C) Early apoptotic (Annexin V-PE positive and 7-AAD negative), and (D) late apoptotic/necrotic cells (Annexin V-PE and 7-AAD positive) were assessed by Guava Nexin® Reagent in the microglia after secretome interaction. Results are mean (±SEM) fold change vs. MG + secretome from WT astrocytes from at least three independent experiments. *p < 0.05 and **p < 0.01 vs. MG + secretome from WT astrocytes; ##p < 0.01, ###p < 0.001, and ####p < 0.0001 vs. MG + secretome from mSOD1 astrocytes. One-way ANOVA followed by Bonferroni post hoc test was used.
FIGURE 9
FIGURE 9
Microglia treated with sEVs from mSOD1 astrocytes modulated with pre-miR-146a or VS show different sEV internalization and miR-146a expression, but similar protection from activation by untreated-sEVs. Astrocytes were isolated from the cortex of SOD1-G93A (mSOD1) and wild type (WT) mice with 7-day-old and cultured for 13 days in vitro. Transfection with pre-miR-146a or VS treatment was performed in mSOD1 astrocytes. Small extracellular vesicles (sEVs) were isolated by differential ultracentrifugation and labeled with PKH67 cell linker, followed by incubation with naïve N9 microglia for 24 h. (A) Representative images of sEVs stained with PKH67 cell linker (green); (B) mean fluorescence area positive for PKH67-sEVs per cell. Cell nuclei were stained with Hoechst dye (blue). Expression of (C) miRNA(miR)-146a, (D) inducible nitric oxide synthase (iNOS) and (E) tumor necrosis alpha (TNF-α) in microglia was assessed by RT-qPCR. SNORD110 was used as reference gene for (C) analysis and β-actin for (D–E) analysis. Results are mean (±SEM) fold change vs. MG + sEVs from WT astrocytes from at least three independent experiments. ***p < 0.001 and ****p < 0.0001 vs. MG + sEVs from WT astrocytes; ##p < 0.01, ###p < 0.001, and ####p < 0.0001 vs. MG + sEVs from mSOD1 astrocytes. One-way ANOVA followed by Bonferroni post hoc test was used. Scale bar represents 20 μm.
FIGURE 10
FIGURE 10
Schematic representation of the efficacy of miR-146a replenishing methods to recover the neuroprotective phenotype of aberrant mSOD1 cortical astrocytes, and in preventing toxic paracrine signaling toward motor neurons and microglia by the mediators released from the pathological astrocytes. Astrocytes were isolated from the cortex of SOD1-G93A (mSOD1) mice pups at 7-day-old and cultured for 13 days in vitro, showing an aberrant/reactive phenotype. Treatment with glycoursodeoxycholic acid (GUDCA) and dipeptidyl vinyl sulfone (VS) abrogated reactive markers, with additional re-establishment of glial fibrillary acidic protein (GFAP) and miR-146a by VS, evidencing their reparative ability. Transfection of mSOD1 astrocytes with pre-miR-146a also attenuated their phenotypic aberrancies and intracellular Ca2+ ([Ca2+]i) overload. Moreover, such treatment increased miR146a content in the cell-derived small extracellular vesicles (sEVs), and mediated miR-146a enrichment in SOD1-WT motor neurons (MNs) and naïve N9 microglial cell. Secretome from mSOD1 astrocytes increased early/late apoptosis and fibroblast growth factor receptor (FGFR) gene levels in MNs and microglia, effects that were prevented by pre-miR-146a or VS modulation. These strategies led to a secretome with preventable properties over the deregulation of synaptic dynamics and axonal transport upon the pathological extracellular milieu from mSOD1 astrocytes. The pre-miR-146a-treated cells also prevented microglia activation through their secretome or isolated sEVs, but in the case of VS only the isolated sEVs showed such property. Data reveal that both pre-miR-146a and VS-mediated miR-146a replenishment in mSOD1 cortical astrocytes are promising approaches to recover the neuroprotective phenotype of ALS cortical astrocytes and the microglia and MN homeostatic balance in the disease. [Ca2+]i, intracellular calcium; GFAP, glial fibrillary acidic protein; FGFR, fibroblast growth factor receptor; GUDCA, glycoursodeoxycholic acid; iNOS, inducible nitric oxide synthase; miR-146a, miRNA-146a; SOD1, superoxide dismutase 1; TNF-α, tumor necrosis alpha; VS, dipeptidyl vinyl sulfone.

Similar articles

Cited by

References

    1. Ajmone-Cat M. A., Onori A., Toselli C., Stronati E., Morlando M., Bozzoni I., et al. (2019). Increased FUS levels in astrocytes leads to astrocyte and microglia activation and neuronal death. Sci. Rep. 9:4572. 10.1038/s41598-019-41040-4 - DOI - PMC - PubMed
    1. Al-Chalabi A., van den Berg L. H., Veldink J. (2017). Gene discovery in amyotrophic lateral sclerosis: implications for clinical management. Nat. Rev. Neurol. 13 96–104. 10.1038/nrneurol.2016.182 - DOI - PubMed
    1. Alexander M., Hu R., Runtsch M. C., Kagele D. A., Mosbruger T. L., Tolmachova T., et al. (2015). Exosome-delivered microRNAs modulate the inflammatory response to endotoxin. Nat. Commun. 6:7321. 10.1038/ncomms8321 - DOI - PMC - PubMed
    1. Almad A. A., Doreswamy A., Gross S. K., Richard J. P., Huo Y., Haughey N., et al. (2016). Connexin 43 in astrocytes contributes to motor neuron toxicity in amyotrophic lateral sclerosis. Glia 64 1154–1169. 10.1002/glia.22989 - DOI - PMC - PubMed
    1. Almad A. A., Taga A., Joseph J., Welsh C., Patankar A., Gross S. K., et al. (2020). Connexin 43 hemichannels mediate spatial and temporal disease spread in ALS. BioRxiv [Preprint]. 10.1101/2020.03.14.990747 - DOI

LinkOut - more resources