. 2021 Apr 22:8:656827.
doi: 10.3389/fmed.2021.656827. eCollection 2021.

Molecular Epidemiology of Salmonellosis in Florida, USA, 2017-2018

Affiliations

Molecular Epidemiology of Salmonellosis in Florida, USA, 2017-2018

Nitya Singh et al. Front Med (Lausanne). .

Abstract

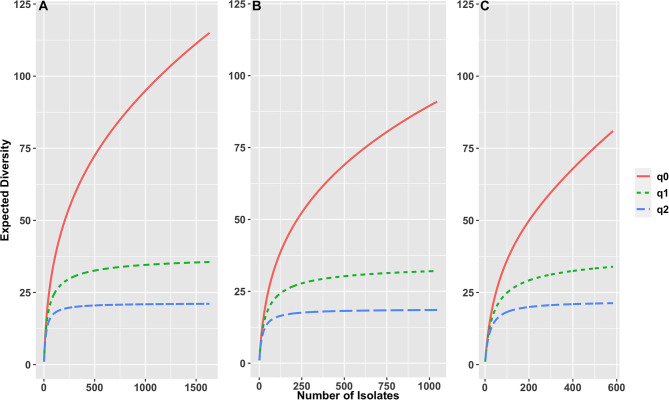
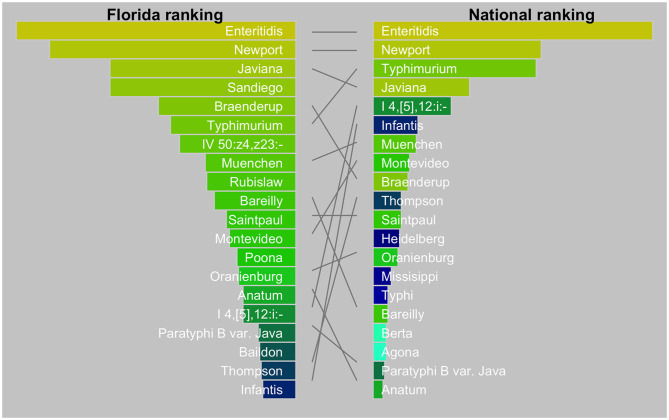
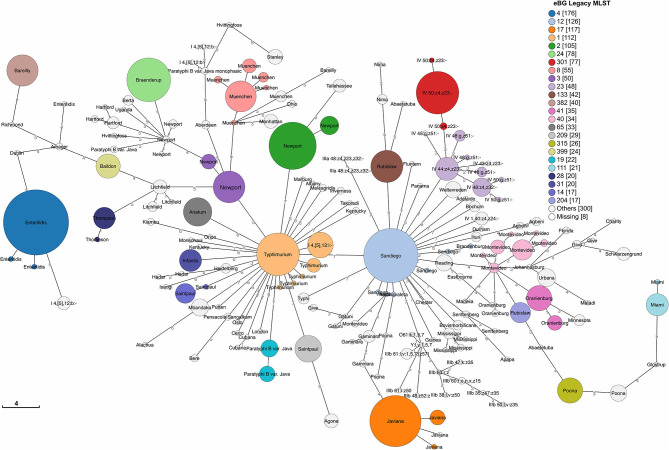
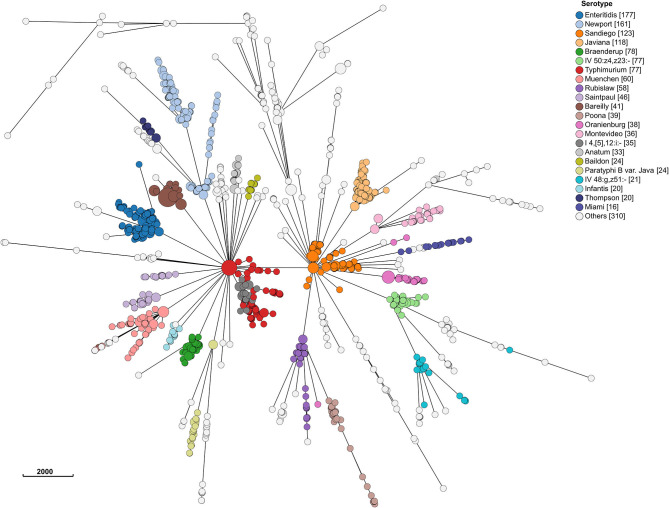
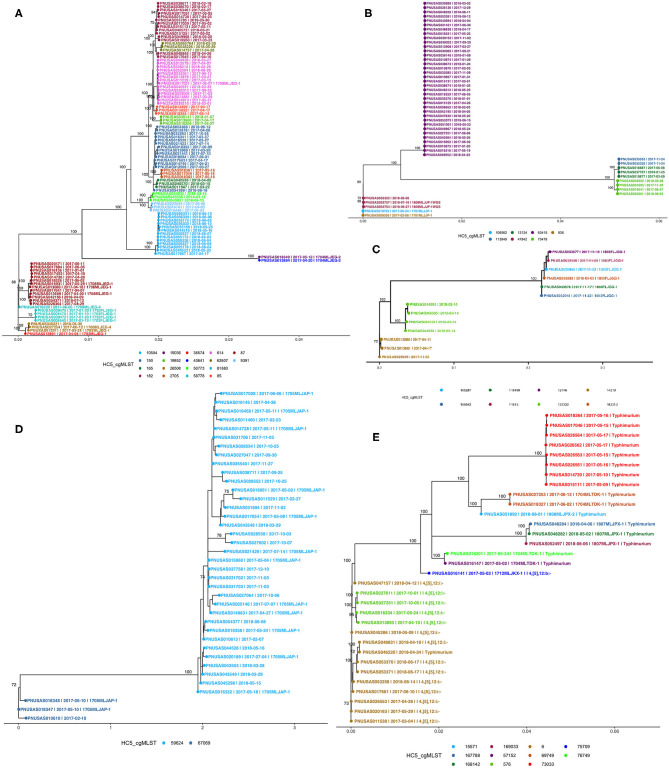
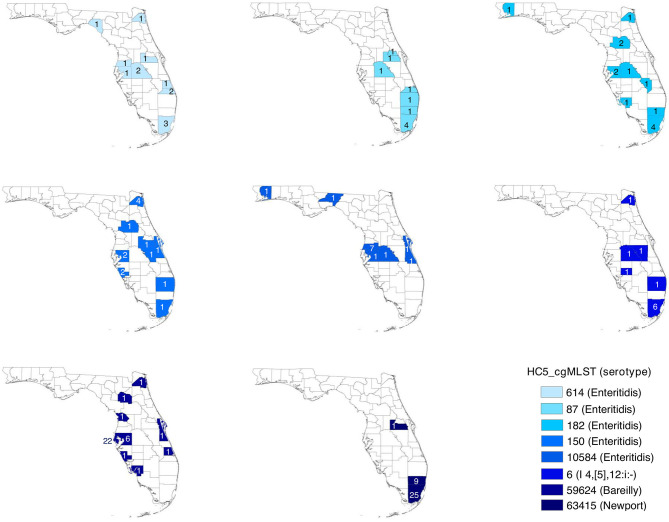
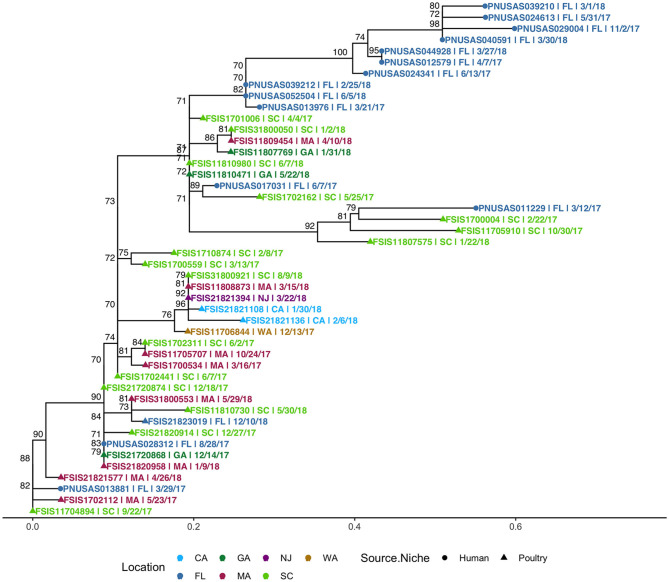
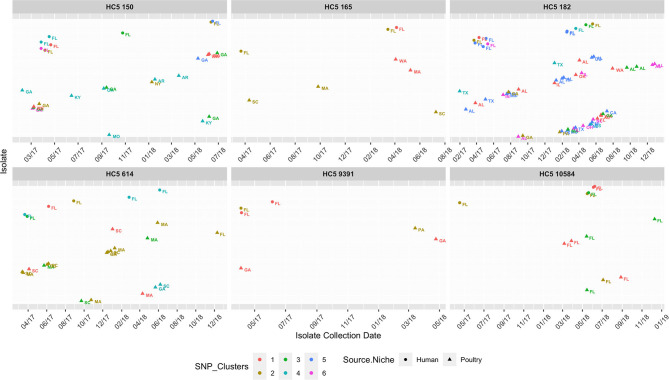
The state of Florida reports a high burden of non-typhoidal Salmonella enterica with approximately two times higher than the national incidence. We retrospectively analyzed the population structure and molecular epidemiology of 1,709 clinical isolates from 2017 and 2018. We found 115 different serotypes. Rarefaction suggested that the serotype richness did not differ between children under 2 years of age and older children and adults and, there are ~22 well-characterized dominant serotypes. There were distinct differences in dominant serotypes between Florida and the USA as a whole, even though S. Enteritidis and S. Newport were the dominant serotypes in Florida and nationally. S. Javiana, S. Sandiego, and S. IV 50:z4, z23:- occurred more frequently in Florida than nationally. Legacy Multi Locus Sequence Typing (MLST) was of limited use for differentiating clinical Salmonella isolates beyond the serotype level. We utilized core genome MLST (cgMLST) hierarchical clusters (HC) to identify potential outbreaks and compared them to outbreaks detected by Pulse Field Gel Electrophoresis (PFGE) surveillance for five dominant serotypes (Enteritidis, Newport, Javiana, Typhimurium, and Bareilly). Single nucleotide polymorphism (SNP) phylogenetic-analysis of cgMLST HC at allelic distance 5 or less (HC5) corroborated PFGE detected outbreaks and generated well-segregated SNP distance-based clades for all studied serotypes. We propose "combination approach" comprising "HC5 clustering," as efficient tool to trigger Salmonella outbreak investigations, and "SNP-based analysis," for higher resolution phylogeny to confirm an outbreak. We also applied this approach to identify case clusters, more distant in time and place than traditional outbreaks but may have been infected from a common source, comparing 176 Florida clinical isolates and 1,341 non-clinical isolates across USA, of most prevalent serotype Enteritidis collected during 2017-2018. Several clusters of closely related isolates (0-4 SNP apart) within HC5 clusters were detected and some included isolates from poultry from different states in the US, spanning time periods over 1 year. Two SNP-clusters within the same HC5 cluster included isolates with the same multidrug-resistant profile from both humans and poultry, supporting the epidemiological link. These clusters likely reflect the vertical transmission of Salmonella clones from higher levels in the breeding pyramid to production flocks.

Keywords: SNP; Salmonella enterica; cgMLST; hierarchical clustering; mlst; outbreak detection; phylogeny; whole genome sequencing.


Conflict of interest statement

The authors declare that the research was conducted in the absence of any commercial or financial relationships that could be construed as a potential conflict of interest.

Figures

Figure 1
Figure 1
Rarefaction curves based on sample size-based diversity accumulation, for (A) 1,632 S. enterica isolates from all ages, (B) 1,155 isolates of age ≥ 2 years, (C) 477 isolates of age < 2 years, from Florida, USA 2017–2018. X-axis shows number of isolates, y axis shows expected diversity using three Hill numbers indicating the total number of serotypes in the set (q = 0), the number of “typical” serotypes (q = 1) and the number of “dominant” serotypes (q = 2).
Figure 2
Figure 2
Tanglegram comparing top 20 Salmonella serotypes in Florida (2017–2018) with the USA (2016). The national data were from the National Enteric Disease Surveillance: Salmonella Annual Report, 2016 (Available at https://www.cdc.gov/nationalsurveillance/pdfs/2016-Salmonella-report-508.pdf) (accessed December 15, 2020). The width of the bars is scaled by the proportion of serotypes among all isolates.
Figure 3
Figure 3
Minimum spanning tree of 1,632 sporadic clinical S. enterica isolates from Florida, USA 2017–2018 based on seven gene (legacy) MLST profiles. Top 24 eBG groups (representing 22 dominant serotypes according to rarefaction analysis) are colored and labeled with dominant serotypes in the eBG. Unlabeled STs groups share the dominant serotype with the adjacent ST in the same eBG. Legend shows number of isolates in corresponding eBG.
Figure 4
Figure 4
Minimum spanning tree of 1,632 sporadic clinical S. enterica isolates from Florida, USA 2017–2018 based on cg MLST profiles. Nodes are colored by dominant serotypes according to rarefaction analysis. Legend shows number of isolates in corresponding serotype.
Figure 5
Figure 5
Phylogenetic trees of Salmonella isolates from five major serotypes in Florida, 2017–2018 from recognized outbreaks or by cgMLST HC5 clusters; (A) S. Enteritidis, (B) S. Newport, (C) S. Javiana, (D) S. Bareilly, (E) S. Typhimurium [including I 4i, [5], 12:i-]. Nodes are labeled with bootstrap support (≥ 70%). Tips are labeled by PNUSA number, isolate date and outbreak code (when available) and are colored by HC5 cluster.
Figure 6
Figure 6
Spatial distribution of prolonged case series of S. enterica in Florida, USA 2017–2018; detected by hierarchical clustering of cgMLST profiles. Counties are colored by HC5 cluster and are labeled with the number of isolates detected in the corresponding county. Zip code information were not available for 5 isolates in 3 HC5 clusters: 1 in 614, 3 in 87, and 1 in 63415.
Figure 7
Figure 7
Phylogenetic tree of S. Enteritidis isolates from clinical and non-clinical (poultry) sources in Florida, collected during 2017–2018, including four cgMLST HC5 clusters with isolates from both sources. Nodes are labeled with bootstrap support (≥70%). Tips are labeled by PNUSA number (clinical isolates, dots), FSIS number (non-clinical isolates, triangles), isolate date and outbreak code (when available), and are colored by HC5 cluster.
Figure 8
Figure 8
Phylogenetic tree of S. Enteritidis isolates clustered in HC5 614 cluster from clinical sources in Florida and non-clinical (poultry) sources in the USA, collected during 2017–2018. Nodes are labeled with bootstrap support (≥70%). Tips are labeled by PNUSA number (clinical isolates, dots), FSIS number (poultry isolates, triangles), USA State of sample collection, and isolate date and are colored by USA State of sample collection; CA, California; GA, Georgia; NJ, New Jersey; WA, Washington; FL-Florida; MA, Massachusetts; SC, South Carolina.
Figure 9
Figure 9
Isolate collection time series (on x-axis for 01/01/2017-12/31/2018) of isolates (y-axis as presence of isolates*), collected from clinical sources in Florida and non-clinical (poultry) sources in the USA, faceted for 8 HC5 clusters, depicting their corresponding SNP clusters (0–4 SNP distance). Isolates are represented as circle (clinical) and triangles (poultry), text labeled by USA State of sample collection and colored by SNP cluster (numbered specific to each HC5 cluster independently). Isolates are spaced along the y-axis and names are dropped for readability.

Similar articles

Cited by

References

    1. Havelaar AH, Kirk MD, Torgerson PR, Gibb HJ, Hald T, Lake RJ, et al. . World Health organization global estimates and regional comparisons of the burden of foodborne disease in 2010. PLoS Med. (2015) 12:e1001923. 10.1371/journal.pmed.1001923 - DOI - PMC - PubMed
    1. Kirk MD, Pires SM, Black RE, Caipo M, Crump JA, Devleesschauwer B, et al. . World Health Organization estimates of the global and regional disease burden of 22 foodborne bacterial, protozoal, and viral diseases, 2010: a data synthesis. PLoS Med. (2015) 12:e1001921. 10.1371/journal.pmed.1001921 - DOI - PMC - PubMed
    1. Scallan E, Hoekstra RM, Angulo FJ, Tauxe RV, Widdowson MA, Roy SL, et al. . Foodborne illness acquired in the United States-Major pathogens. Emerg Infect Dis. (2011) 17:7–15. 10.3201/eid1701.P11101 - DOI - PMC - PubMed
    1. Li X, Singh N, Beshearse E, Blanton JL, DeMent J, Havelaar AH. Spatial epidemiology of Salmonellosis in Florida, 2009–2018. Front Public Health. (2021) 8:1001. 10.3389/fpubh.2020.603005 - DOI - PMC - PubMed
    1. Ribot EM, Hise KB. Future challenges for tracking foodborne diseases: PulseNet, a 20-year-old US surveillance system for foodborne diseases, is expanding both globally and technologically. EMBO Rep. (2016) 17:1499–1505. 10.15252/embr.201643128 - DOI - PMC - PubMed

LinkOut - more resources