. 2021 Apr 8:8:609865.
doi: 10.3389/fmolb.2021.609865. eCollection 2021.

Development and Validation of a Prognostic Gene Signature in Clear Cell Renal Cell Carcinoma

Affiliations

Development and Validation of a Prognostic Gene Signature in Clear Cell Renal Cell Carcinoma

Chuanchuan Zhan et al. Front Mol Biosci. .

Abstract

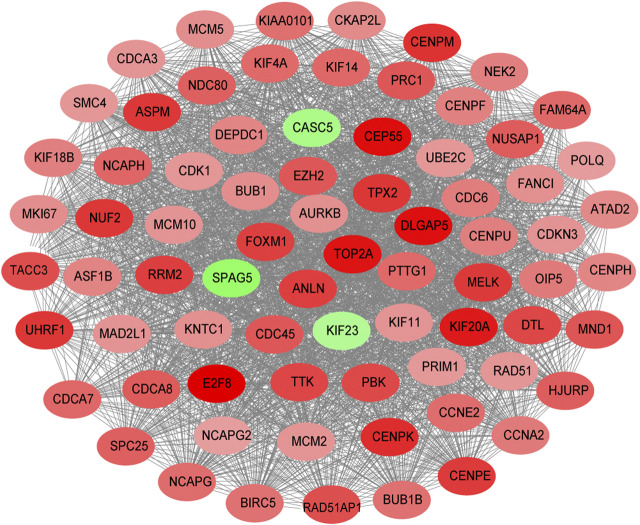
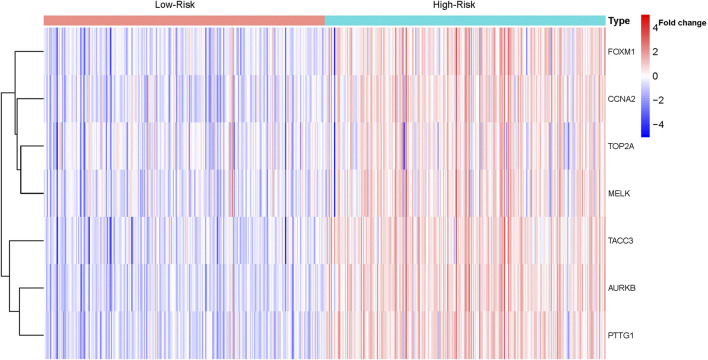
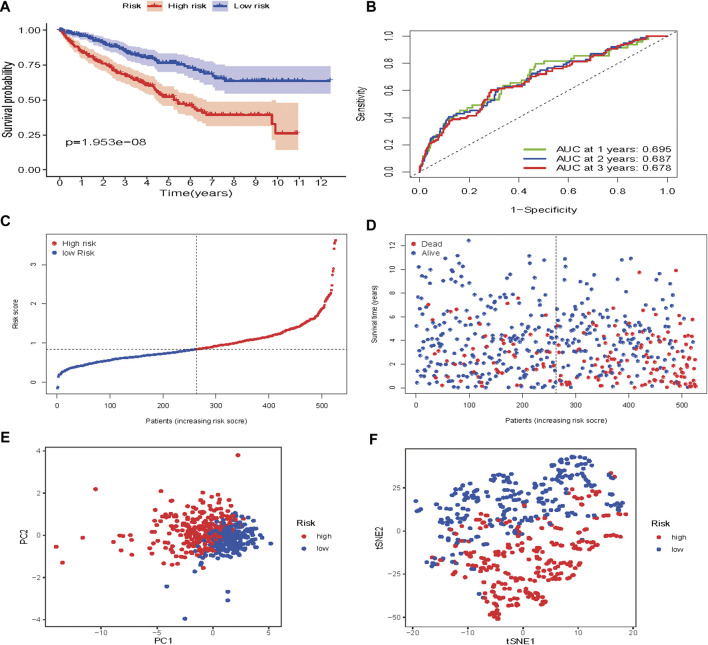
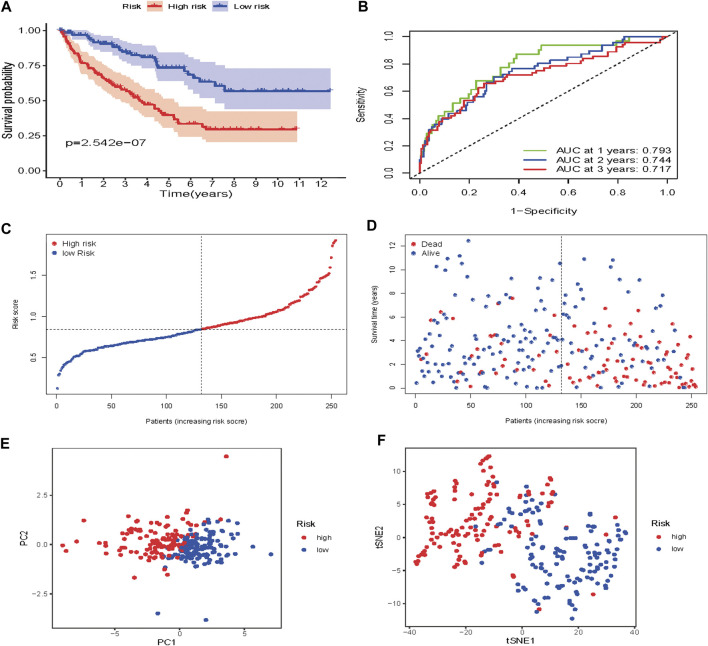
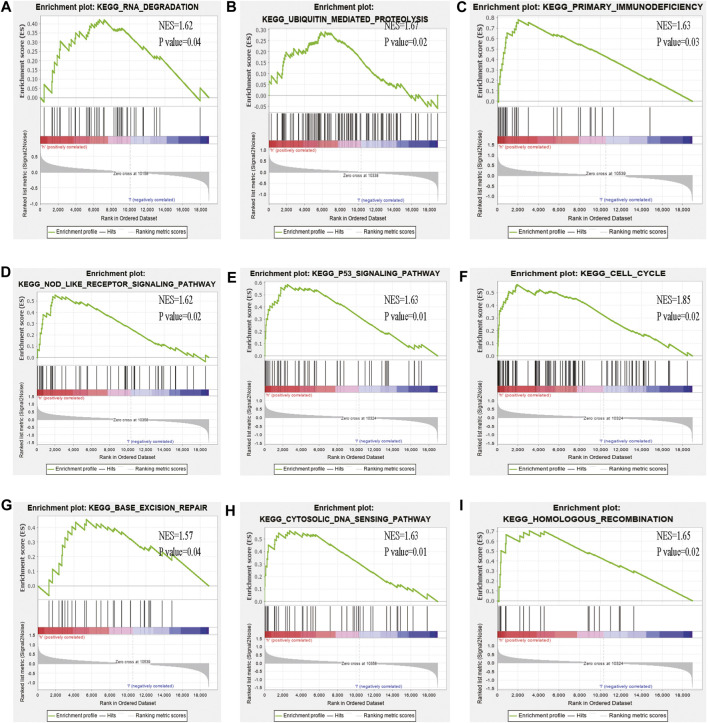
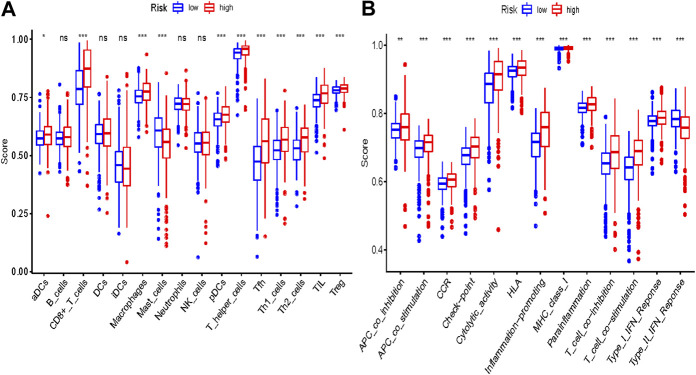
Clear cell renal cell carcinoma (ccRCC), one of the most common urologic cancer types, has a relatively good prognosis. However, clinical diagnoses are mostly done during the medium or late stages, when mortality and recurrence rates are quite high. Therefore, it is important to perform real-time information tracking and dynamic prognosis analysis for these patients. We downloaded the RNA-seq data and corresponding clinical information of ccRCC from The Cancer Genome Atlas (TCGA) and Gene Expression Omnibus (GEO) databases. A total of 3,238 differentially expressed genes were identified between normal and ccRCC tissues. Through a series of Weighted Gene Co-expression Network, overall survival, immunohistochemical and the least absolute shrinkage selection operator (LASSO) analyses, seven prognosis-associated genes (AURKB, FOXM1, PTTG1, TOP2A, TACC3, CCNA2, and MELK) were screened. Their risk score signature was then constructed. Survival analysis showed that high-risk scores exhibited significantly worse overall survival outcomes than low-risk patients. Accuracy of this prognostic signature was confirmed by the receiver operating characteristic curve and was further validated using another cohort. Gene set enrichment analysis showed that some cancer-associated phenotypes were significantly prevalent in the high-risk group. Overall, these findings prove that this risk model can potentially improve individualized diagnostic and therapeutic strategies.

Keywords: WGCNA; kidney cancer; microarray; novel markers; prognostic model; targeting therapy.


Conflict of interest statement

The authors declare that the research was conducted in the absence of any commercial or financial relationships that could be construed as a potential conflict of interest.

Figures

FIGURE 1
FIGURE 1
Flow chart of data collection and analysis.
FIGURE 2
FIGURE 2
Volcano plot of all differentially expressed genes in GSE53757. A total of 1,579 genes were up-regulated while 1,659 genes were down-regulated. Red: up-regulated DEGs; Black: unchanged DEGs; Green: down-regulated DEGs.
FIGURE 3
FIGURE 3
The main steps of WGCNA. Clustering dendrogram of tumor samples with its clinical information. Determination of soft threshold and examination of the scale free topology (β = 8). Hierarchical clustering dendrogram of module eigengenes. Correlation between module and clinical feature, red represents the positive correlation and green represents the negative correlation. The depth of color represents the value of the correlation.
FIGURE 4
FIGURE 4
Composition of the molecular complex.
FIGURE 5
FIGURE 5
GO and KEGG enrichment analyses of red modules (A) Enriched GO terms in Biological processes (BP), Cellular components (CC), and Molecular functions (MF) (B) Significantly enriched KEGG pathways.
FIGURE 6
FIGURE 6
The expression level of ANLN, AURKB, CCNA2, EZH2 in The Human Protein Atlas and its Prognostic value (A) Immunohistochemistry results of ANLN in normal tissues (Staining: Low; Intensity: Weak; Quantity: 75–25%; Location: Nuclear) and in ccRCC tissues (Staining: Medium; Intensity: Strong; Quantity: <25%; Location: Nuclear) (B) Immunohistochemistry results of AURKB in normal tissue (Staining: Not detected; Intensity: Negative; Quantity: None; Location: None) and in ccRCC tissue (Staining: Medium; Intensity: Strong; Quantity: <25%; Location: Nuclear) (C) Immunohistochemistry results of CCNA2 in normal tissues (Staining: Not detected; Intensity: Negative; Quantity: None; Location: None) and in ccRCC tissues (Staining: Medium; Intensity: Strong; Quantity: <25%; Location: Nuclear) (D) Immunohistochemistry results of EZH2 in normal tissues (Staining: Not detected; Intensity: Negative; Quantity: None; Location: None) and in ccRCC tissues (Staining: Low; Intensity: Moderate; Quantity: <25%; Location: Nuclear) (E) Prognostic value of AURKB (F) Prognostic value of AURKB (G) Prognostic value of CCNA2 (H) Prognostic value of EZH2.
FIGURE 7
FIGURE 7
Heatmap of the expression of the seven genes in ccRCC.
FIGURE 8
FIGURE 8
Risk score analysis of the seven-gene prognostic model in TCGA cohort (A) Kaplan-Meier curves for the OS of patients in the high-risk group and low-risk group in the TCGA cohort (B) AUC of time-dependent ROC curves verified the prognostic performance of the risk score in the TCGA cohort (C) Distribution and median value of the risk scores in the TCGA cohort (D) Distributions of OS status, OS and risk score in the TCGA cohort (E) t-SNE analysis of the TCGA cohort (F) PCA plot of the TCGA cohort.
FIGURE 9
FIGURE 9
Risk score analysis of the seven-gene prognostic model in the validation cohort (A) Kaplan-Meier curves for the OS of patients in the high-risk group and low-risk group (B) AUC of time-dependent ROC curves verified the prognostic performance of the risk score model (C) Distribution and median value of the risk scores (D)Distributions of OS status, OS and risk score in the validation cohort (E) t-SNE analysis of the validation cohort (F) PCA plot of in the validation cohort.
FIGURE 10
FIGURE 10
GSEA analysis of the high- and low-risk groups (A–I) Some cancer-related pathways were prevalent in the high-risk group: “Nod like receptor signaling pathway,” “P53 signaling pathway,” “cell cycle,” “homologous recombination,” “base excision repair,” “cytosolic dna sensing pathway,” “ubiquitin mediated proteolysis,” “primary immunodeficiency,” “DNA dergradation,” NES, Normalized enrichment score.
FIGURE 11
FIGURE 11
Comparison of the ssGSEA scores between different risk groups in the TCGA cohort. The scores of 16 immune cells (A) and 13 immune-related functions (B) are displayed in boxplots. Adjusted p values were showed as: ns, not significant; *, p < 0.05; **, p < 0.01; ***, p < 0.001.

Similar articles

Cited by

References

    1. Bader G. D., Hogue C. W. (2003). An automated method for finding molecular complexes in large protein interaction networks. BMC Bioinformatics 4, 2. 10.1186/1471-2105-4-2 - DOI - PMC - PubMed
    1. Banumathy G., Cairns P. (2010). Signaling pathways in renal cell carcinoma. Cancer Biol. Ther. 10, 658–664. 10.4161/cbt.10.7.13247 - DOI - PMC - PubMed
    1. Bao L., Zhao Y., Liu C., Cao Q., Huang Y., Chen K., et al. (2020). The identification of key gene expression signature and biological pathways in metastatic renal cell carcinoma. J. Cancer 11, 1712–1726. 10.7150/jca.38379 - DOI - PMC - PubMed
    1. Delgado J. L., Hsieh C. M., Chan N. L., Hiasa H. (2018). Topoisomerases as anticancer targets. Biochem. J. 475 (2), 373–398. 10.1042/BCJ20160583 - DOI - PMC - PubMed
    1. Gao T., Han Y., Yu L., Ao S., Li Z., Ji J. (2014). CCNA2 is a prognostic biomarker for ER + breast cancer and tamoxifen resistance. PLoS One 9, e91771. 10.1371/journal.pone.0091771 - DOI - PMC - PubMed

LinkOut - more resources