

Long Non-coding RNA DLEU2L Targets miR-210-3p to Suppress Gemcitabine Resistance in Pancreatic Cancer Cells via BRCA2 Regulation
- PMID: 33968986
- PMCID: PMC8100451
- DOI: 10.3389/fmolb.2021.645365
Long Non-coding RNA DLEU2L Targets miR-210-3p to Suppress Gemcitabine Resistance in Pancreatic Cancer Cells via BRCA2 Regulation
Abstract
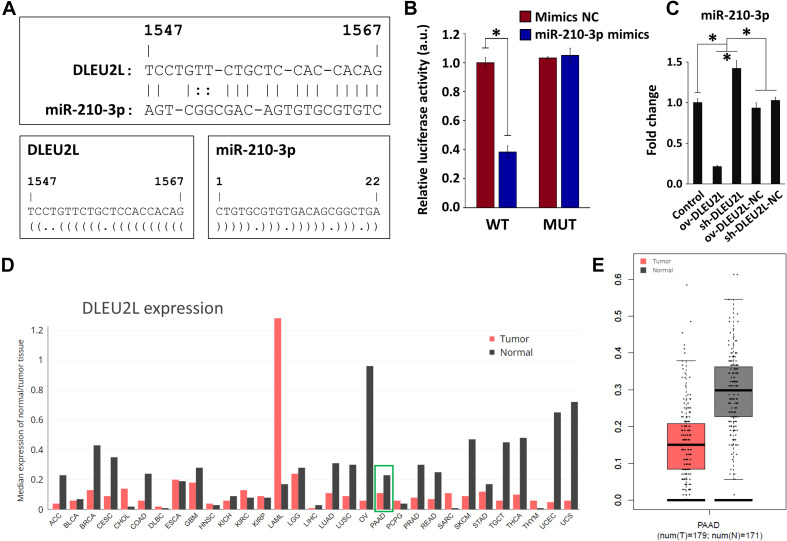
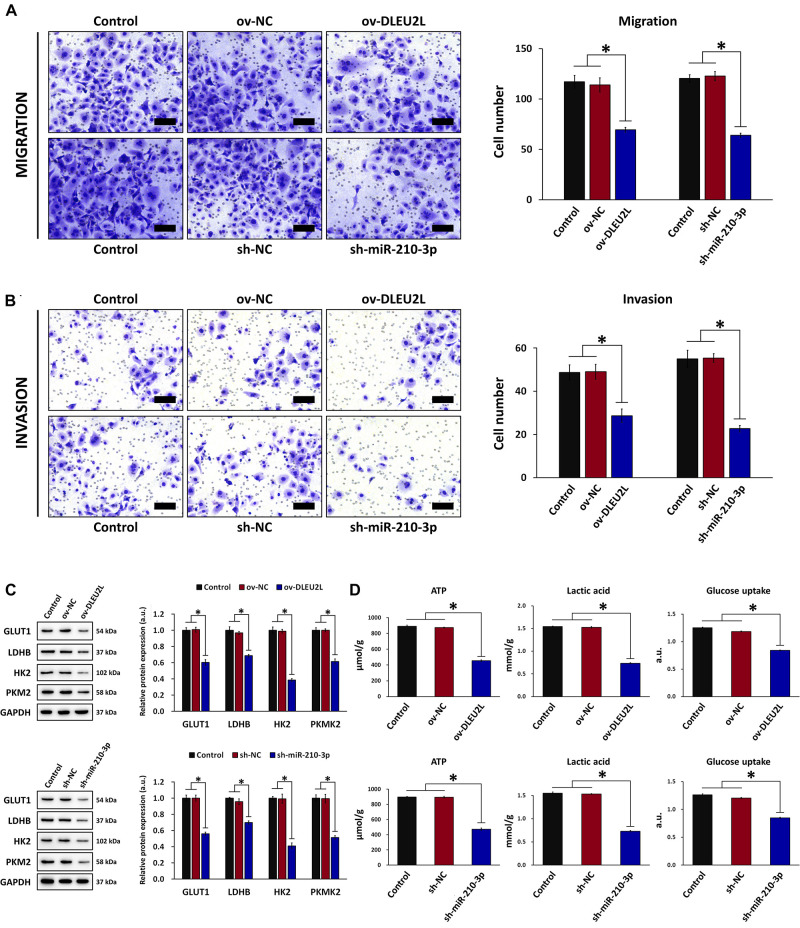
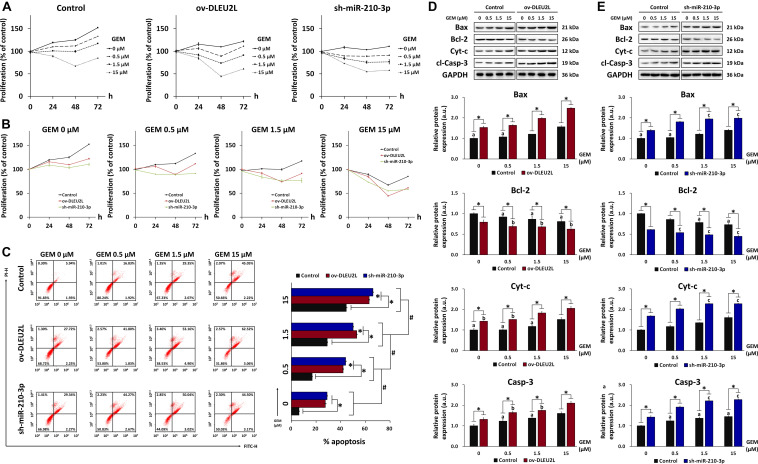
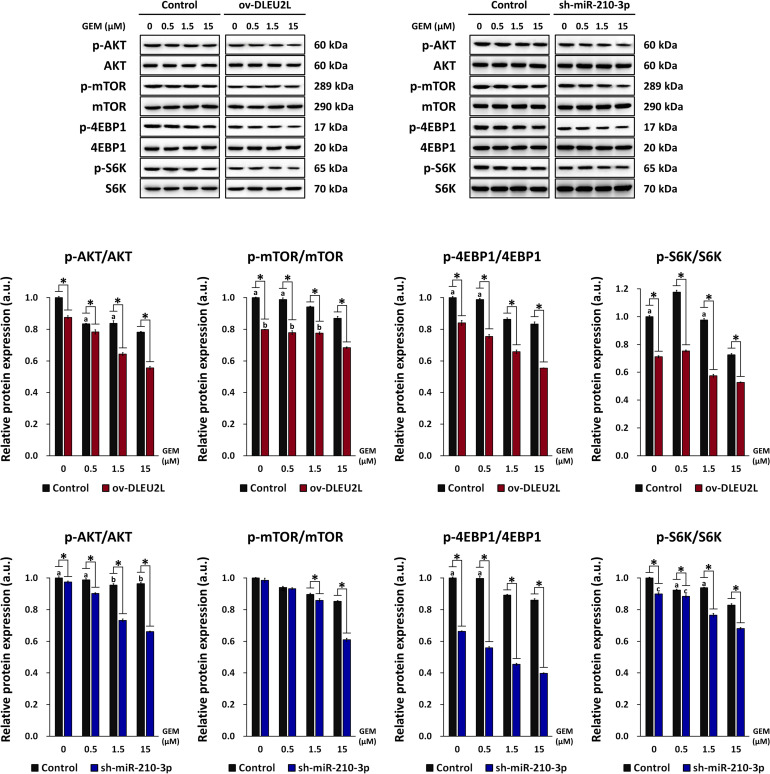
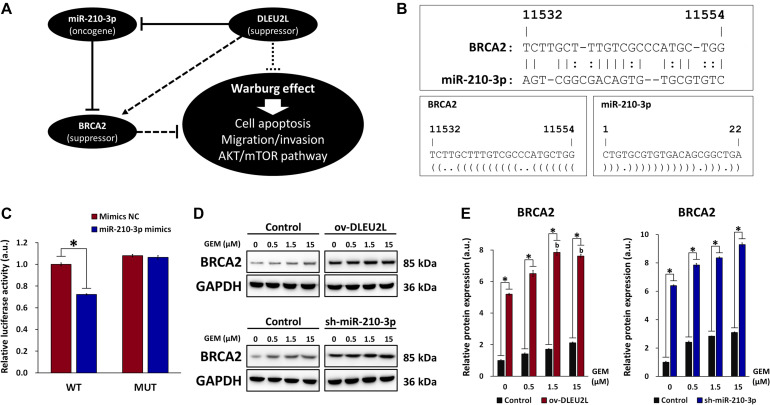
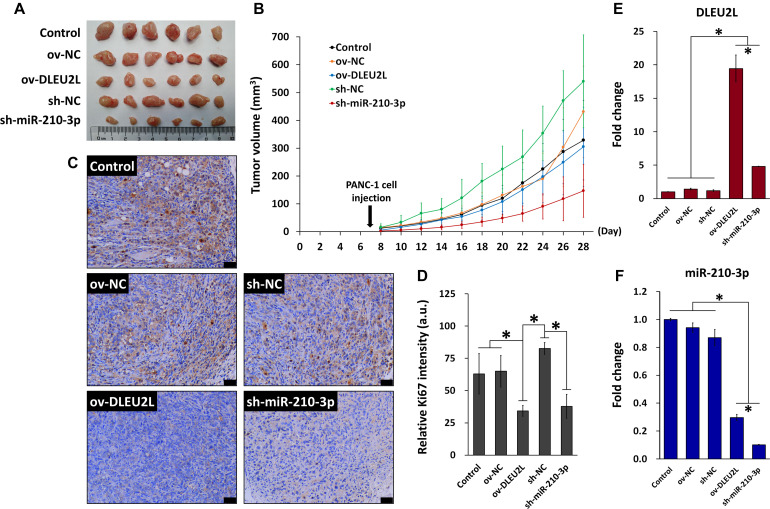
Gemcitabine (GEM) resistance remains a challenging clinical issue to overcome in chemotherapy against pancreatic cancer. We previously demonstrated that miR-210 derived from pancreatic cancer stem cells enhanced the GEM-resistant properties of pancreatic cancer cells, thus identifying miR-210 as an oncogenic miRNA. Herein, we report the existence of an upstream effector that acts as a competing endogenous RNA (ceRNA) to miR-210. Bioinformatic screening was performed to identify lncRNAs with a binding relationship to miR-210. Overexpression and interference vectors were constructed to demonstrate the effect of ceRNA activity in pancreatic cell behavior, both in vitro and in vivo. DLEU2L (deleted in lymphocytic leukemia 2-like), which is expressed at low levels in pancreatic cancer tissues, was shown to exhibit a binding relationship with miR-210-3p. Overexpression of DLEU2L and silencing of miR-210-3p suppressed the proliferation, migration, and invasion of pancreatic cancer cells while promoting apoptosis. These effects occurred via the inhibition of the Warburg effect (aerobic glycolysis) and AKT/mTOR signaling. In addition, we showed that BRCA2 is a target gene of miR-210-3p, and the downregulation of miR-210-3p by DLEU2L effectively induced an upregulation of BRCA2 via the ceRNA mechanism. In vivo, DLEU2L overexpression and miR-210-3p interference suppressed pancreatic tumor progression, consistent with the results of in vitro studies. The findings of our study establish DLEU2L as a ceRNA to miR-210-3p and reveal the critical role of the DLEU2L/miR-210-3p crosstalk in targeting GEM resistance.
Keywords: Warburg effect; cancer metabolism; competing endogenous RNA; drug resistance; lncRNA; microRNA.
Copyright © 2021 Xu, Wu, Xiong and Peng.
Conflict of interest statement
The authors declare that the research was conducted in the absence of any commercial or financial relationships that could be construed as a potential conflict of interest.
Figures
Similar articles
-
Identifying potential therapeutic targets for ischemic stroke through immune infiltration analysis and construction of a programmed cell death‑related ceRNA network.Exp Ther Med. 2022 Sep 21;24(5):680. doi: 10.3892/etm.2022.11616. eCollection 2022 Nov. Exp Ther Med. 2022. PMID: 36185765 Free PMC article.
-
Knockdown of long noncoding RNA PVT1 suppresses cell proliferation and invasion of colorectal cancer via upregulation of microRNA-214-3p.Am J Physiol Gastrointest Liver Physiol. 2019 Aug 1;317(2):G222-G232. doi: 10.1152/ajpgi.00357.2018. Epub 2019 May 24. Am J Physiol Gastrointest Liver Physiol. 2019. PMID: 31125260
-
Long Noncoding RNA HCP5 Regulates Pancreatic Cancer Gemcitabine (GEM) Resistance By Sponging Hsa-miR-214-3p To Target HDGF.Onco Targets Ther. 2019 Oct 4;12:8207-8216. doi: 10.2147/OTT.S222703. eCollection 2019. Onco Targets Ther. 2019. PMID: 31632071 Free PMC article.
-
Long non-coding RNA OIP5-AS1 promotes pancreatic cancer cell growth through sponging miR-342-3p via AKT/ERK signaling pathway.J Physiol Biochem. 2020 May;76(2):301-315. doi: 10.1007/s13105-020-00734-4. Epub 2020 Mar 10. J Physiol Biochem. 2020. PMID: 32157498
-
Inhibition of LINC00994 represses malignant behaviors of pancreatic cancer cells: interacting with miR-765-3p/RUNX2 axis.Cancer Biol Ther. 2019;20(6):799-811. doi: 10.1080/15384047.2018.1564566. Epub 2019 Feb 11. Cancer Biol Ther. 2019. PMID: 30739523 Free PMC article.
Cited by
-
RRP9 promotes gemcitabine resistance in pancreatic cancer via activating AKT signaling pathway.Cell Commun Signal. 2022 Nov 24;20(1):188. doi: 10.1186/s12964-022-00974-5. Cell Commun Signal. 2022. PMID: 36434608 Free PMC article.
-
MicroRNAs and long non-coding RNAs in pancreatic cancer: From epigenetics to potential clinical applications.Transl Oncol. 2023 Jan;27:101579. doi: 10.1016/j.tranon.2022.101579. Epub 2022 Nov 1. Transl Oncol. 2023. PMID: 36332600 Free PMC article.
-
Deciphering the enigma: long noncoding RNAs in disease pathogenesis and therapeutic prospects.Mol Cell Biochem. 2025 Aug 14. doi: 10.1007/s11010-025-05368-y. Online ahead of print. Mol Cell Biochem. 2025. PMID: 40810918 Review.
-
Constructing methylation-driven ceRNA networks unveil tumor heterogeneity and predict patient prognosis.Hum Mol Genet. 2025 Feb 1;34(3):251-264. doi: 10.1093/hmg/ddae176. Hum Mol Genet. 2025. PMID: 39603659 Free PMC article.
-
The role of lncRNA-mediated ceRNA regulatory networks in pancreatic cancer.Cell Death Discov. 2022 Jun 14;8(1):287. doi: 10.1038/s41420-022-01061-x. Cell Death Discov. 2022. PMID: 35697671 Free PMC article. Review.
References
LinkOut - more resources
Full Text Sources
Other Literature Sources
Research Materials
Miscellaneous