. 2021 Apr 22:8:654333.
doi: 10.3389/fmolb.2021.654333. eCollection 2021.

Refinement of α-Synuclein Ensembles Against SAXS Data: Comparison of Force Fields and Methods

Affiliations

Refinement of α-Synuclein Ensembles Against SAXS Data: Comparison of Force Fields and Methods

Mustapha Carab Ahmed et al. Front Mol Biosci. .

Abstract

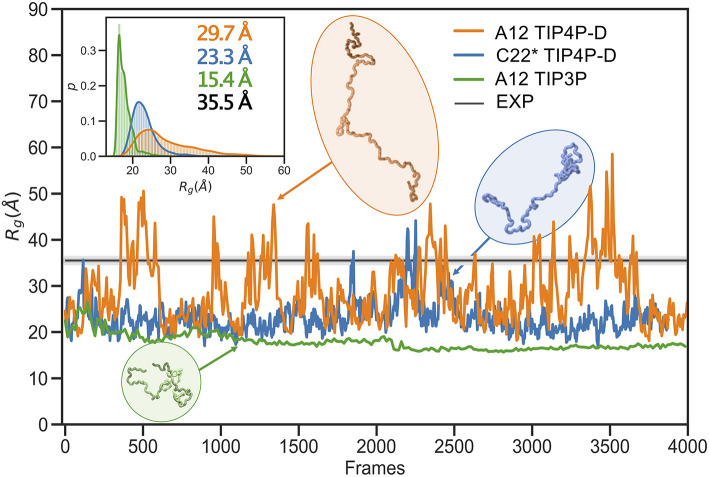
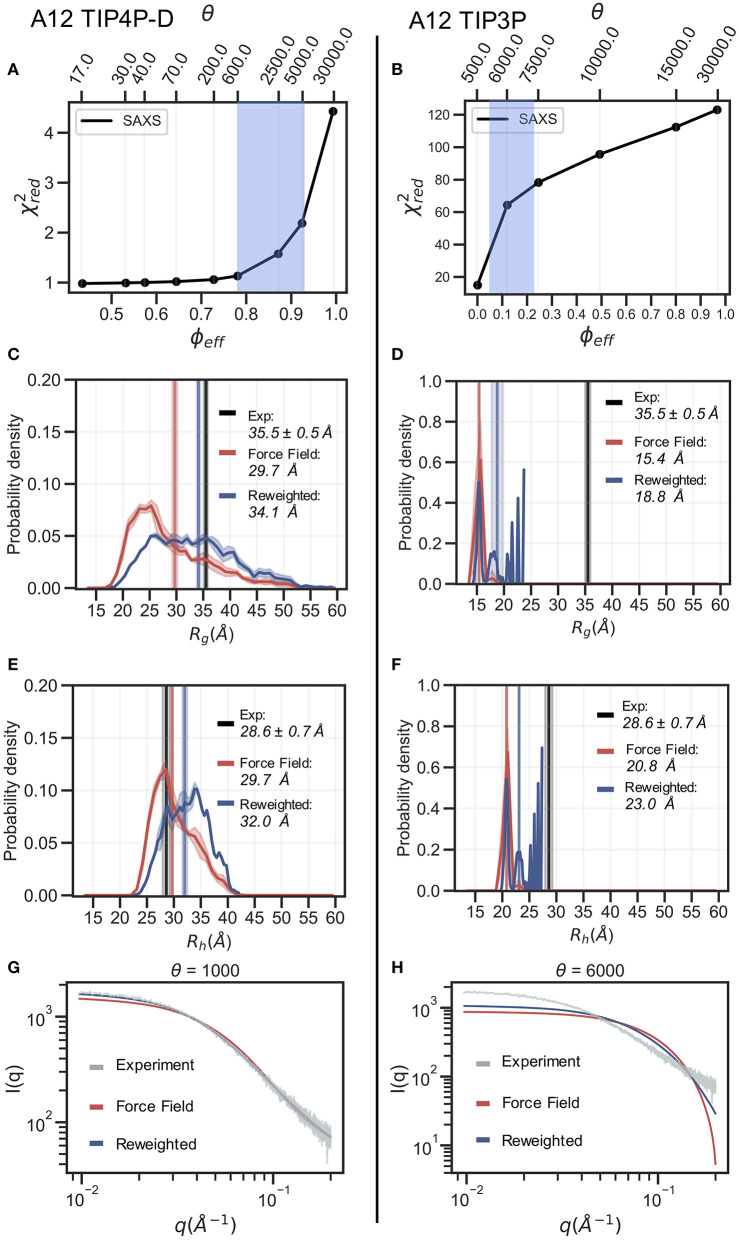
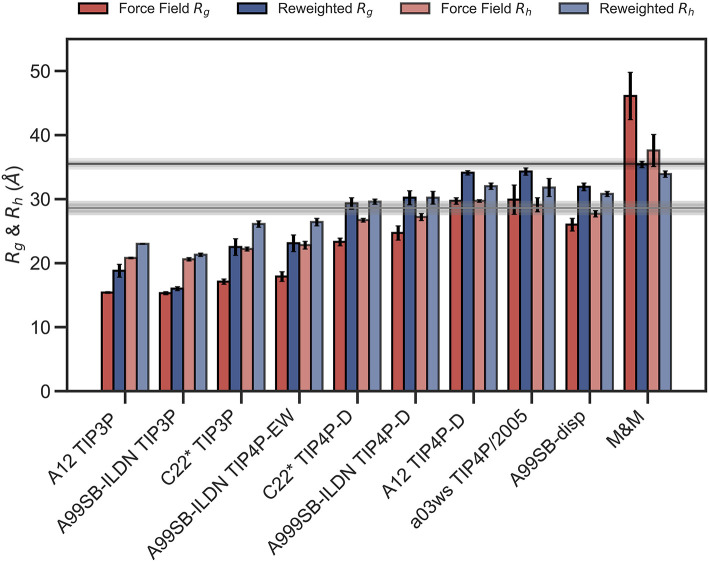
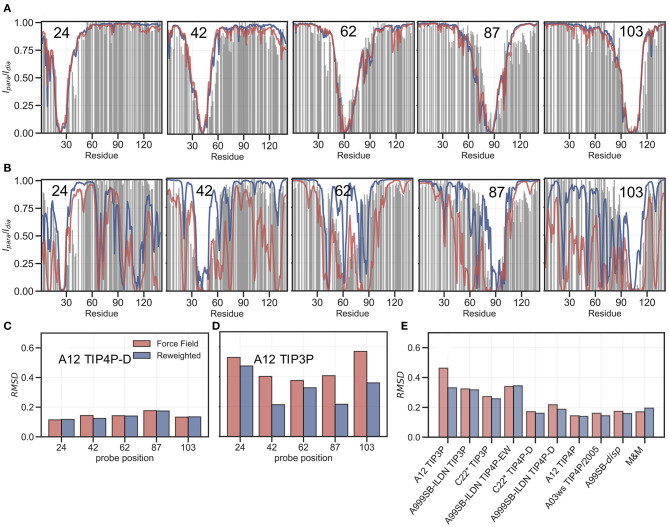
The inherent flexibility of intrinsically disordered proteins (IDPs) makes it difficult to interpret experimental data using structural models. On the other hand, molecular dynamics simulations of IDPs often suffer from force-field inaccuracies, and long simulation times or enhanced sampling methods are needed to obtain converged ensembles. Here, we apply metainference and Bayesian/Maximum Entropy reweighting approaches to integrate prior knowledge of the system with experimental data, while also dealing with various sources of errors and the inherent conformational heterogeneity of IDPs. We have measured new SAXS data on the protein α-synuclein, and integrate this with simulations performed using different force fields. We find that if the force field gives rise to ensembles that are much more compact than what is implied by the SAXS data it is difficult to recover a reasonable ensemble. On the other hand, we show that when the simulated ensemble is reasonable, we can obtain an ensemble that is consistent with the SAXS data, but also with NMR diffusion and paramagnetic relaxation enhancement data.

Keywords: NMR; intrinsically disordered protein; molecular dynamics simulation; protein; small-angle X-ray scattering.


Conflict of interest statement

The authors declare that the research was conducted in the absence of any commercial or financial relationships that could be construed as a potential conflict of interest.

Figures

Figure 1
Figure 1
Radius of gyration during simulations with different force fields and water models. As representative examples we show the time-evolution of the radius of gyration for simulations of αSN performed with the A12 force field (orange), C22* (blue), and A12 (green) with the TIP4P-D, TIP4P-D, and TIP3P water model, respectively. The experimental value (black) was obtained from a Guinier analysis of the SAXS data. The orange and blue curves have been smoothed to ease visualization. The insert shows probability densities and averages of Rg. Representative structures with different degrees of compaction are also shown. The length of the simulations is 11, 20, and 5 μs, respectively, but are shown here on a normalized timescale to make comparisons easier.
Figure 2
Figure 2
Refinement of two ensembles using BME with SAXS data. SAXS refinement of an ensemble sampled with A12 and either (left) the TIP4P-D water model or (right) the TIP3P water model. (A,B) In the L-curve analysis to select the parameter θ we plot χ2 against ϕeff. θ balances the prior (force field) and the experimental data, ϕeff is the effective number of frames used in the final reweighted ensemble. A value of θ is selected from the region marked in blue. We here used θ = 1,000 and θ = 6,000 for the TIP4P-D ensemble and TIP3P ensemble, respectively. Probability distribution of (C,D) Rg and (E,F) Rh for the prior (red) and reweighted (blue) ensembles. Solid vertical lines represent the ensemble averaged Rg and Rh. The experimental values are shown in black. The error of the distributions and on the averages (shown as shades) were estimated by block averaging. (G,H) Calculated SAXS intensities from the prior ensemble and the reweighted ensembles are compared to the experimental SAXS data.
Figure 3
Figure 3
Radius of gyration and hydrodynamic radius calculated from the initial force field ensemble (red) and the experimentally refined ensembles (blue). Experimental values from SAXS (Rg = 35.5Å) and NMR (Rh = 29.0Å) are shown as horizontal lines with the shaded area indicating the error of the experimental values.
Figure 4
Figure 4
Comparing ensembles to PRE data. We calculated the PRE intensity ratios both from the prior (red) and the reweighted (blue) ensembles and compared to the experimental data (gray). As representative examples we again show results with the A12 protein force field combined with either (A) TIP4P-D or (B) TIP3P water models, and where the location of the spin label probe is denoted in each plot. Experimental intensity ratios slightly exceeding the value 1 were set to 1 in these plots. (C,D) We also calculated the RMSD between the experimental and calculated intensity ratios for each probe and the two force fields both before and after reweighting. (E) Finally, we calculated the RMSD between experiment and calculated values over all probe position for and all force fields in Table 1.

References

    1. Abascal J. L., Vega C. (2005). A general purpose model for the condensed phases of water: Tip4p/2005. J. Chem. Phys. 123:234505. 10.1063/1.2121687 - DOI - PubMed
    1. Abraham M. J., Murtola T., Schulz R., Páll S., Smith J. C., Hess B., et al. . (2015). Gromacs: high performance molecular simulations through multi-level parallelism from laptops to supercomputers. SoftwareX 1, 19–25. 10.1016/j.softx.2015.06.001 - DOI
    1. Ahmed M. C., Crehuet R., Lindorff-Larsen K. (2020). Computing, analyzing, and comparing the radius of gyration and hydrodynamic radius in conformational ensembles of intrinsically disordered proteins. Methods Mol. Biol. 2141, 429–445. 10.1007/978-1-0716-0524-0_21 - DOI - PubMed
    1. Barducci A., Bussi G., Parrinello M. (2008). Well-tempered metadynamics: a smoothly converging and tunable free-energy method. Phys. Rev. Lett. 100:020603. 10.1103/PhysRevLett.100.020603 - DOI - PubMed
    1. Bernado P., Svergun D. I. (2012). Structural analysis of intrinsically disordered proteins by small-angle X-ray scattering. Mol. Biosyst. 8, 151–167. 10.1039/C1MB05275F - DOI - PubMed