. 2021 Jun:26:12-23.
doi: 10.1016/j.coisb.2021.03.007. Epub 2021 Mar 26.

The landscape of cell-cell communication through single-cell transcriptomics

Affiliations

The landscape of cell-cell communication through single-cell transcriptomics

Axel A Almet et al. Curr Opin Syst Biol. 2021 Jun.

Abstract

Cell-cell communication is a fundamental process that shapes biological tissue. Historically, studies of cell-cell communication have been feasible for one or two cell types and a few genes. With the emergence of single-cell transcriptomics, we are now able to examine the genetic profiles of individual cells at unprecedented scale and depth. The availability of such data presents an exciting opportunity to construct a more comprehensive description of cell-cell communication. This review discusses the recent explosion of methods that have been developed to infer cell-cell communication from non-spatial and spatial single-cell transcriptomics, two promising technologies which have complementary strengths and limitations. We propose several avenues to propel this rapidly expanding field forward in meaningful ways.


Conflict of interest statement

Declaration of interests The authors declare that they have no known competing financial interests or personal relationships that could have appeared to influence the work reported in this paper.

Figures

Figure 1.
Figure 1.. Principles of cell-cell communication inference.
(a) Cells can secrete ligands that diffuse and can bind to receptors expressed on the surface of nearby cells. This is likelier to occur for receiver cells that are closest to the sender cell and when there is sufficient receptor expression. Cell-cell communication only occurs when the bound ligand triggers a downstream response. The blue and orange cells represent different cell types. For the blue cells, darker shades represent stronger ligand expression. (b) Cell-cell communication can be inferred from scRNA-seq at either the individual cell or cell cluster level, but spatial distances between cells are lost. (c) Using spatial transcriptomics to infer cell-cell communication preserves spatial distances between cells but potentially at the loss of single-cell or gene resolution.
Figure 2.
Figure 2.. Visualization and analysis of cell-cell communication from scRNA-seq data.
(a-e) Common visualization methods for cell-cell communication. (a) Circle plot: Circle size and edge width are proportional to the number of cells in each cell cluster and the communication score between interacting cell clusters, respectively. (b) Chord diagram. (c) Heatmap: Rows and columns represent sources and targets, respectively. Bar plots on the right and top represent the total outgoing and incoming interaction scores respectively. (d) The hierarchical plot consists of two parts: Left and right portions highlight the autocrine and paracrine signaling to clusters A/B/C and to clusters D/E/F, respectively. Solid and open circles represent source and target, respectively. Circle sizes are proportional to the number of cells in each cell group and edge width represents the communication score. (e) Bubble plot shows the ligand-receptor pairs contributing to the signaling from cell cluster A to other clusters. (f-h) Examples of analysis techniques of cell-cell communication from CellChat. (f) Ready identification of major signaling sources and targets using network centrality analysis. For a given cell-cell communication network, the outgoing and incoming centrality scores are computed for each cell cluster and then visualized in a two-dimensional space. Circle size represents the total number of interactions associated with each cell cluster. (g) Alluvial plot shows the correspondence between the inferred latent patterns and cell clusters as well as signaling pathways. These patterns reveal how the cell clusters coordinate with each other as well as how they coordinate with certain signaling pathways. The thickness of the flow indicates the contribution of the cell group or signaling pathway to each latent pattern. (h) CellChat also delineates signaling changes across different contexts by jointly projecting signaling networks from two datasets onto a two-dimensional space, and quantitatively comparing the information flow of each signaling pathway between two datasets. The overall information flow of a signaling network is calculated by summarizing all the communication scores in that network.
Figure 3.
Figure 3.. Integrating scRNA-seq with spatial transcriptomics.
(a) The major tasks involved in integrating scRNA-seq with spatial transcriptomics are: imputing gene expression in spatial data; assigning cell types to spatial data; inferring spatial origins of scRNA-seq data; and estimating spatial interactions in scRNA-seq. (b) The main outputs of current spatial cell-cell communication inference methods include: a cell-cell or cluster-cluster network due to ligand-receptor binding (for a specified signaling pathway) and more general intercellular gene regulatory networks in space.

References

    1. Svensson V, Vento-Tormo R, and Teichmann SA, “Exponential scaling of single-cell RNA-seq in the past decade,” Nat. Protoc, vol. 13, no. 4, pp. 599–604, 2018, doi: 10.1038/nprot.2017.149. - DOI - PubMed
    1. Hie B, Peters J, Nyquist SK, Shalek AK, Berger B, and Bryson BD, “Computational Methods for Single-Cell RNA Sequencing,” Annu. Rev. Biomed. Data Sci, vol. 3, no. 1, pp. 339–364, 2020, doi: 10.1146/annurev-biodatasci-012220-100601. - DOI
    1. Wang S, Karikomi M, Maclean AL, and Nie Q, “Cell lineage and communication network inference via optimization for single-cell transcriptomics,” Nucleic Acids Res, vol. 47, no. 11, pp. 1–13, 2019, doi: 10.1093/nar/gkz204.

      One of the few works to focus specifically on individual cell-cell communication, using a pairwise function based on ligand and receptor expression.
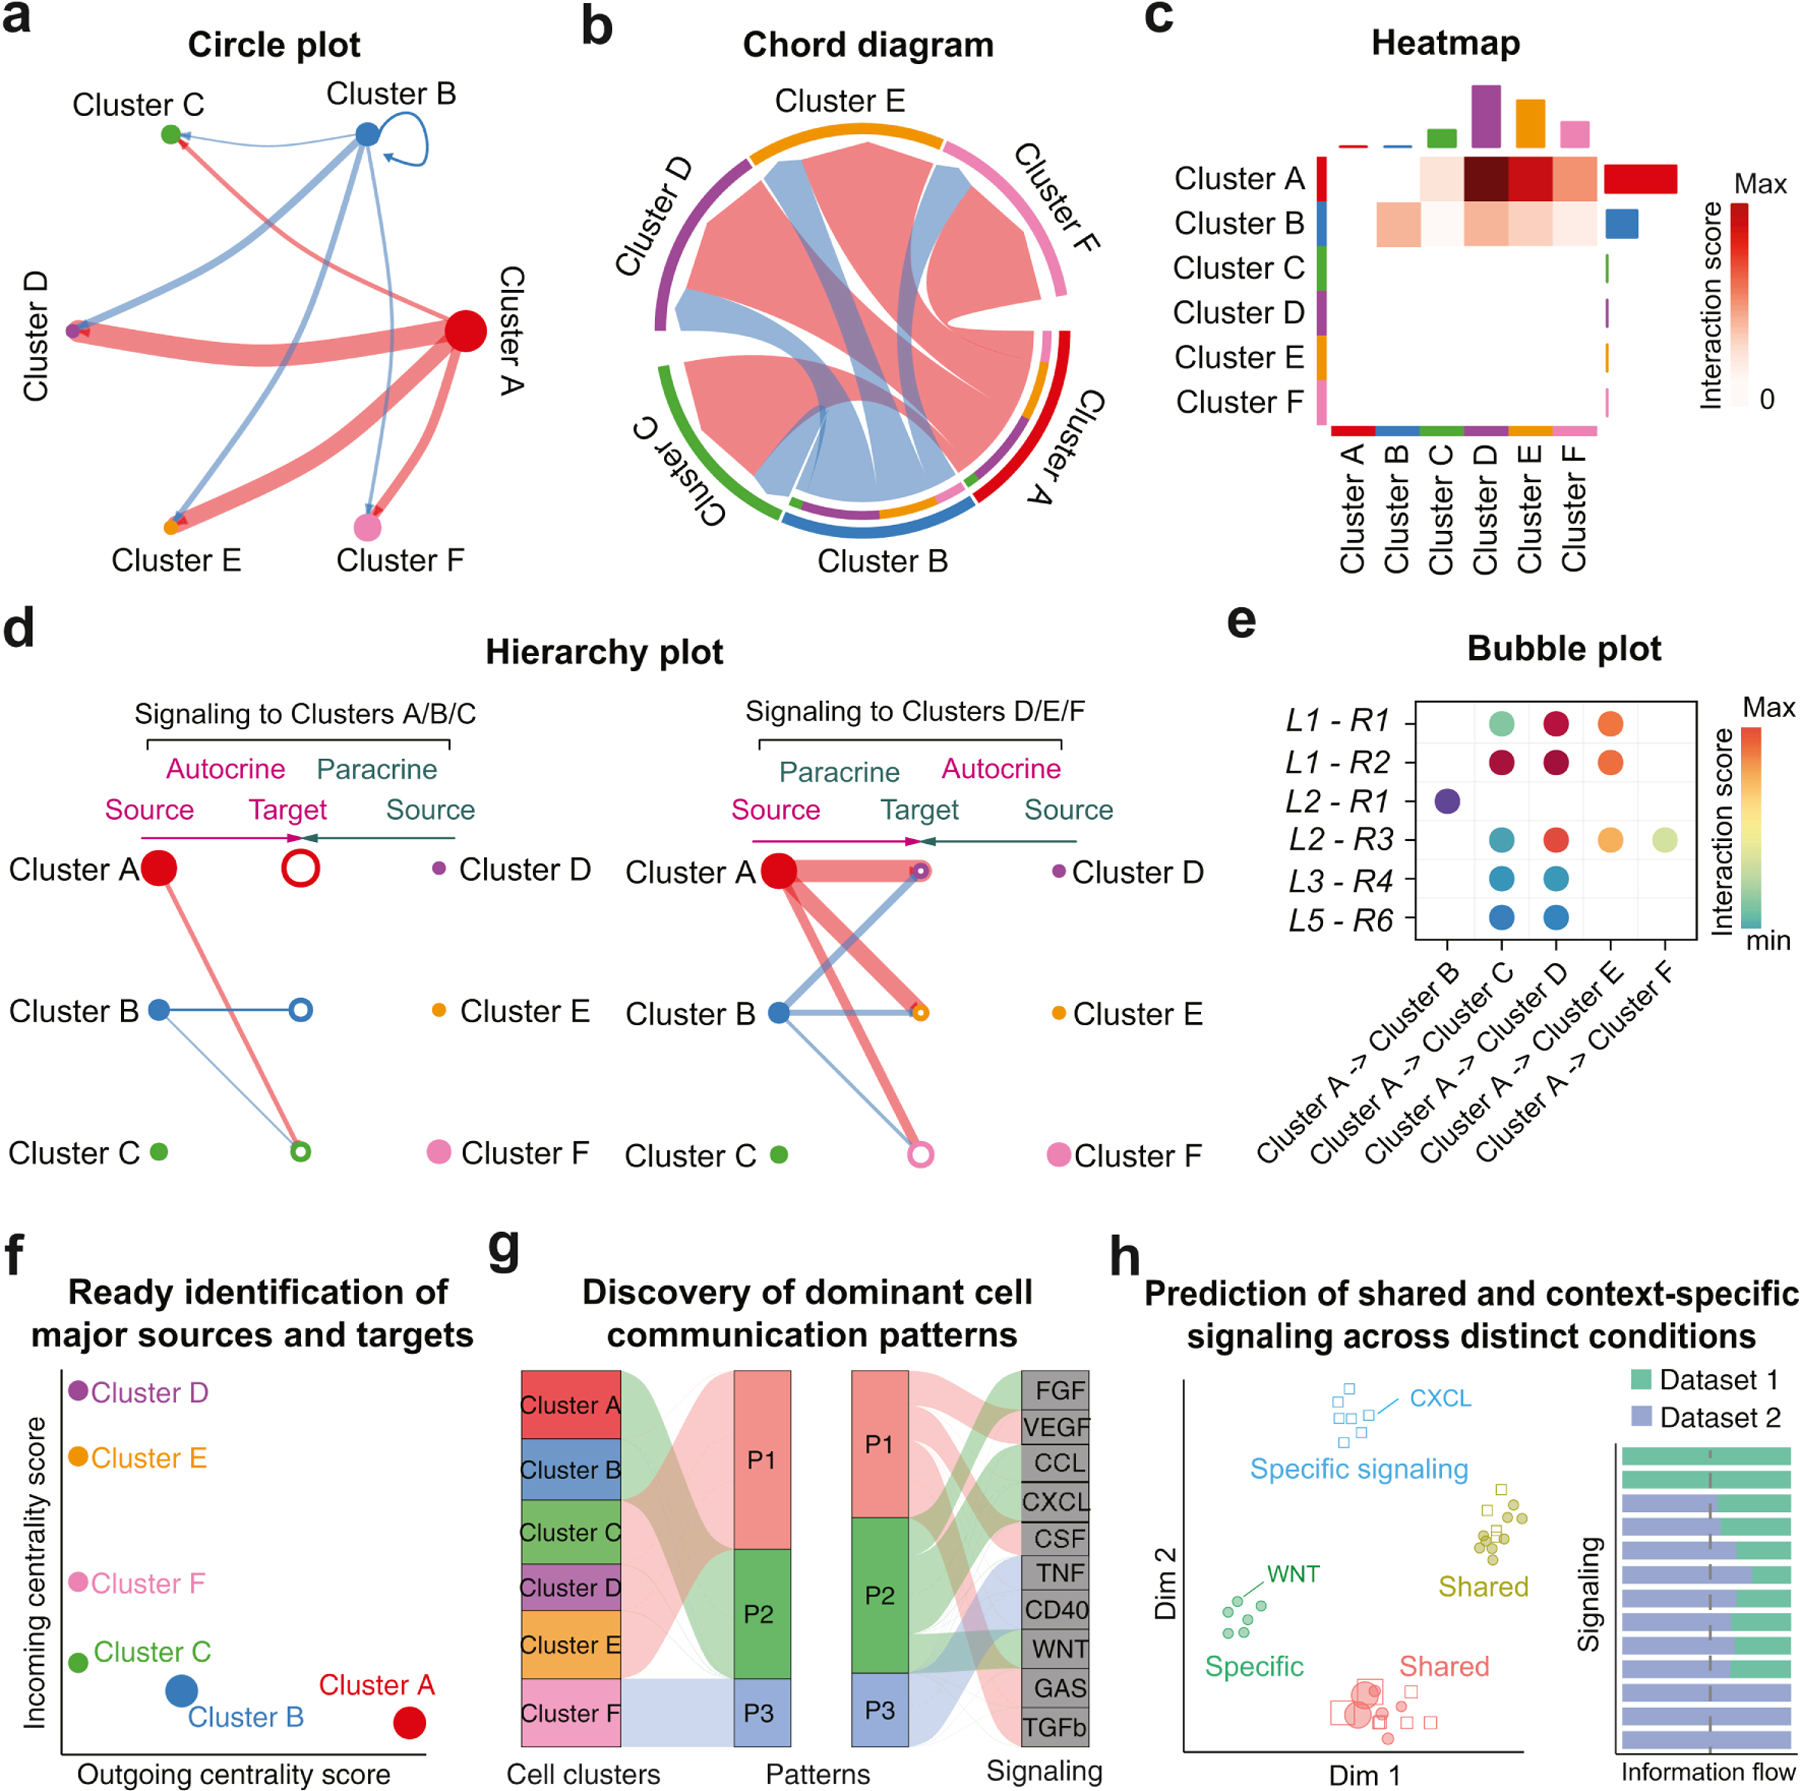
    1. Lewis N, Armingol E, Officer A, and Harismendy O, “Deciphering cell-cell interactions and communication from gene expression,” Nat. Rev. Genet, 2020, doi: 10.1038/s41576-020-00292-x. - DOI - PMC - PubMed
    1. Jin S et al., “Inference and analysis of cell-cell communication using CellChat,” Nat. Commun, no. 2021, pp. 1–20, 2021, doi: 10.1101/2020.07.21.214387.

      State of the art for cell-cell communication visualization and demonstrates how various methods from other fields can be adapted to facilitate the interrogation of complex cell-cell communication methods.