

4D Flow MRI Quantification of Congenital Shunts: Comparison to Invasive Catheterization
- PMID: 33969306
- PMCID: PMC8098085
- DOI: 10.1148/ryct.2021200446
4D Flow MRI Quantification of Congenital Shunts: Comparison to Invasive Catheterization
Abstract
Purpose: To compare invasive right heart catheterization with four-dimensional (4D) flow MRI for estimating shunt fraction in patients with intracardiac and extracardiac shunts.
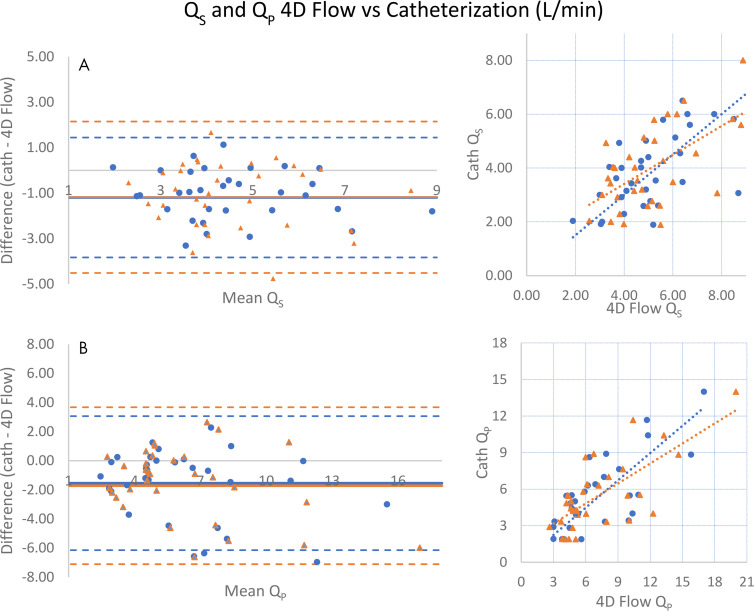
Materials and methods: In this retrospective study, patients who underwent 4D flow MRI and invasive right heart catheterization with a shunt run between August 2015 and November 2018 were included. The primary objective was comparison of estimated shunt fraction (ratio of pulmonary-to-systemic flow, Qp/Qs) at 4D flow and catheterization. Secondary objectives included comparison of the right ventricular-to-left ventricular stroke volume ratio (RVSV/LVSV) to shunt fraction (for those with applicable shunts) and comparison of cardiac output between 4D flow and catheterization. Statistical analysis included Pearson correlation and Bland-Altman plots.
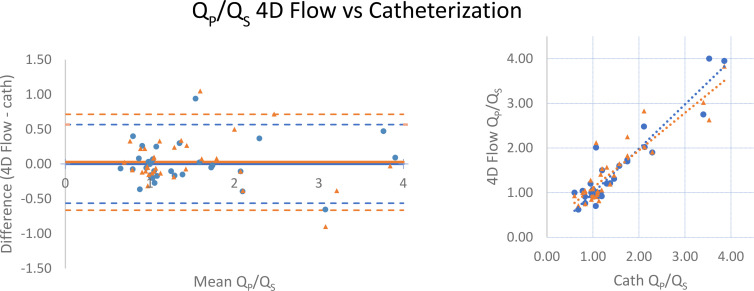
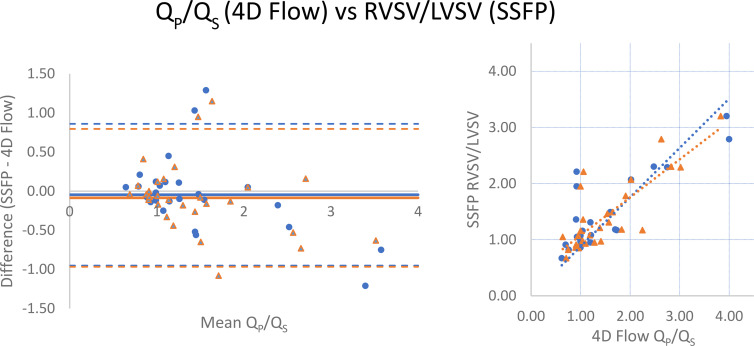
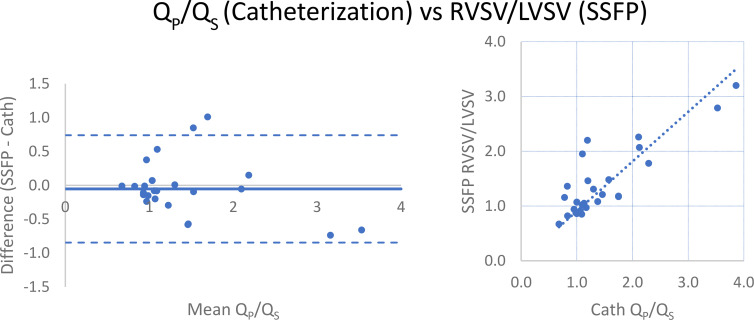
Results: A total of 33 patients met inclusion criteria (mean age, 49 years ± 16 [standard deviation]; 24 women). 4D flow measurements of Qp/Qs strongly correlated with those at catheterization (r = 0.938), and there was no bias. RVSV/LVSV correlated strongly with Qp/Qs from 4D flow (r = 0.852) and catheterization (r = 0.842). Measurements of left ventricle (Qs) and right ventricle (QP) cardiac output from 4D flow and catheterization (Fick) correlated moderately overall (r = 0.673 [Qp] and r = 0.750 [Qs]).
Conclusion: Shunt fraction measurement using 4D flow MRI compares well with that using invasive cardiac catheterization.Supplemental material is available for this article.© RSNA, 2021.
2021 by the Radiological Society of North America, Inc.
Conflict of interest statement
Disclosures of Conflicts of Interest: M.J.H. disclosed no relevant relationships. D.F.K. disclosed no relevant relationships. H.G.E. disclosed no relevant relationships. L.A. disclosed no relevant relationships. S.J.K. Activities related to the present article: disclosed no relevant relationships. Activities not related to the present article: author is deputy editor of Radiology: Cardiothoracic Imaging. Other relationships: disclosed no relevant relationships. A.H. Activities related to the present article: disclosed no relevant relationships. Activities not related to the present article: author is founder, shareholder, and consultant for Arterys; consultant for GE Healthcare; received travel accommodations from GE Healthcare and Arterys; institution received grant from GE Healthcare. Other relationships: institution (Stanford University) has issued and licensed patents; author/institution receives royalties from patents.
Figures
Similar articles
-
Assessment of 4D flow MRI for quantification of left-to-right shunt in pediatric patients with ventricular septal defect: comparison with right heart catheterization.Front Cardiovasc Med. 2024 Jul 22;11:1399110. doi: 10.3389/fcvm.2024.1399110. eCollection 2024. Front Cardiovasc Med. 2024. PMID: 39105074 Free PMC article.
-
Evaluation of Cardiac Shunts With 4D Flow Cardiac Magnetic Resonance: Intra- and Interobserver Variability.J Magn Reson Imaging. 2020 Oct;52(4):1055-1063. doi: 10.1002/jmri.27158. Epub 2020 May 9. J Magn Reson Imaging. 2020. PMID: 32386272
-
4D flow cardiac MRI to assess pulmonary blood flow in patients with pulmonary arterial hypertension associated with congenital heart disease.Diagn Interv Imaging. 2024 Jul-Aug;105(7-8):266-272. doi: 10.1016/j.diii.2024.01.009. Epub 2024 Feb 16. Diagn Interv Imaging. 2024. PMID: 38368175
-
Quantification of left-to-right shunting in adult congenital heart disease: phase-contrast cine MRI compared with invasive oximetry.Br J Radiol. 2009 May;82(977):386-91. doi: 10.1259/bjr/18500608. Epub 2009 Jan 19. Br J Radiol. 2009. PMID: 19153187
-
Cardiac magnetic resonance 'virtual catheterization' for the quantification of valvular regurgitations and cardiac shunt.J Cardiovasc Med (Hagerstown). 2015 Oct;16(10):663-70. doi: 10.2459/JCM.0000000000000245. J Cardiovasc Med (Hagerstown). 2015. PMID: 25643193 Review.
Cited by
-
Technical Recommendations for Computed Tomography Guidance of Intervention in the Right Ventricular Outflow Tract: Native RVOT, Conduits and Bioprosthetic Valves: A White Paper of the Society of Cardiovascular Computed Tomography (SCCT), Congenital Heart Surgeons' Society (CHSS), and Society for Cardiovascular Angiography & Interventions (SCAI).J Soc Cardiovasc Angiogr Interv. 2023 Aug 29;2(6Part A):101117. doi: 10.1016/j.jscai.2023.101117. eCollection 2023 Nov-Dec. J Soc Cardiovasc Angiogr Interv. 2023. PMID: 39129907 Free PMC article.
-
Impact of ferumoxytol vs gadolinium on 4D flow cardiovascular magnetic resonance measurements in small children with congenital heart disease.J Cardiovasc Magn Reson. 2022 Nov 10;24(1):58. doi: 10.1186/s12968-022-00886-w. J Cardiovasc Magn Reson. 2022. PMID: 36352454 Free PMC article.
-
Assessment of 4D flow MRI for quantification of left-to-right shunt in pediatric patients with ventricular septal defect: comparison with right heart catheterization.Front Cardiovasc Med. 2024 Jul 22;11:1399110. doi: 10.3389/fcvm.2024.1399110. eCollection 2024. Front Cardiovasc Med. 2024. PMID: 39105074 Free PMC article.
-
Prevalence of Venovenous Shunting and High-Output State Quantified with 4D Flow MRI in Patients with Fontan Circulation.Radiol Cardiothorac Imaging. 2021 Dec 16;3(6):e210161. doi: 10.1148/ryct.210161. eCollection 2021 Dec. Radiol Cardiothorac Imaging. 2021. PMID: 34934948 Free PMC article.
-
4D-Flow MRI and Vector Ultrasound in the In-Vitro Evaluation of Surgical Aortic Heart Valves - a Pilot Study.J Cardiovasc Transl Res. 2025 Feb;18(1):158-168. doi: 10.1007/s12265-024-10564-0. Epub 2024 Oct 4. J Cardiovasc Transl Res. 2025. PMID: 39365396 Free PMC article.
References
-
- Webb G, Gatzoulis MA. Atrial septal defects in the adult: recent progress and overview. Circulation 2006;114(15):1645–1653. - PubMed
-
- Minette MS, Sahn DJ. Ventricular septal defects. Circulation 2006;114(20):2190–2197. - PubMed
-
- Warnes CA, Williams RG, Bashore TM, et al. . ACC/AHA 2008 Guidelines for the Management of Adults with Congenital Heart Disease: a report of the American College of Cardiology/American Heart Association Task Force on Practice Guidelines (writing committee to develop guidelines on the management of adults with congenital heart disease). Circulation 2008;118(23):e714–e833. - PubMed
-
- Antman EM, Marsh JD, Green LH, Grossman W. Blood oxygen measurements in the assessment of intracardiac left to right shunts: a critical appraisal of methodology. Am J Cardiol 1980;46(2):265–271. - PubMed
-
- Sprung CL, Pozen RG, Rozanski JJ, Pinero JR, Eisler BR, Castellanos A. Advanced ventricular arrhythmias during bedside pulmonary artery catheterization. Am J Med 1982;72(2):203–208. - PubMed
LinkOut - more resources
Full Text Sources
Other Literature Sources
Miscellaneous
