. 2021 Apr 29;3(2):e200564.
doi: 10.1148/ryct.2021200564. eCollection 2021 Apr.

Lung Ultrasound: The Essentials

Affiliations

Lung Ultrasound: The Essentials

Thomas J Marini et al. Radiol Cardiothorac Imaging. .

Abstract

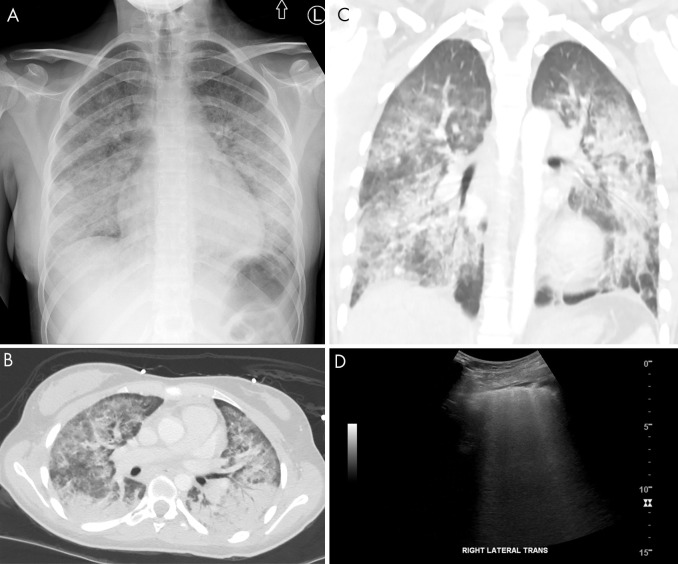
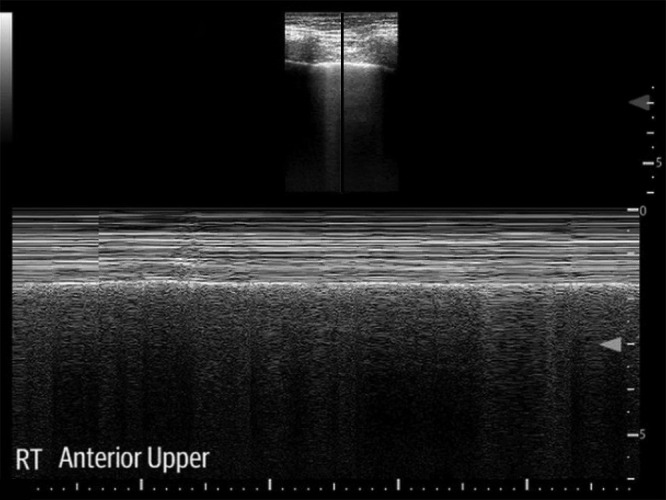
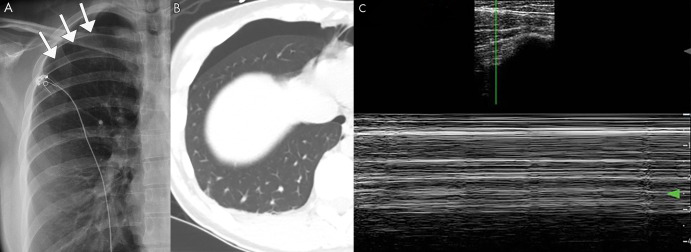
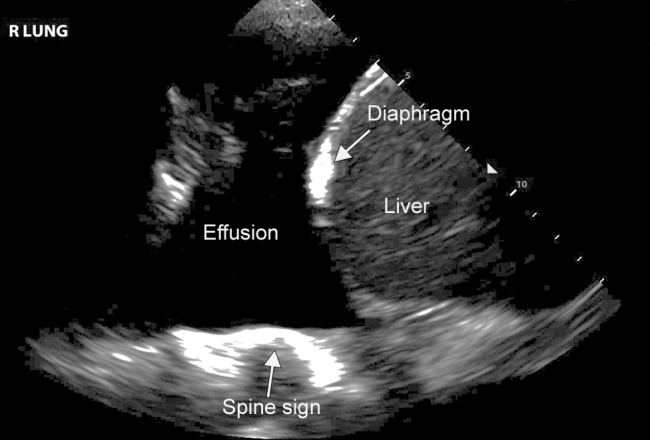
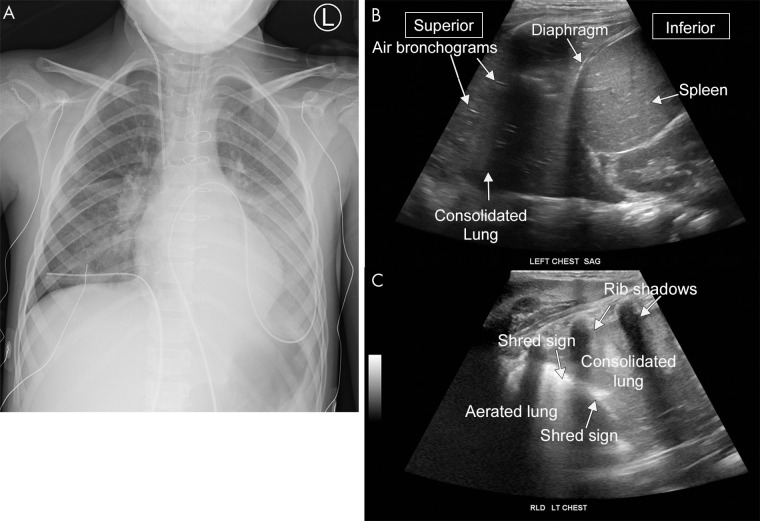
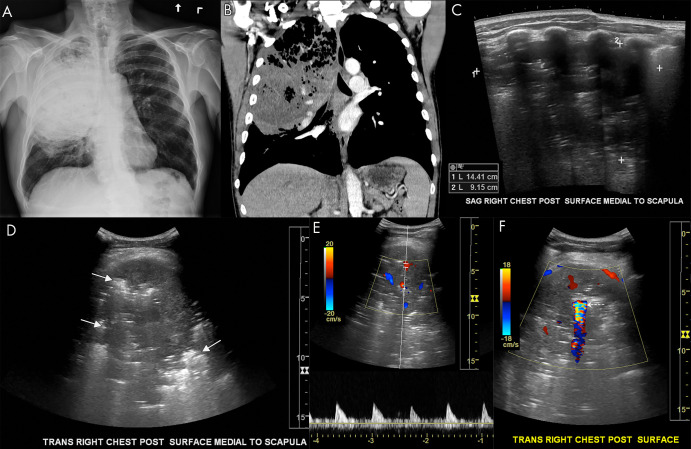
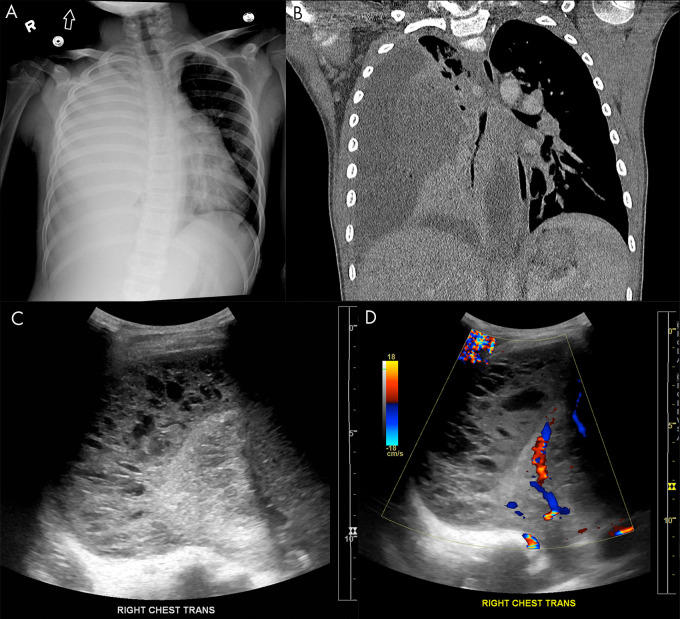
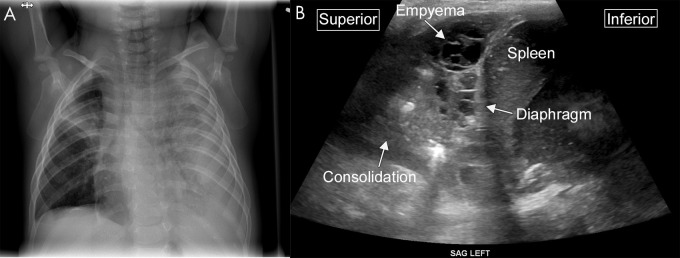
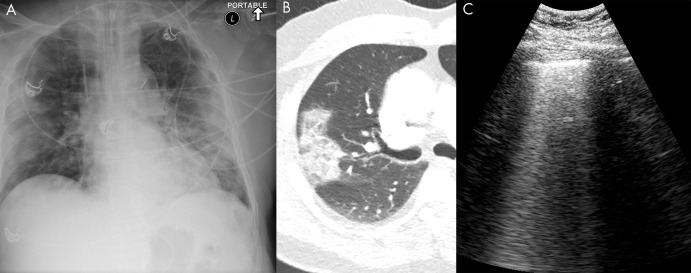
Although US of the lungs is increasingly used clinically, diagnostic radiologists are not routinely trained in its use and interpretation. Lung US is a highly sensitive and specific modality that aids in the evaluation of the lungs for many different abnormalities, including pneumonia, pleural effusion, pulmonary edema, and pneumothorax. This review provides an overview of lung US to equip the diagnostic radiologist with knowledge needed to interpret this increasingly used modality. Supplemental material is available for this article. © RSNA, 2021.


Conflict of interest statement

Disclosures of Conflicts of Interest: T.J.M. disclosed no relevant relationships. D.J.R. disclosed no relevant relationships. Y.T.Z. disclosed no relevant relationships. J.W. disclosed no relevant relationships. T.P.O. disclosed no relevant relationships. W.H.N. disclosed no relevant relationships. K.A.K.J. disclosed no relevant relationships.

Figures

Process of performing lung US. A, Illustration demonstrates basic longitudinal and transverse probe orientations. B, C, A complete lung US examination includes transverse and longitudinal scans through the anterior, lateral, and posterior lungs. AAL = anterior axillary line, PAL = posterior axillary line, PSL = parasternal line, PVL = paravertebral line. (Reprinted, with permission, from University of Rochester, Rochester, New York © 2021; medical illustration by Gwen Mack and Nadezhda D. Kiriyak and photographs by Sarah Klingenberger).
Figure 1:
Process of performing lung US. A, Illustration demonstrates basic longitudinal and transverse probe orientations. B, C, A complete lung US examination includes transverse and longitudinal scans through the anterior, lateral, and posterior lungs. AAL = anterior axillary line, PAL = posterior axillary line, PSL = parasternal line, PVL = paravertebral line. (Reprinted, with permission, from University of Rochester, Rochester, New York © 2021; medical illustration by Gwen Mack and Nadezhda D. Kiriyak and photographs by Sarah Klingenberger).
Physics of lung US. (Left) Ultrasound waves reflected at the pleural line creating A-line reverberation artifacts. (Center) As the interstitium thickens, the artifact pattern changes, with B-line artifacts obliterating A-lines. B-lines are hyperechoic vertical artifacts arising from the pleural line extending to the bottom of the field of view. (Right) Consolidation is directly penetrated by US, resulting in visualization without artifact if the consolidation is touching the pleural line. (Reprinted, with permission, from University of Rochester, Rochester, New York © 2021; medical illustration by Jane Lichorowic).
Figure 2:
Physics of lung US. (Left) Ultrasound waves reflected at the pleural line creating A-line reverberation artifacts. (Center) As the interstitium thickens, the artifact pattern changes, with B-line artifacts obliterating A-lines. B-lines are hyperechoic vertical artifacts arising from the pleural line extending to the bottom of the field of view. (Right) Consolidation is directly penetrated by US, resulting in visualization without artifact if the consolidation is touching the pleural line. (Reprinted, with permission, from University of Rochester, Rochester, New York © 2021; medical illustration by Jane Lichorowic).
Normal lung US anatomy. A, Labeled US image of normal lung in a pediatric patient (scanning performed in the sagittal orientation with a curvilinear abdominal probe). The pleural line is the labeled hyperechoic line that represents the junction of the visceral and the parietal pleura. The A-line artifacts are clearly visualized as horizontal reverberation artifacts of the hyperechoic pleural line. The rib shadows separate the intercostal spaces. B, Labeled US image of normal lung in a neonate (scanning performed in the sagittal orientation at the lower lung). The interface between the liver and lung is clearly visualized. C, Labeled lung image from a lower-end ultrasound machine with a suboptimal acoustic window. Even on such limited examinations, normal A-line artifact can often still be appreciated on careful examination, as seen here. Cine clips show normal lung sliding (Movie 1) and absent lung sliding (Movie 2).
Figure 3:
Normal lung US anatomy. A, Labeled US image of normal lung in a pediatric patient (scanning performed in the sagittal orientation with a curvilinear abdominal probe). The pleural line is the labeled hyperechoic line that represents the junction of the visceral and the parietal pleura. The A-line artifacts are clearly visualized as horizontal reverberation artifacts of the hyperechoic pleural line. The rib shadows separate the intercostal spaces. B, Labeled US image of normal lung in a neonate (scanning performed in the sagittal orientation at the lower lung). The interface between the liver and lung is clearly visualized. C, Labeled lung image from a lower-end ultrasound machine with a suboptimal acoustic window. Even on such limited examinations, normal A-line artifact can often still be appreciated on careful examination, as seen here. Cine clips show normal lung sliding (Movie 1) and absent lung sliding (Movie 2).
Pulmonary edema on lung US. A, Anteroposterior chest radiograph shows nonspecific prominent interstitial markings bilaterally in a 27-year-old man with pulmonary edema. B, Axial and C, coronal CT images show marked bilateral septal thickening, scattered consolidation, and ground-glass opacity. D, Lung US shows B-line artifacts arising from the pleural line and loss of A-lines. Movie 3 shows B-line artifacts in this same patient.
Figure 4:
Pulmonary edema on lung US. A, Anteroposterior chest radiograph shows nonspecific prominent interstitial markings bilaterally in a 27-year-old man with pulmonary edema. B, Axial and C, coronal CT images show marked bilateral septal thickening, scattered consolidation, and ground-glass opacity. D, Lung US shows B-line artifacts arising from the pleural line and loss of A-lines. Movie 3 shows B-line artifacts in this same patient.
Vaping lung injury on lung US. A, Anteroposterior chest radiograph demonstrates nonspecific bilateral interstitial and consolidative pulmonary opacity in a 17-year-old adolescent girl with a vaping-induced lung injury. B, Axial and C, coronal CT images demonstrate diffuse bilateral consolidation, interstitial thickening, and ground-glass opacity. D, Lung US demonstrates loss of A-lines with confluent B-line artifacts better appreciated on the cine clip (Movie 4) Trans = transverse.
Figure 5:
Vaping lung injury on lung US. A, Anteroposterior chest radiograph demonstrates nonspecific bilateral interstitial and consolidative pulmonary opacity in a 17-year-old adolescent girl with a vaping-induced lung injury. B, Axial and C, coronal CT images demonstrate diffuse bilateral consolidation, interstitial thickening, and ground-glass opacity. D, Lung US demonstrates loss of A-lines with confluent B-line artifacts better appreciated on the cine clip (Movie 4) Trans = transverse.
In healthy lung, M-mode US shows the seashore sign in which tissue superficial to the pleural line remains stationary creating smooth horizontal lines, and deep to the pleura, the lung motion interrupts the lines, creating a finely interrupted granular or “sandy” pattern. RT = right.
Figure 6:
In healthy lung, M-mode US shows the seashore sign in which tissue superficial to the pleural line remains stationary creating smooth horizontal lines, and deep to the pleura, the lung motion interrupts the lines, creating a finely interrupted granular or “sandy” pattern. RT = right.
Pneumothorax on lung US. A, Posteroanterior chest radiograph and B, axial CT image of a spontaneous pneumothorax in a 26-year-old patient. C, M-mode US image shows the barcode sign, in which the smooth horizontal lines corresponding to the stationary chest wall are uninterrupted owing to lack of lung sliding, which is diagnostic for pneumothorax. Cine clips show absent lung sliding in the right lung (Movie 5) and the normal lung sliding in the left lung (Movie 6), which cannot be appreciated on still imaging. Arrows indicate location of the pleura in the setting of a pneumothorax.
Figure 7:
Pneumothorax on lung US. A, Posteroanterior chest radiograph and B, axial CT image of a spontaneous pneumothorax in a 26-year-old patient. C, M-mode US image shows the barcode sign, in which the smooth horizontal lines corresponding to the stationary chest wall are uninterrupted owing to lack of lung sliding, which is diagnostic for pneumothorax. Cine clips show absent lung sliding in the right lung (Movie 5) and the normal lung sliding in the left lung (Movie 6), which cannot be appreciated on still imaging. Arrows indicate location of the pleura in the setting of a pneumothorax.
Pleural effusion on lung US. Lung US image of a patient with a moderate-sized pleural effusion. The acoustic window created by the effusion allows visualization of the spine (spine sign), as can be seen in this image. Normally, the vertebral bodies are not apparent on US.
Figure 8:
Pleural effusion on lung US. Lung US image of a patient with a moderate-sized pleural effusion. The acoustic window created by the effusion allows visualization of the spine (spine sign), as can be seen in this image. Normally, the vertebral bodies are not apparent on US.
Pneumonia on lung US. A, Anteroposterior chest radiograph and B, C, US images from a 6-year-old patient with pneumonia. The lower lung on US appears similar in appearance to the liver, representing so-called hepatization of the pulmonary parenchyma consistent with consolidation. B, The hyperechoic foci within the consolidation are air bronchograms. C, The shred sign is the irregular hyperechoic line separating the consolidated and aerated lung. A sagittal cine clip (Movie 7) and a transverse cine clip (Movie 8) show more detail. LT = left, RLD = right lateral decubitus.
Figure 9:
Pneumonia on lung US. A, Anteroposterior chest radiograph and B, C, US images from a 6-year-old patient with pneumonia. The lower lung on US appears similar in appearance to the liver, representing so-called hepatization of the pulmonary parenchyma consistent with consolidation. B, The hyperechoic foci within the consolidation are air bronchograms. C, The shred sign is the irregular hyperechoic line separating the consolidated and aerated lung. A sagittal cine clip (Movie 7) and a transverse cine clip (Movie 8) show more detail. LT = left, RLD = right lateral decubitus.
Pulmonary abscess on lung US. A, Anteroposterior chest radiograph and B, coronal chest CT image show a large pulmonary abscess in the right upper lung containing foci of air in a 56-year-old smoker. C, Sagittal and D, transverse grayscale US images demonstrate a large 14-cm abscess. Hyperechoic foci are seen throughout the abscess corresponding to air (arrows, D). E, F, Associated color Doppler images show internal Doppler flow consistent with abscess. There is a large focus of twinkle artifact corresponding to air within the abscess (dashed arrow, F).
Figure 10:
Pulmonary abscess on lung US. A, Anteroposterior chest radiograph and B, coronal chest CT image show a large pulmonary abscess in the right upper lung containing foci of air in a 56-year-old smoker. C, Sagittal and D, transverse grayscale US images demonstrate a large 14-cm abscess. Hyperechoic foci are seen throughout the abscess corresponding to air (arrows, D). E, F, Associated color Doppler images show internal Doppler flow consistent with abscess. There is a large focus of twinkle artifact corresponding to air within the abscess (dashed arrow, F).
Empyema on lung US. A, Anteroposterior chest radiograph and B, coronal chest CT image show a large, right-sided empyema occupying the pleural space with associated compression of the pulmonary parenchyma in a 9-year-old boy. Lung US C, grayscale and D, Doppler images demonstrate a multiloculated complex-appearing fluid collection in the pleural space with septations and internal debris without internal color flow.
Figure 11:
Empyema on lung US. A, Anteroposterior chest radiograph and B, coronal chest CT image show a large, right-sided empyema occupying the pleural space with associated compression of the pulmonary parenchyma in a 9-year-old boy. Lung US C, grayscale and D, Doppler images demonstrate a multiloculated complex-appearing fluid collection in the pleural space with septations and internal debris without internal color flow.
Complex collection on lung US. A, Anteroposterior chest radiograph demonstrates near complete opacification of the left hemithorax, with loculated pleural fluid tracking along the left lateral chest wall in an 8-month-old male infant. In addition, a focal consolidation is present in the right upper lobe. B, Sagittal US image from the same patient shows consolidation within the lung and a multiseptated complex pleural fluid collection consistent with empyema.
Figure 12:
Complex collection on lung US. A, Anteroposterior chest radiograph demonstrates near complete opacification of the left hemithorax, with loculated pleural fluid tracking along the left lateral chest wall in an 8-month-old male infant. In addition, a focal consolidation is present in the right upper lobe. B, Sagittal US image from the same patient shows consolidation within the lung and a multiseptated complex pleural fluid collection consistent with empyema.
COVID-19 infection on lung US. A, Anteroposterior chest radiograph, B, axial chest CT image, and C, lung US image from the same 74-year-old man, who tested positive for COVID-19 5 days prior to imaging. The chest radiograph shows bilateral peripheral opacity, which presents with a ground-glass appearance on the chest CT image. Lung US imaging in this patient demonstrated numerous B-lines throughout the parenchyma which were diffusely confluent in some sections. These are better seen in a cine clip (Movie 9). A small consolidation in a patient with COVID-19 is shown in Movie 10.
Figure 13:
COVID-19 infection on lung US. A, Anteroposterior chest radiograph, B, axial chest CT image, and C, lung US image from the same 74-year-old man, who tested positive for COVID-19 5 days prior to imaging. The chest radiograph shows bilateral peripheral opacity, which presents with a ground-glass appearance on the chest CT image. Lung US imaging in this patient demonstrated numerous B-lines throughout the parenchyma which were diffusely confluent in some sections. These are better seen in a cine clip (Movie 9). A small consolidation in a patient with COVID-19 is shown in Movie 10.

References

    1. Lichtenstein DA. Lung ultrasound in the critically ill. Ann Intensive Care 2014;4(1):1. - PMC - PubMed
    1. Lichtenstein DA. Current Misconceptions in Lung Ultrasound: A Short Guide for Experts. Chest 2019;156(1):21–25. - PubMed
    1. Saraogi A. Lung ultrasound: Present and future. Lung India 2015;32(3):250–257. - PMC - PubMed
    1. Ebrahimi A, Yousefifard M, Mohammad Kazemi H, et al. . Diagnostic Accuracy of Chest Ultrasonography versus Chest Radiography for Identification of Pneumothorax: A Systematic Review and Meta-Analysis. Tanaffos 2014;13(4):29–40. - PMC - PubMed
    1. Lichtenstein D, Goldstein I, Mourgeon E, Cluzel P, Grenier P, Rouby JJ. Comparative diagnostic performances of auscultation, chest radiography, and lung ultrasonography in acute respiratory distress syndrome. Anesthesiology 2004;100(1):9–15. - PubMed

LinkOut - more resources