. 2021 Apr 1;3(2):e200575.
doi: 10.1148/ryct.2021200575. eCollection 2021 Apr.

Cardiac MRI for Patients with Increased Cardiometabolic Risk

Affiliations

Cardiac MRI for Patients with Increased Cardiometabolic Risk

Cynthia Philip et al. Radiol Cardiothorac Imaging. .

Abstract

Cardiac MRI (CMR) has rich potential for future cardiovascular screening even though not approved clinically for routine screening for cardiovascular disease among patients with increased cardiometabolic risk. Patients with increased cardiometabolic risk include those with abnormal blood pressure, body mass, cholesterol level, or fasting glucose level, which may be related to dietary and exercise habits. However, CMR does accurately evaluate cardiac structure and function. CMR allows for effective tissue characterization with a variety of sequences that provide unique insights as to fibrosis, infiltration, inflammation, edema, presence of fat, strain, and other potential pathologic features that influence future cardiovascular risk. Ongoing epidemiologic and clinical research may demonstrate clinical benefit leading to increased future use. © RSNA, 2021.


Conflict of interest statement

Disclosures of Conflicts of Interest: C.P. disclosed no relevant relationships. R.S. disclosed no relevant relationships. P.P. disclosed no relevant relationships. R.L. disclosed no relevant relationships. K.S. disclosed no relevant relationships. M.S.B. Activities related to the present article: disclosed no relevant relationships. Activities not related to the present article: author’s institution has grants/grants pending from Sanofi; author received payment for lectures including service on speakers bureaus from EMS, Novo Nordisk, Boston Scientific, and GE Healthcare. Other relationships: disclosed no relevant relationships. E.A.H. Activities related to the present article: disclosed no relevant relationships. Activities not related to the present article: author has volunteer consultation with the Defense Health Agency and Department of Defense Cardiovascular Clinical and Imaging workgroups, volunteer activity with Society of Cardiac Computed Tomography, American Society of Nuclear Cardiology, Society of Cardiac MRI, and Society of Nuclear Medicine and Molecular Imaging; editorial board membership with ACC Cardiosmart, SCMR, and Atherosclerosis. Other relationships: disclosed no relevant relationships.

Figures

Cardiomyocyte in patients with diabetes. High levels of blood glucose and fatty acid, combined with insulin resistance, activate different cellular mechanisms in the myocardium. Glucose cannot be assimilated by the cardiomyocyte and form glucose metabolites such as advanced glycation products, polyols, and hexosamine, which activate pro-oxidant and proinflammatory pathways. Myocardial energy relies on free fatty acids, which are taken up and accumulated as toxic products such as triacylglycerols, leading to steatosis. These stimuli promote expression of prohypertrophic and profibrotic factors that lead to cardiac dysfunction. AGE = advanced glycation product, EC = endothelial cell, PPARs = peroxisome proliferator-activated receptors, RAA = renin-angiotensin-aldosterone, RAGE = receptor for advanced glycation end products, SMC = smooth muscle cell, TIMP = tissue inhibitor of metalloproteinase (Reprinted, with permission, from reference 11.)
Figure 1:
Cardiomyocyte in patients with diabetes. High levels of blood glucose and fatty acid, combined with insulin resistance, activate different cellular mechanisms in the myocardium. Glucose cannot be assimilated by the cardiomyocyte and form glucose metabolites such as advanced glycation products, polyols, and hexosamine, which activate pro-oxidant and proinflammatory pathways. Myocardial energy relies on free fatty acids, which are taken up and accumulated as toxic products such as triacylglycerols, leading to steatosis. These stimuli promote expression of prohypertrophic and profibrotic factors that lead to cardiac dysfunction. AGE = advanced glycation product, EC = endothelial cell, PPARs = peroxisome proliferator-activated receptors, RAA = renin-angiotensin-aldosterone, RAGE = receptor for advanced glycation end products, SMC = smooth muscle cell, TIMP = tissue inhibitor of metalloproteinase (Reprinted, with permission, from reference 11.)
Postcontrast T1 maps of the basal, midcavity, and apical left ventricle in short-axis view of the anterior segment (highlighted in red). An exponential recovery curve of signal intensities at different inversion times (T1) is produced to determine a postcontrast myocardial T1 value for the anterior segment: basal 476 msec, midcavity 439 msec, and apical 418 msec. This can be repeated before and after contrast enhancement for all 16 segments to determine the mean T1 value to quantify the degree of myocardial fibrosis. (Reprinted, with permission, from reference 26.) ROI = region of interest.
Figure 2:
Postcontrast T1 maps of the basal, midcavity, and apical left ventricle in short-axis view of the anterior segment (highlighted in red). An exponential recovery curve of signal intensities at different inversion times (T1) is produced to determine a postcontrast myocardial T1 value for the anterior segment: basal 476 msec, midcavity 439 msec, and apical 418 msec. This can be repeated before and after contrast enhancement for all 16 segments to determine the mean T1 value to quantify the degree of myocardial fibrosis. (Reprinted, with permission, from reference 26.) ROI = region of interest.
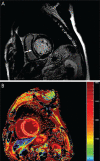
Imaging in a 60-year-old man with dilated cardiomyopathy and septal fibrosis. A, Late gadolinium enhancement (LGE) was found in the midwall of the interventricular septum (arrow). B, Non–contrast-enhanced T1 mapping shows that the native T1 value of the septal region including LGE (enclosed by a white line) is 1382.2 msec, which is more than 1349.4 msec ± 1.2 (standard deviation) above that of the minimum T1 value (enclosed by a green line, 1262.4 msec ± 62.0) in this patient. (Reprinted, with permission, from reference 29.)
Figure 3:
Imaging in a 60-year-old man with dilated cardiomyopathy and septal fibrosis. A, Late gadolinium enhancement (LGE) was found in the midwall of the interventricular septum (arrow). B, Non–contrast-enhanced T1 mapping shows that the native T1 value of the septal region including LGE (enclosed by a white line) is 1382.2 msec, which is more than 1349.4 msec ± 1.2 (standard deviation) above that of the minimum T1 value (enclosed by a green line, 1262.4 msec ± 62.0) in this patient. (Reprinted, with permission, from reference 29.)
Phosphate 31 (31P) spectroscopy in a healthy volunteer. A, Hydrogen 1 short-axis scout image in a healthy volunteer shows typical voxel selection in the myocardial intraventricular septum. B, A typical human cardiac 31P spectrum acquired using three-dimensional chemical shift imaging shows the following six resonances: three 31P atoms of adenosine triphosphate (ATP) (α, β, and γ); phosphocreatine (PCr); 2, 3-diphosphoglyceric acid (2,3-DPG); and phosphodiesterase (PDE). (Reprinted, with permission, from reference 92.)
Figure 4:
Phosphate 31 (31P) spectroscopy in a healthy volunteer. A, Hydrogen 1 short-axis scout image in a healthy volunteer shows typical voxel selection in the myocardial intraventricular septum. B, A typical human cardiac 31P spectrum acquired using three-dimensional chemical shift imaging shows the following six resonances: three 31P atoms of adenosine triphosphate (ATP) (α, β, and γ); phosphocreatine (PCr); 2, 3-diphosphoglyceric acid (2,3-DPG); and phosphodiesterase (PDE). (Reprinted, with permission, from reference 92.)
Measurement of myocardial triglyceride content by localized MR spectroscopy. Left, Cine four-chamber cardiac image. In this image, heart muscle appears dark gray; blood in myocardial chambers and pericardial and adipose fat appear light gray. The volume for testing myocardial triglyceride content is placed within the intraventricular septum (yellow rectangle). Right, Spectrum from myocardial tissue collected during simultaneous end expiration and end systole with respiratory gating and electrocardiographically guided triggering. LA = left atrium, LV = left ventricle, RA = right atrium, RV = right ventricle. (Reprinted, with permission, from reference 35.)
Figure 5:
Measurement of myocardial triglyceride content by localized MR spectroscopy. Left, Cine four-chamber cardiac image. In this image, heart muscle appears dark gray; blood in myocardial chambers and pericardial and adipose fat appear light gray. The volume for testing myocardial triglyceride content is placed within the intraventricular septum (yellow rectangle). Right, Spectrum from myocardial tissue collected during simultaneous end expiration and end systole with respiratory gating and electrocardiographically guided triggering. LA = left atrium, LV = left ventricle, RA = right atrium, RV = right ventricle. (Reprinted, with permission, from reference 35.)
Myocardial triglyceride content in patients with diabetes and controls using MR spectroscopy. Bars represent mean ± standard error. * indicates P < .05. (Reprinted, with permission, from reference 36.)
Figure 6:
Myocardial triglyceride content in patients with diabetes and controls using MR spectroscopy. Bars represent mean ± standard error. * indicates P < .05. (Reprinted, with permission, from reference 36.)
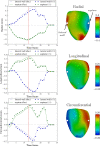
The strain curves and systolic strain maps for a patient with septal flash. Left column: Comparisons of Jacobian strain and strain computed using a postprocessing of tagged images proposed approach at V s = 1%, with radial strain (top), longitudinal strain (middle), and circumferential strain (bottom) computed at a point in the septum and another in the lateral wall. Right column: Systolic strains (indicated by vertical red line in strain curves) plotted on the medial surface mesh computed using this approach at V s = 1%. The points in the lateral wall and septum at which strain curves are displayed (left) are indicated in the top row (right). Jac. = Jacobian. (Reprinted, with permission, from reference 93.)
Figure 7:
The strain curves and systolic strain maps for a patient with septal flash. Left column: Comparisons of Jacobian strain and strain computed using a postprocessing of tagged images proposed approach at V s = 1%, with radial strain (top), longitudinal strain (middle), and circumferential strain (bottom) computed at a point in the septum and another in the lateral wall. Right column: Systolic strains (indicated by vertical red line in strain curves) plotted on the medial surface mesh computed using this approach at V s = 1%. The points in the lateral wall and septum at which strain curves are displayed (left) are indicated in the top row (right). Jac. = Jacobian. (Reprinted, with permission, from reference 93.)
Examples of cardiovascular MR feature tracking abnormalities in different categories of left ventricular ejection fraction (LVEF) and its association with major adverse cardiac events (MACE). Global circumferential strain (GCS) and global longitudinal strain (GLS) are displayed at end systole for, A–C, patients with a reduced LVEF (< 40%) and for, D–F, patients with an LVEF greater than or equal to 40%. VT = sustained ventricular tachycardia. (Reprinted, with permission, from reference 44.)
Figure 8:
Examples of cardiovascular MR feature tracking abnormalities in different categories of left ventricular ejection fraction (LVEF) and its association with major adverse cardiac events (MACE). Global circumferential strain (GCS) and global longitudinal strain (GLS) are displayed at end systole for, A–C, patients with a reduced LVEF (< 40%) and for, D–F, patients with an LVEF greater than or equal to 40%. VT = sustained ventricular tachycardia. (Reprinted, with permission, from reference 44.)
Mortality curves according to myocardial infarction (MI) status. (Reprinted, with permission, from reference 24.)
Figure 9:
Mortality curves according to myocardial infarction (MI) status. (Reprinted, with permission, from reference 24.)
The natural history of myocardial function in an adult human population. A, Left ventricular end-diastolic volume (LVEDV) statistically significantly decreased over 10 years for each age category, and, B, LV mass increased in men, and, C, mass-to-volume (M/V) ratio increased despite the fact that LV mass did not progressively increase (B, D). E, Although stroke volume (SV) progressively falls, LV ejection fraction (LVEF) maintains due to progressive decline in LV volumes. F, Aging is associated with the development of a concentric remodeling pattern secondary to a progressive decline in LV volume. Figures prepared based on data from Eng et al (94) and Cheng et al (95). (Reprinted, under a CC-BY license, from reference 49.)
Figure 10:
The natural history of myocardial function in an adult human population. A, Left ventricular end-diastolic volume (LVEDV) statistically significantly decreased over 10 years for each age category, and, B, LV mass increased in men, and, C, mass-to-volume (M/V) ratio increased despite the fact that LV mass did not progressively increase (B, D). E, Although stroke volume (SV) progressively falls, LV ejection fraction (LVEF) maintains due to progressive decline in LV volumes. F, Aging is associated with the development of a concentric remodeling pattern secondary to a progressive decline in LV volume. Figures prepared based on data from Eng et al (94) and Cheng et al (95). (Reprinted, under a CC-BY license, from reference 49.)

Similar articles

Cited by

References

    1. Sidney S, Quesenberry CP Jr, Jaffe MG, et al. . Recent Trends in Cardiovascular Mortality in the United States and Public Health Goals. JAMA Cardiol 2016;1(5):594–599. - PubMed
    1. Townsend N, Wilson L, Bhatnagar P, Wickramasinghe K, Rayner M, Nichols M. Cardiovascular disease in Europe: epidemiological update 2016. Eur Heart J 2016;37(42):3232–3245. - PubMed
    1. Roth GA, Forouzanfar MH, Moran AE, et al. . Demographic and epidemiologic drivers of global cardiovascular mortality. N Engl J Med 2015;372(14):1333–1341. - PMC - PubMed
    1. Mechanick JI, Farkouh ME, Newman JD, Garvey WT. Cardiometabolic-Based Chronic Disease, Adiposity and Dysglycemia Drivers: JACC State-of-the-Art Review. J Am Coll Cardiol 2020;75(5):525–538. - PMC - PubMed
    1. Grundy SM, Brewer HB Jr, Cleeman JI, et al. . Definition of metabolic syndrome: Report of the National Heart, Lung, and Blood Institute/American Heart Association conference on scientific issues related to definition. Circulation 2004;109(3):433–438. - PubMed

LinkOut - more resources