. 2021 May 18;2(5):100287.
doi: 10.1016/j.xcrm.2021.100287. Epub 2021 May 3.

Longitudinal proteomic analysis of severe COVID-19 reveals survival-associated signatures, tissue-specific cell death, and cell-cell interactions

Affiliations

Longitudinal proteomic analysis of severe COVID-19 reveals survival-associated signatures, tissue-specific cell death, and cell-cell interactions

Michael R Filbin et al. Cell Rep Med. .

Abstract

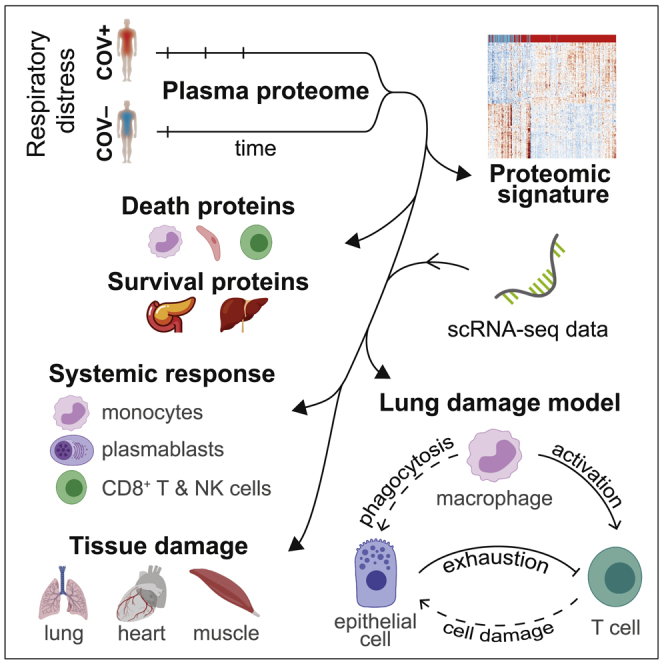
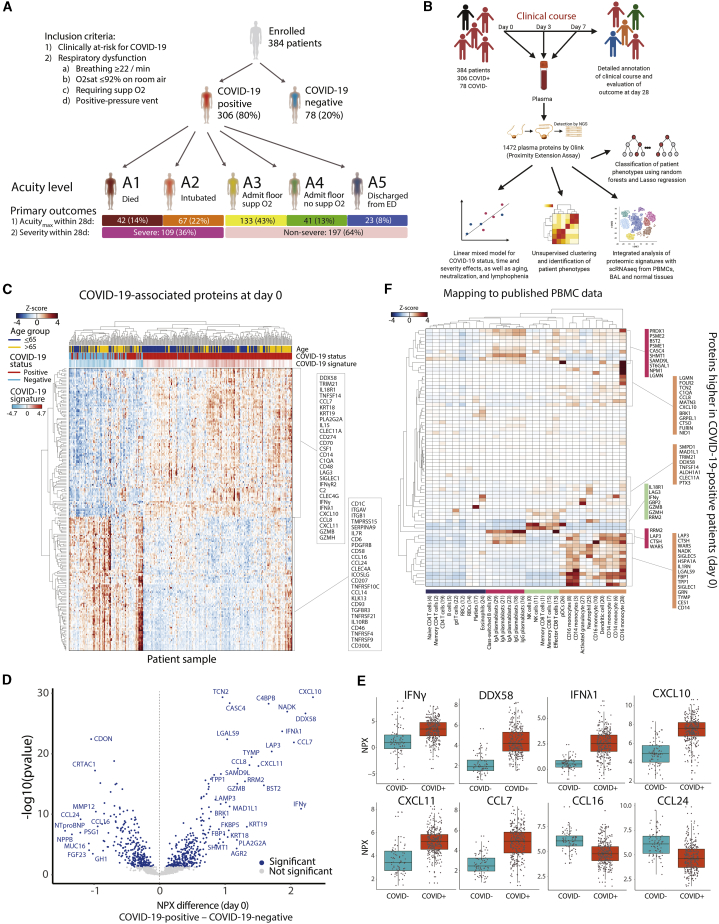
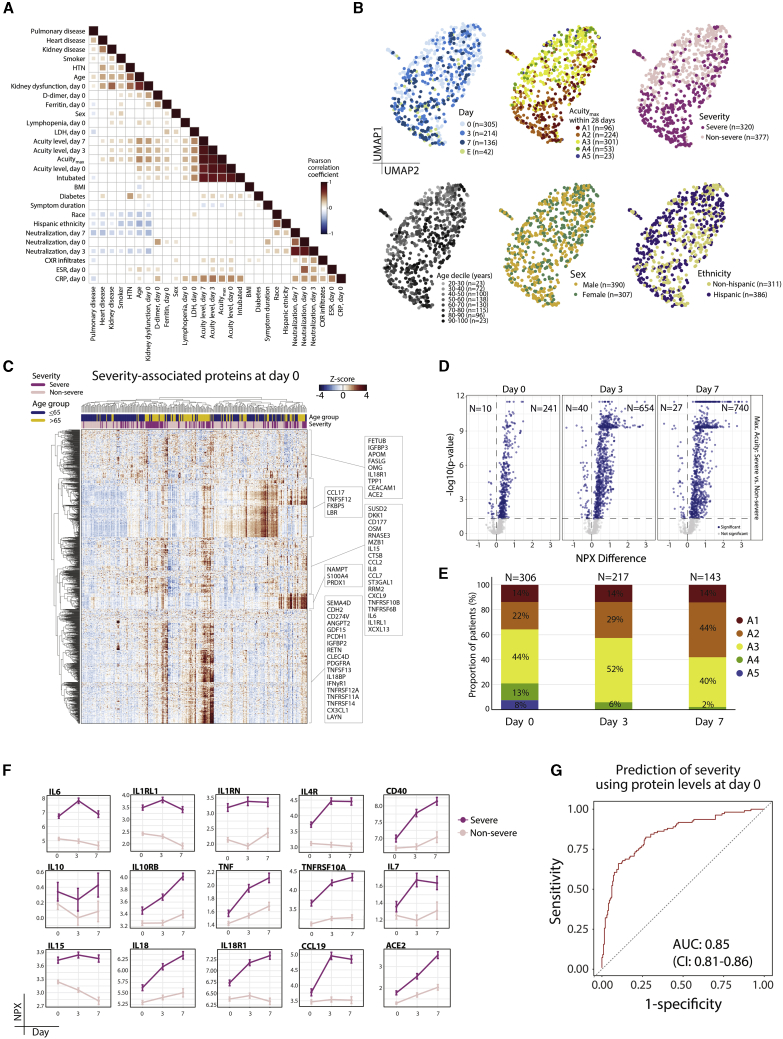
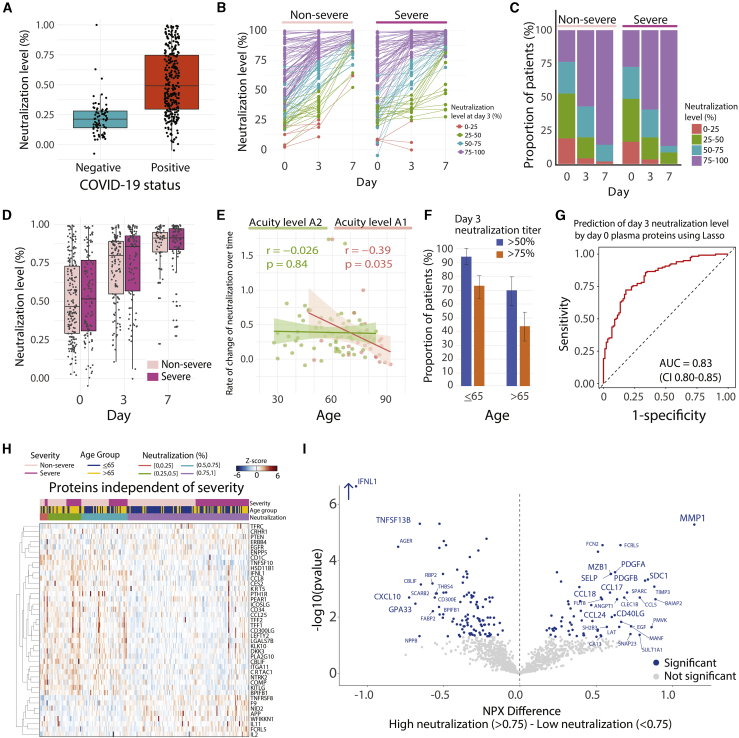
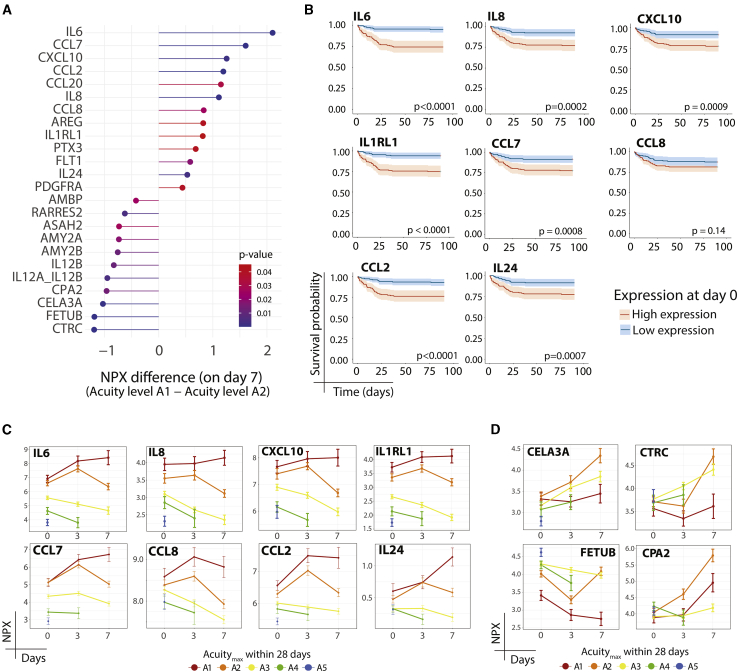
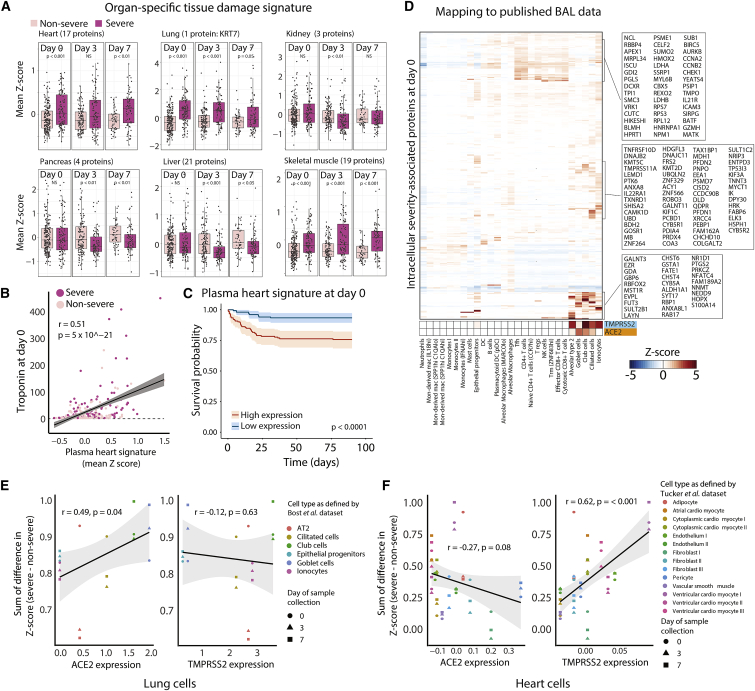
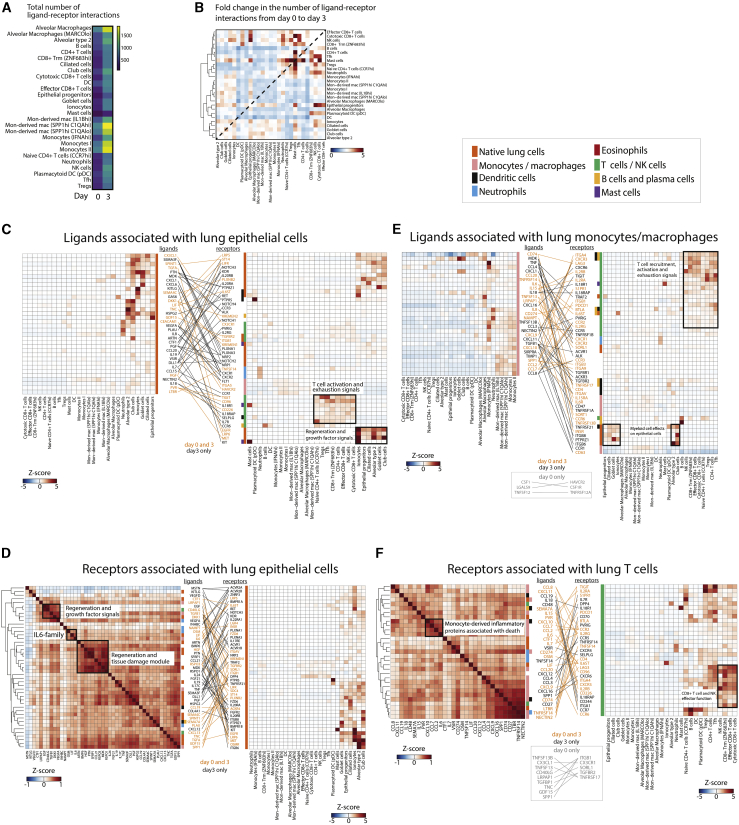
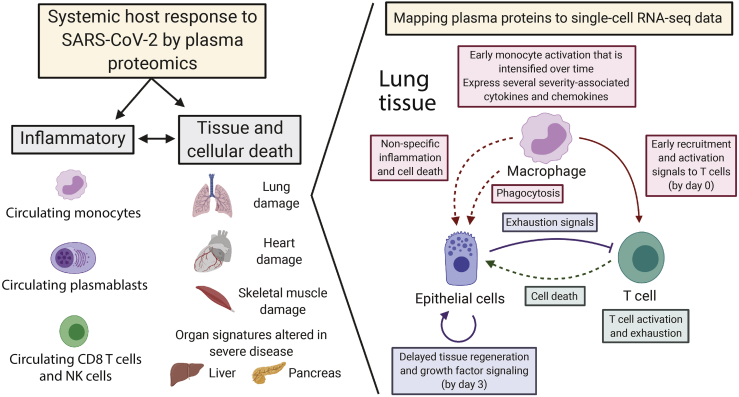
Mechanisms underlying severe coronavirus disease 2019 (COVID-19) disease remain poorly understood. We analyze several thousand plasma proteins longitudinally in 306 COVID-19 patients and 78 symptomatic controls, uncovering immune and non-immune proteins linked to COVID-19. Deconvolution of our plasma proteome data using published scRNA-seq datasets reveals contributions from circulating immune and tissue cells. Sixteen percent of patients display reduced inflammation yet comparably poor outcomes. Comparison of patients who died to severely ill survivors identifies dynamic immune-cell-derived and tissue-associated proteins associated with survival, including exocrine pancreatic proteases. Using derived tissue-specific and cell-type-specific intracellular death signatures, cellular angiotensin-converting enzyme 2 (ACE2) expression, and our data, we infer whether organ damage resulted from direct or indirect effects of infection. We propose a model in which interactions among myeloid, epithelial, and T cells drive tissue damage. These datasets provide important insights and a rich resource for analysis of mechanisms of severe COVID-19 disease.

Keywords: ARDS; COVID-19 severity; T cell activation; acute respiratory distress syndrome; death versus survival; intracellular death signatures; longitudinal; lung epithelial cells; lung monocyte/macrophages; pancreatic exocrine proteases; plasma proteomics.


Conflict of interest statement

A.M. is a consultant for Third Rock Ventures. J.R.G. and I. Gushterova are employees of Olink Proteomics. G.S.H. is an employee of Genentech (as of November 2020). L.L.J. is an employee and stockholder of Novartis. N.H. holds equity in BioNTech and is a consultant for Related Sciences.

Figures

None
Graphical abstract
Figure 1
Figure 1
SARS-CoV-2 infection induces viral response and IFN-pathway proteins detected in patient plasma (A) Schematic of study cohort: 306 COVID-19-infected patients and 78 symptomatic COVID-19 controls. Inclusion criteria are indicated. Shown are maximal acuity level within 28 days (Acuitymax) for COVID-19-infected patients (A1, most severe; A5, least severe), N, proportion of patients, and severe versus non-severe group. (B) Schematic of study methodology. (C–E) Differentially expressed proteins by COVID-19 status. Linear model fitting each Olink protein, with COVID-19 status as a main effect and putative confounders as covariates (see STAR Methods). p values calculated to account for false discovery rate (FDR) < 0.05, Benjamini-Hochberg method. (C) Heatmap of top 200 differentially expressed proteins between COVID-19+ and COVID-19 patients. Each row represents the expression of an individual protein over the entire cohort; each cell represents the Z score of protein expression for all measurements across a row. COVID-19 signature scores calculated by taking the mean Z score of the top 25 differentially expressed proteins in COVID-19+ patients minus the top 25 differentially expressed proteins in COVID-19 patients. (D) Volcano plot of differentially expressed proteins based on mean normalized protein expression (NPX) values between COVID-19+ and COVID-19 patients. Blue circles, significantly differentially expressed proteins. All of the proteins are shown. (E) Boxplots of select differentially expressed viral response and interferon (IFN) pathway proteins (from D), including IFN-γ, DDX58 (or RIG-I), IFN-λ1, and chemokines CXCL10, CXCL11, CCL7, CCL16, and CCL24. (F) Inference of cell of origin by mapping gene expression of differentially expressed plasma proteins elevated in COVID-19+ versus COVID-19 patients in a scRNA-seq peripheral blood cell COVID-19 dataset. Heatmaps of mean expression of COVID-19-related proteins (y axis) in immune cell subtypes (x axis). gd T cells, γδ T cells; pDCs, plasmacytoid dendritic cells. See also Figures S1–S3 and S5 and Tables S1 and S2.
Figure 2
Figure 2
Plasma proteomic biomarkers and predictors of disease severity (A) Pairwise correlation heatmap of clinically annotated variables for COVID-19+ patients showing correlations having p < 0.05. (B) Unsupervised clustering by uniform manifold approximation and projection (UMAP) for COVID-19+ patients, color-coded (left to right) by day of sample collection (D0, D3, D7), Acuitymax by D28, severity, age decile, gender, and ethnicity. E, event-driven samples (see STAR Methods). (C) Linear mixed model fitting each Olink protein, with severity, time point, and the interaction of the 2 terms as main effects and putative confounders as covariates (see STAR Methods). Heatmap of significant differentially expressed proteins between severe and non-severe patients at D0. Significance of the 3 model terms determined with an F test, Satterthwaite degrees of freedom, and type III sum of squares. p values for the 3 model terms of interest calculated to account for FDR < 0.05 using the Benjamini-Hochberg method for multiple hypothesis correction. Group differences calculated for each significant protein; p values adjusted using Tukey method. (D) Linear mixed model fitting each Olink protein, with severity, time point, and the interaction of the 2 terms as main effects and putative confounders as covariates (see STAR Methods). Volcano plots of differentially expressed proteins between severe and non-severe COVID-19+ patients by time point, with number (N) indicated. Blue circles, proteins that are significantly differentially expressed. All of the proteins are shown. (E) Distribution of patient samples by acuity level on day of collection and as a function of time. N, number of individual patient samples. (F) Point range plots over time of selected set of proteins significant for interaction term in the model described in (D), color-coded by disease severity. (G) Receiver operating characteristic (ROC) curve of predictive performance of an elastic net logistic regression classifier of disease severity, for Olink proteins of each patient at D0. Performance was evaluated using 100 repeats of 5-fold cross-validation. Mean area under the curve (AUC) with 95% confidence intervals (CIs). Neutralization, virus neutralization activity by plasma. See also Figures S2–S5 and Table S2.
Figure 3
Figure 3
Predictors of neutralization and its association with disease severity and age (A) Boxplot of SARS-CoV-2 Spike pseudovirus neutralization levels for COVID-19 and COVID-19+ patients at D0. Box edges, interquartile range (IQR); middle line, median. (B) Point-range plots of neutralization levels in non-severe and severe COVID-19+ patients over time. Color-coding by neutralization level at D3, grouped into 0%–25%, 25%–50%, 50%–75%, and 75%–100%. (C) Proportion of patients with neutralization levels as in (B), over time and by severity level. (D) Boxplots of neutralization levels in non-severe and severe patients over time. Box edges, IQR; middle line, median. (E) Scatterplot of the correlation of age with rate of change in neutralization level over time in A2 (left) and A1 (right) patients. Rate of change is the negative of the regression line slope through log2(fold change) in GFP levels at each time point compared to controls. (F) Proportion of patients aged £65 years (left) or >65 years (right) achieving neutralization titers of ³50% (blue) or 75% (orange) at D3. Error bars, 95% CI of proportion. (G) Lasso regression model for prediction of D3 neutralization level (above or below 75%) using Olink plasma proteins at D0 across all COVID-19+ patients. Prediction performed with 5-fold cross-validation over 100 iterations; AUC 0.83 (95% CI 0.80–0.85). (H) Heatmap of Olink plasma protein expression of each of the top selected features from the predictor in (G) that did not overlap with the top severity-associated proteins from the linear mixed model (see STAR Methods). (I) Volcano plot of differentially expressed proteins based on mean NPX values between high and low viral neutralization titers (>0.75 versus <0.75) across COVID-19+ patients. Blue circles, significantly differentially expressed proteins. All of the proteins are shown. See also Tables S2 and S5.
Figure 4
Figure 4
Patients with ARDS who survive display reduced inflammatory markers and increased anti-inflammatory pancreatic proteases (A) Differentially expressed proteins at day 7 between patients who had Acuitymax of A1 (death) versus A2 (ARDS but survived). Linear mixed model fitting each Olink protein, with Acuitymax, time point, and the interaction between the 2 terms as main effects. Covariates and statistical analysis as in Figure 2C. (B) Kaplan-Meier curves for overall survival of patients stratified by higher or lower than median expression of indicated proteins from (A). (C and D) Point-range plots for select proteins from (A) with positive (C) or negative (D) NPX differences. See also Table S3.
Figure 5
Figure 5
Severe COVID-19+ patients display elevated plasma markers of cell death from heart, lung, and skeletal muscle (A) Expression of tissue-specific plasma protein signatures in non-severe versus severe patients at each time point. (B) Scatterplot of the correlation of the D0 plasma heart signature as derived in (A) with D0 clinical troponin measurements. (C) Kaplan-Meier curve of overall survival of patients with high or low expression (above or below median expression level) of the derived plasma heart signature in (A). (D) Heatmap of mean gene expression per cell type of severity-associated intracellular plasma proteins at D0 derived from SomaScan data that map to scRNA-seq of BAL fluid, with TMPRSS2 and ACE2 expression indicated. (E and F) Scatterplots of the difference between severe and non-severe patients of lung (E) and heart (F) cell-specific intracellular death scores, derived from expression of differentially expressed proteins at each time point versus cell-type-specific ACE2 and TMPRSS2 expression levels from scRNA-seq of BAL fluid (E) or heart single-nucleus RNA-seq data (F). AT2, alveolar type 2 epithelial cells. See also Figures S5–S7, and Tables S6 and S7.
Figure 6
Figure 6
Interactions among lung epithelial cells, monocytes, and T cells drive disease severity and tissue damage (A) Heatmap of the total number of ligand-receptor interactions at D0 and D3 inferred from BAL fluid scRNA-seq data using only ligands differentially expressed in the plasma of severe versus non-severe COVID-19+ patients. (B) Heatmap of fold change from D0 to D3 in the number of ligand-receptor interactions between each cell type identified from BAL fluid scRNA-seq data. (C) Ligand-receptor contact map between D0 severity-associated ligands expressed by lung epithelial cells per BAL fluid scRNA-seq data (left) and the respective receptors for these ligands with their cell-specific expression from the same BAL dataset (right). (D) Ligand-receptor contact map between receptors expressed on lung epithelial cells in BAL fluid (right) and their respective severity-associated plasma ligands from our data (left). Ligand-receptor pairs are those for which the ligand was significantly associated with severity at D0. (E) Ligand-receptor contact map between ligands expressed on monocytes/macrophages in BAL fluid scRNA-seq data (left) and the respective receptors for these ligands with their cell-specific expression from the same BAL dataset (right). (F) As in (D), but ligand-receptor pairs selected for receptors expressed on T cells in BAL fluid. In (C)–(F), each cell in the heatmaps represents expression of the listed ligand or protein relative to its expression across all cell types. Ligands and receptors are color-coded (vertical color bar) by the cell type that demonstrates their highest expression. Ligand-receptor pairs and their connecting lines are color-coded by time point (D3 only, or both D0 and D3) at which the interaction was present. Key to cell type color-coding applies to (C)–(F). Trm, resident memory CD8+ T cells; DC, dendritic cell; Mon-derived mac, monocyte-derived macrophages; mac, macrophages; Tfh, T follicular helper cell; Tregs, regulatory T cells. See also Figures S5–S7, and Tables S2 and S4.
Figure 7
Figure 7
Model of contributions to the plasma proteome from circulating immune cells (primarily monocytes, plasmablasts, CD8+ T, NK cells) and damaged tissues Temporally ordered interaction network between monocyte/macrophages, T cells, and lung epithelial cells that drives disease severity.

Update of

References

    1. Mathew D., Giles J.R., Baxter A.E., Oldridge D.A., Greenplate A.R., Wu J.E., Alanio C., Kuri-Cervantes L., Pampena M.B., D’Andrea K., UPenn COVID Processing Unit Deep immune profiling of COVID-19 patients reveals distinct immunotypes with therapeutic implications. Science. 2020;369:eabc8511. - PMC - PubMed
    1. Lucas C., Wong P., Klein J., Castro T.B.R., Silva J., Sundaram M., Ellingson M.K., Mao T., Oh J.E., Israelow B., Yale IMPACT Team Longitudinal analyses reveal immunological misfiring in severe COVID-19. Nature. 2020;584:463–469. - PMC - PubMed
    1. Del Valle D.M., Kim-Schulze S., Huang H.H., Beckmann N.D., Nirenberg S., Wang B., Lavin Y., Swartz T.H., Madduri D., Stock A. An inflammatory cytokine signature predicts COVID-19 severity and survival. Nat. Med. 2020;26:1636–1643. - PMC - PubMed
    1. Arunachalam P.S., Wimmers F., Mok C.K.P., Perera R.A.P.M., Scott M., Hagan T., Sigal N., Feng Y., Bristow L., Tak-Yin Tsang O. Systems biological assessment of immunity to mild versus severe COVID-19 infection in humans. Science. 2020;369:1210–1220. - PMC - PubMed
    1. Williamson E.J., Walker A.J., Bhaskaran K., Bacon S., Bates C., Morton C.E., Curtis H.J., Mehrkar A., Evans D., Inglesby P. Factors associated with COVID-19-related death using OpenSAFELY. Nature. 2020;584:430–436. - PMC - PubMed

Publication types