. 2021 Jun 15;2(6):100290.
doi: 10.1016/j.xcrm.2021.100290. Epub 2021 May 5.

Longitudinal analysis of humoral immunity against SARS-CoV-2 Spike in convalescent individuals up to 8 months post-symptom onset

Affiliations

Longitudinal analysis of humoral immunity against SARS-CoV-2 Spike in convalescent individuals up to 8 months post-symptom onset

Sai Priya Anand et al. Cell Rep Med. .

Abstract

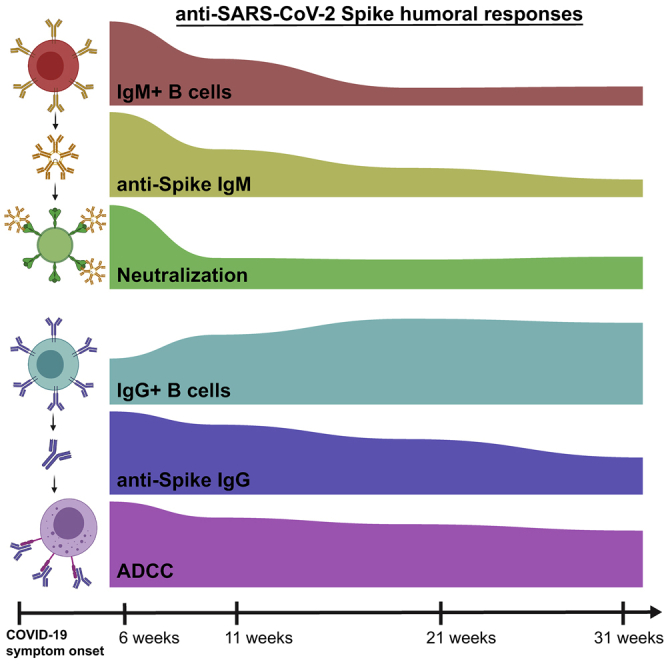
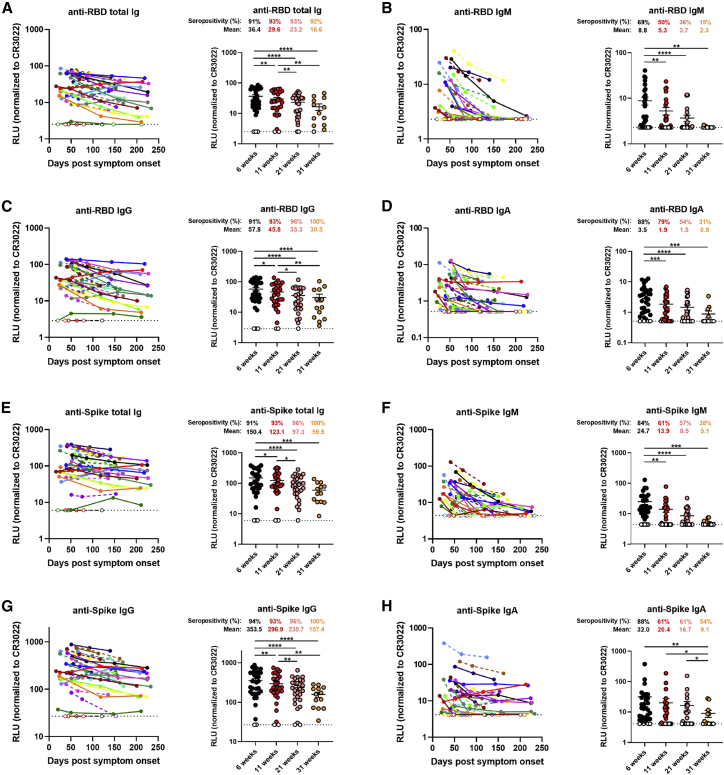
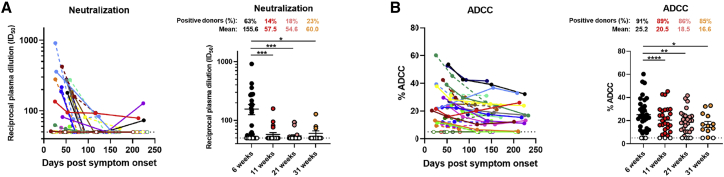
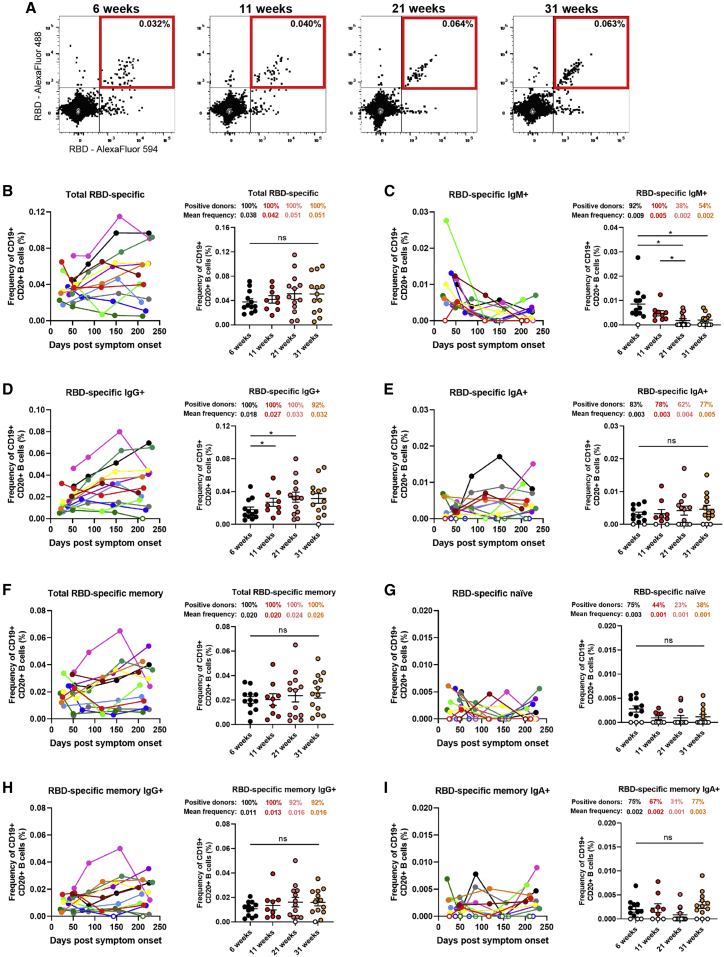
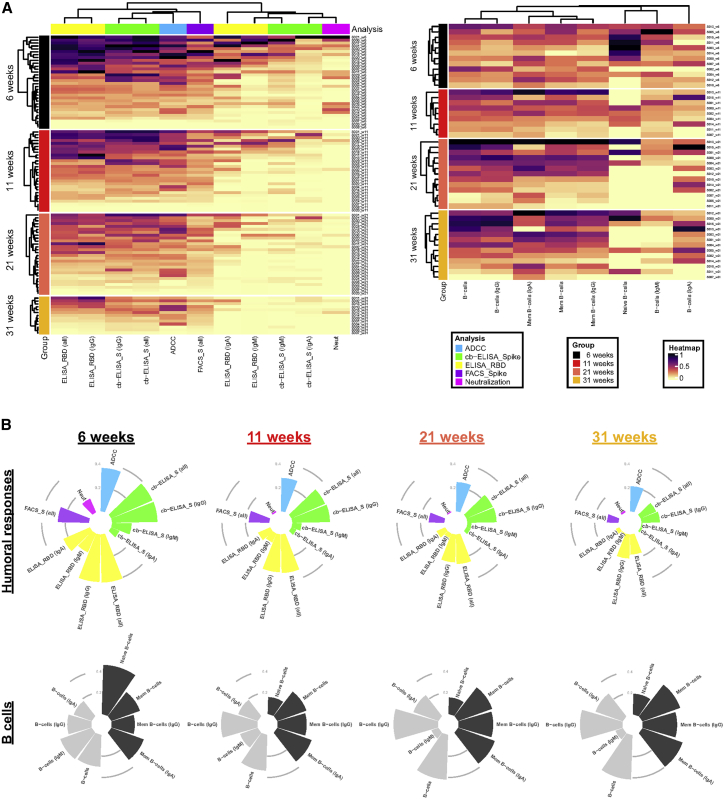
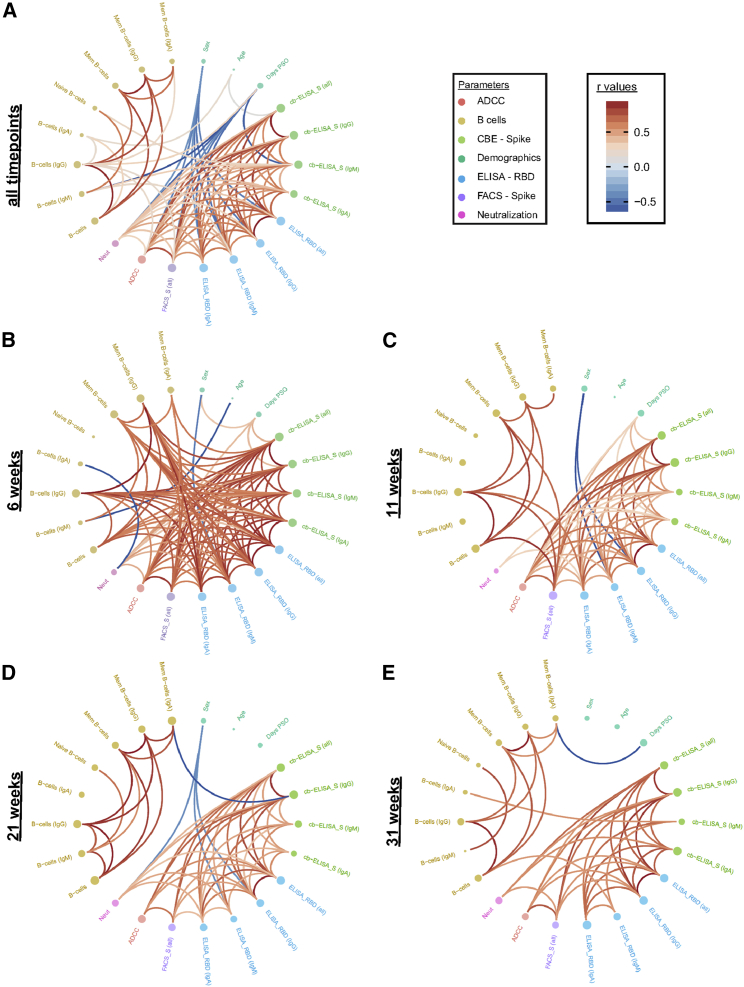
With the recent approval of highly effective coronavirus disease 2019 (COVID-19) vaccines, functional and lasting immunity to severe acute respiratory syndrome coronavirus 2 (SARS-CoV-2) is currently under investigation as antibody levels in plasma were shown to decline during convalescence. Since the absence of antibodies does not equate to absence of immune memory, we evaluate the presence of SARS-CoV-2-specific memory B cells in convalescent individuals. Here, we report a longitudinal assessment of humoral immune responses on 32 donors up to 8 months post-symptom onset. Our observations indicate that anti-Spike and anti-receptor binding domain (RBD) immunoglobulin M (IgM) in plasma decay rapidly, whereas the reduction of IgG is less prominent. Neutralizing activity also declines rapidly when compared to Fc-effector functions. Concomitantly, the frequencies of RBD-specific IgM+ B cells wane significantly when compared to RBD-specific IgG+ B cells, which remain stable. Our results add to the current understanding of immune memory following SARS-CoV-2 infection, which is critical for secondary infection prevention and vaccine efficacy.

Keywords: ADCC; COVID-19; RBD; SARS-CoV-2; Spike glycoproteins; antibodies; coronavirus; humoral responses; memory B cells; neutralization.


Conflict of interest statement

The authors declare no competing interests.

Figures

None
Graphical abstract
Figure 1
Figure 1
Decline of RBD- and Spike-specific antibodies in longitudinal convalescent plasma (A–D) Indirect ELISA was performed using recombinant SARS-CoV-2 RBD protein and incubation with COVID-19+ plasma samples recovered between 6 and 31 weeks post-symptom onset. Anti-RBD antibody binding was detected using horseradish peroxidase (HRP)-conjugated (A) anti-human IgM+IgG+IgA, (B) anti-human IgM, (C) anti-human IgG, or (D) anti-human IgA. Relative light unit (RLU) values obtained with BSA (negative control) were subtracted and further normalized to the signal obtained with the anti-RBD CR3022 monoclonal antibody (mAb) present in each plate. (E–H) Cell-based ELISA was performed using HOS cells expressing full-length SARS-CoV-2 Spike and incubation with COVID-19+ plasma samples recovered between 6 and 31 weeks post-symptom onset. Anti-Spike antibody binding was detected using HRP-conjugated (E) anti-human IgM+IgG+IgA, (F) anti-human IgM, (G) anti-human IgG, or (H) anti-human IgA. RLU values obtained with parental HOS (negative control) were subtracted and further normalized to the signal obtained with the CR3022 mAb present in each plate. (Left panels) Each curve represents the normalized RLUs obtained with the plasma of one donor at every donation as a function of the days after symptom onset. (Right panels) Plasma samples were grouped in different time points post-symptom onset (6, 11, 21, and 31 weeks). Undetectable measures are represented as white symbols, and limits of detection are plotted. Error bars indicate means ± SEM. Statistical significance was tested using repeated-measures one-way ANOVA with a Holm-Sidak post-test (∗p < 0.05; ∗∗p < 0.01; ∗∗∗p < 0.001; ∗∗∗∗p < 0.0001).
Figure 2
Figure 2
Neutralization and Fc-effector function activities in convalescent plasma decrease over time (A) Pseudoviral particles coding for the luciferase reporter gene and bearing the SARS-CoV-2 S glycoproteins were used to infect 293T-ACE2 cells. Neutralizing activity was measured by incubating pseudoviruses with serial dilutions of COVID-19+ plasma samples recovered between 6 and 31 weeks post-symptom onset at 37°C for 1 h prior to infection of 293T-ACE2 cells. Neutralization half-maximal inhibitory serum dilution (ID50) values were determined using a normalized non-linear regression using GraphPad Prism software. (B) CEM.NKr parental cells were mixed at a 1:1 ratio with CEM.NKr-Spike cells and were used as target cells. PBMCs from uninfected donors were used as effector cells in a fluorescence-activated cell sorting (FACS)-based ADCC assay. The graphs shown represent the percentages of ADCC obtained in the presence of COVID-19+ plasma samples recovered between 6 and 31 weeks post-symptom onset. (Left panels) Each curve represents (A) the neutralization ID50 or (B) the percentages of ADCC obtained with the plasma of one donor at every donation as a function of the days after symptom onset. (Right panels) Plasma samples were grouped in different time points post-symptom onset (6, 11, 21, and 31 weeks). Undetectable measures are represented as white symbols, and limits of detection are plotted. Error bars indicate means ± SEM. Statistical significance was tested using repeated-measures one-way ANOVA with a Holm-Sidak post-test (∗p < 0.05; ∗∗p < 0.01; ∗∗∗p < 0.001; ∗∗∗∗p < 0.0001).
Figure 3
Figure 3
RBD-specific memory B cells develop and persist up to 8 months post-symptom onset (A) Flow cytometry plots of staining with fluorescent SARS-CoV-2 RBD probes on CD19+ CD20+ HLA-DR+ B cells. Samples from one representative convalescent donor are shown for 4 different time points post-symptom onset (6, 11, 21, and 31 weeks). All percentages shown represent the frequency of RBD-specific B cells on the total CD19+ CD20+ B cell population. (B–G) Characterization of RBD-specific B cells was performed on longitudinal PBMC samples obtained from COVID-19+ convalescent individuals between 6 and 31 weeks post-symptom onset. (B–E) Total (B) RBD-specific B cells were segregated by subsets based on cell surface expression of (C) IgM, (D) IgG, or (E) IgA BCR isotypes. (F–I) Frequency of (F) total memory, (G) naive, (H) IgG+ memory, and (I) IgA+ memory B cells was determined based on CD21 and CD27 expression. (Left panels) Each curve represents the frequency of a B cell subset on the total B cell population obtained with PBMCs from one donor at every donation as a function of the days after symptom onset. (Right panels) PBMC samples were grouped in different time points post-symptom onset (6, 11, 21, and 31 weeks). Error bars indicate means ± SEM. Statistical significance was tested using repeated-measures one-way ANOVA with a Holm-Sidak post-test (∗p < 0.05; ns, nonsignificant)
Figure 4
Figure 4
Longitudinal patterns of B cell levels and humoral immune responses (A) (Left panel) Heatmap of humoral immune responses normalized per parameter. Columns represent immune response parameters clustered based on similarity and grouped according to the provided color code. Rows represent IDs grouped according to study time point. IDs are clustered according to their immune response profiles within each time point. (Right panel) Heatmap of B cell levels with similar display as in left panel is shown. (B) Circular bar plots represent averaged values of parameters at each time point.
Figure 5
Figure 5
Longitudinal plasticity and separation of B cell and humoral correlation clusters Edge bundling correlation plots where red and blue edges represent positive and negative correlations between connected parameters, respectively. Only significant correlations (p < 0.05) are displayed. Nodes are color coded based on the grouping of parameters according to the legend at the bottom. Node size corresponds to the degree of relatedness of correlations. Edge bundling plots are shown for correlation analyses using all data points (A) and datasets of individual time points, i.e., at 6 weeks (B), 11 weeks (C), 21 weeks (D), and 31 weeks (E).

Update of

References

    1. Rydyznski Moderbacher C., Ramirez S.I., Dan J.M., Grifoni A., Hastie K.M., Weiskopf D., Belanger S., Abbott R.K., Kim C., Choi J. Antigen-specific adaptive immunity to SARS-CoV-2 in acute COVID-19 and associations with age and disease severity. Cell. 2020;183:996–1012.e19. - PMC - PubMed
    1. Hartley G.E., Edwards E.S.J., Aui P.M., Varese N., Stojanovic S., McMahon J., Peleg A.Y., Boo I., Drummer H.E., Hogarth P.M. Rapid generation of durable B cell memory to SARS-CoV-2 spike and nucleocapsid proteins in COVID-19 and convalescence. Sci. Immunol. 2020;5:eabf8891. - PMC - PubMed
    1. Gaebler C., Wang Z., Lorenzi J.C.C., Muecksch F., Finkin S., Tokuyama M., Cho A., Jankovic M., Schaefer-Babajew D., Oliveira T.Y. Evolution of antibody immunity to SARS-CoV-2. Nature. 2021;591:639–644. - PMC - PubMed
    1. Grifoni A., Weiskopf D., Ramirez S.I., Mateus J., Dan J.M., Moderbacher C.R., Rawlings S.A., Sutherland A., Premkumar L., Jadi R.S. Targets of T cell responses to SARS-CoV-2 coronavirus in humans with COVID-19 disease and unexposed individuals. Cell. 2020;181:1489–1501.e15. - PMC - PubMed
    1. Dan J.M., Mateus J., Kato Y., Hastie K.M., Yu E.D., Faliti C.E., Grifoni A., Ramirez S.I., Haupt S., Frazier A. Immunological memory to SARS-CoV-2 assessed for up to 8 months after infection. Science. 2021;371:eabf4063. - PMC - PubMed