. 2021 Aug;246(15):1740-1749.
doi: 10.1177/15353702211013308. Epub 2021 May 8.

Protective effect of aldehyde dehydrogenase 2 against rat corneal dysfunction caused by streptozotocin-induced type I diabetes

Affiliations

Protective effect of aldehyde dehydrogenase 2 against rat corneal dysfunction caused by streptozotocin-induced type I diabetes

Pan Long et al. Exp Biol Med (Maywood). 2021 Aug.

Abstract

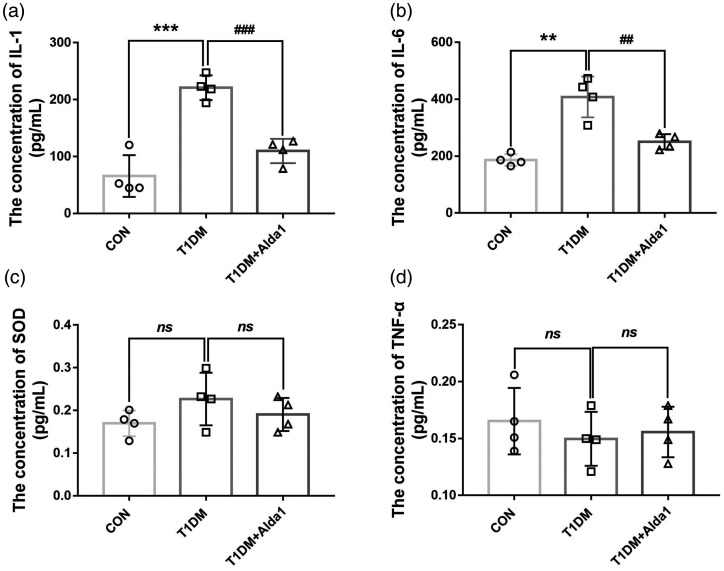
Aldehyde dehydrogenase 2 plays a pivotal role in detoxifying aldehydes, and our previous study revealed that aldehyde dehydrogenase 2 could alleviate diabetic retinopathy-associated damage. We aimed to characterize the potential role of aldehyde dehydrogenase 2 in diabetic keratopathy. Twenty-four rats with streptozotocin-induced (60 mg/kg, single intraperitoneal injection) type 1 diabetes mellitus (T1DM) were divided the T1DM group and the T1DM + Alda1 (an activator of aldehyde dehydrogenase 2) group (5 mg/kg/d, intraperitoneal injection, 1/2/3 months), while an additional 12 healthy rats served as the control group. Corneal morphology was examined in vivo and in vitro at one, two, and three months after T1DM induction. Additionally, serum inflammatory factors were measured by ELISA, and the expression of corneal vascular endothelial growth factor A (VEGF-A) and aldehyde dehydrogenase 2 was measured by immunofluorescence staining. Corneal cell death was evaluated by terminal-deoxynucleotidyl transferase-mediated nick end labeling (TUNEL) staining. Slit lamp analysis showed that the area of corneal epithelial cell injury in the T1DM + Alda1 group was significantly smaller than that in the T1DM group at one and two months after T1DM induction (all P < 0.05). OCT analysis and HE staining showed that the central corneal thickness (indication of corneal edema) and the epithelial keratinization level in the T1DM + Alda1 group was evidently decreased compared with those in the T1DM group (all P < 0.05). The serum inflammatory factors interleukin-1 and interleukin-6 were significantly upregulated in the T1DM group compared with the T1DM + Alda1 group at three months after T1DM induction (all P < 0.05), while there were no differences in SOD or TNF-α levels among all groups. Furthermore, corneal VEGF-A expression and corneal cell death in the T1DM + Alda1 group were dramatically reduced compared to those in the T1DM group (all P < 0.05). In conclusion, the aldehyde dehydrogenase 2 agonist Alda1 attenuated rat corneal dysfunction induced by T1DM by alleviating corneal edema, decreasing corneal cell death, and downregulating corneal VEGF-A expression.

Keywords: Aldehyde dehydrogenase 2; VEGF-A; cornea; diabetes mellitus; diabetic keratopathy; inflammation.


Conflict of interest statement

Declaration OF CONFLICTING INTRESTS: The author(s) declared no potential conflicts of interest with respect to the research, authorship, and/or publication of this article.

Figures

Figure 1.
Figure 1.
The levels of rats’ blood glucose and insulin at three months after T1DM induction. (a) The level of rats’ blood glucose. (b) The level of rats’ blood insulin. All analysis was performed in duplicates. The data were expressed as mean ± standard deviation (SD), n = 4 rats per group. *P <0.05, T1DM group and T1DM+Alda1 group vs. CON group; ***P <0.001, T1DM group and T1DM+Alda1 group vs. CON group; nsP >0.05, T1DM group and T1DM+Alda1 group vs. CON group.
Figure 2.
Figure 2.
The typical rats’ corneal pictures with slit lamp at one, two, and three months after T1DM induction. (A color version of this figure is available in the online journal.)
Figure 3.
Figure 3.
ALDH2 alleviated the diabetic rats’ corneal structure injury at one, two, and three months after T1DM induction. (a) The typical corneal HE staining picture at one, two, and three months after T1DM induction; (b) The typical corneal OCT picture at one month after T1DM induction; (c) The thickness of rats’ cornea at one, two, and three months after T1DM induction. All analysis was performed in duplicates. The data were expressed as mean ± standard deviation (SD), n = 4–12 rats per group. Scale bar: 50 μm. *P <0.05, T1DM group and T1DM +Alda1 group vs. CON group; **P <0.01, T1DM group and T1DM +Alda1 group vs. CON group. (A color version of this figure is available in the online journal.)
Figure 4.
Figure 4.
ALDH2 decreased serum levels of IL-1 and IL-6 at three months after T1DM induction. (a) The serum level of IL-1 at three months after T1DM induction; (b) The serum level of IL-6 at three months after T1DM induction; (c) The serum level of SOD at three months after T1DM induction; (d) The serum level of TNF-α at three months after T1DM induction. All analysis was performed in duplicates. The data were expressed as mean ± standard deviation (SD), n = 4 rats per group. **P <0.01, T1DM group and T1DM +Alda1 group vs. CON group; ***P <0.001, T1DM group and T1DM +Alda1 group vs. CON group; nsP >0.05, T1DM group and T1DM +Alda1 group vs. CON group or T1DM +Alda1 group vs. T1DM group; ##P <0.01, T1DM +Alda1 group vs. T1DM group; ###P <0.001, T1DM +Alda1 group vs. T1DM group.
Figure 5.
Figure 5.
Alda1 upregulated the expression of ALDH2 at two and three months after T1DM induction. (a–c) The typical ALDH2 immunofluorescence staining pictures at one, two, and three months after T1DM induction. (d) The expression of ALDH2 at one, two, and three months after T1DM induction. All analysis was performed in duplicates. The data were expressed as mean ± standard deviation (SD), n = 4 rats per group. Scale bar: 50 μm. **P <0.01, T1DM group and T1DM +Alda1 group vs. CON group; #P <0.05, T1DM +Alda1 group vs. T1DM group; nsP >0.05, T1DM +Alda1 group vs. T1DM group. (A color version of this figure is available in the online journal.)
Figure 6.
Figure 6.
ALDH2 decreased the expression of VEGF-A at two and three months after T1DM induction. (a–c) The typical VEGF-A immunofluorescence staining pictures at one, two, and three months after T1DM induction. (d) The expression of VEGF-A at one, two, and three months after T1DM induction. All analysis was performed in duplicates. The data were expressed as mean ± standard deviation (SD), n = 4 rats per group. Scale bar: 50 μm. *P <0.05, T1DM group and T1DM +Alda1 group vs. CON group; **P <0.01, T1DM group and T1DM +Alda1 group vs. CON group; nsP >0.05, T1DM group and T1DM +Alda1 group vs. CON group or T1DM +Alda1 group vs. T1DM group; ##P <0.01, T1DM +Alda1 group vs. T1DM group. (A color version of this figure is available in the online journal.)
Figure 7.
Figure 7.
ALDH2 decreased the corneal cell death at one, two, and three months after T1DM induction. (a–c) The typical corneal TUNEL staining pictures at one, two, and three months after T1DM induction. (d) The expression of corneal TUNEL at one, two, and three months after T1DM induction. All analysis was performed in duplicates. The data were expressed as mean ± standard deviation (SD), n = 4 rats per group. Scale bar: 50 μm. *P <0.05, T1DM group and T1DM +Alda1 group vs. CON group; **P <0.05, T1DM group and T1DM +Alda1 group vs. CON group; ***P <0.001, T1DM group and T1DM +Alda1 group vs. CON group; nsP >0.05, T1DM +Alda1 group vs. T1DM group. #P < 0.05, T1DM + Alda1 group vs. T1DM group. (A color version of this figure is available in the online journal.)

Similar articles

Cited by

References

    1. Saeedi P, Petersohn I, Salpea P, Malanda B, Karuranga S, Unwin N, Colagiuri S, Guariguata L, Motala AA, Ogurtsova K, Shaw JE, Bright D, Williams R. Global and regional diabetes prevalence estimates for 2019 and projections for 2030 and 2045: results from the international diabetes federation diabetes atlas, 9(th) edition. Diabetes Res Clin Pract 2019; 157:107843. - PubMed
    1. Papatheodorou K, Banach M, Bekiari E, Rizzo M, Edmonds M. Complications of diabetes 2017. J Diabetes Res 2018; 2018:3086167. - PMC - PubMed
    1. Schultz RO, Van Horn DL, Peters MA, Klewin KM, Schutten WH. Diabetic keratopathy. Trans Am Ophthalmol Soc 1981; 79:180–99 - PMC - PubMed
    1. Abdelkader H, Patel DV, McGhee C, Alany RG. New therapeutic approaches in the treatment of diabetic keratopathy: a review. Clin Exp Ophthalmol 2011; 39:259–70 - PubMed
    1. Vieira-Potter VJ, Karamichos D, Lee DJ. Ocular complications of diabetes and therapeutic approaches. Biomed Res Int 2016; 2016:3801570. - PMC - PubMed

Publication types

MeSH terms

Substances