. 2021 Jul 5;218(7):e20202059.
doi: 10.1084/jem.20202059. Epub 2021 May 10.

Normalization of cholesterol metabolism in spinal microglia alleviates neuropathic pain

Affiliations

Normalization of cholesterol metabolism in spinal microglia alleviates neuropathic pain

Juliana M Navia-Pelaez et al. J Exp Med. .

Abstract

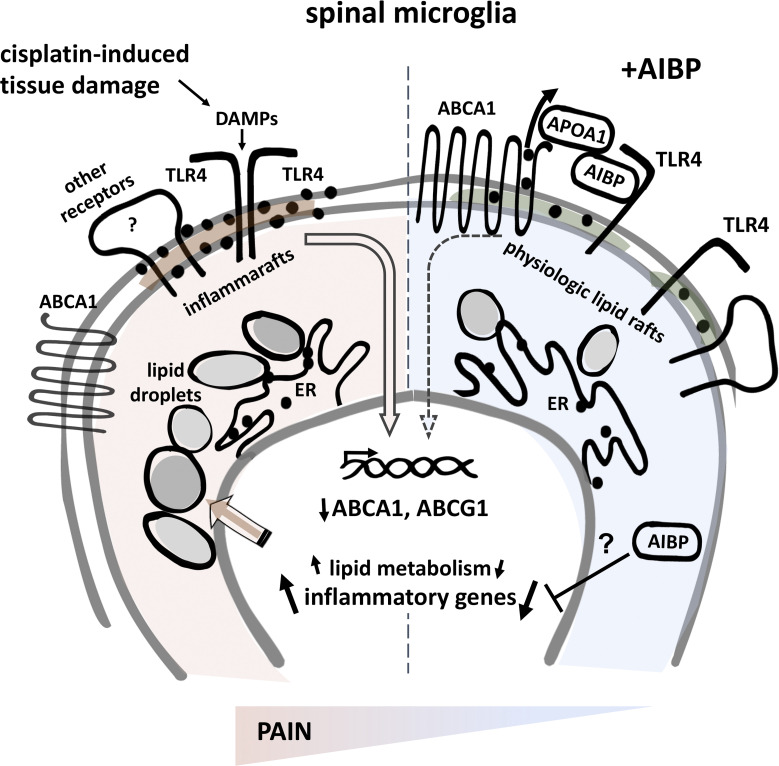
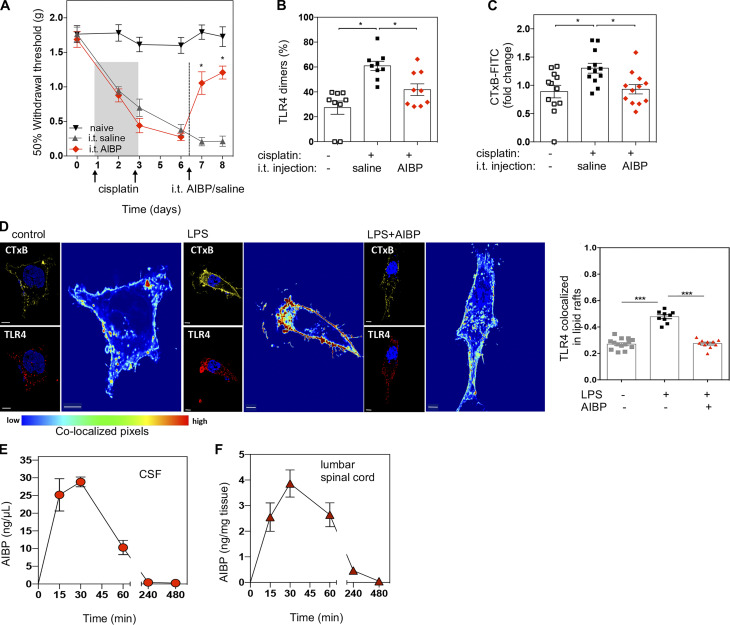
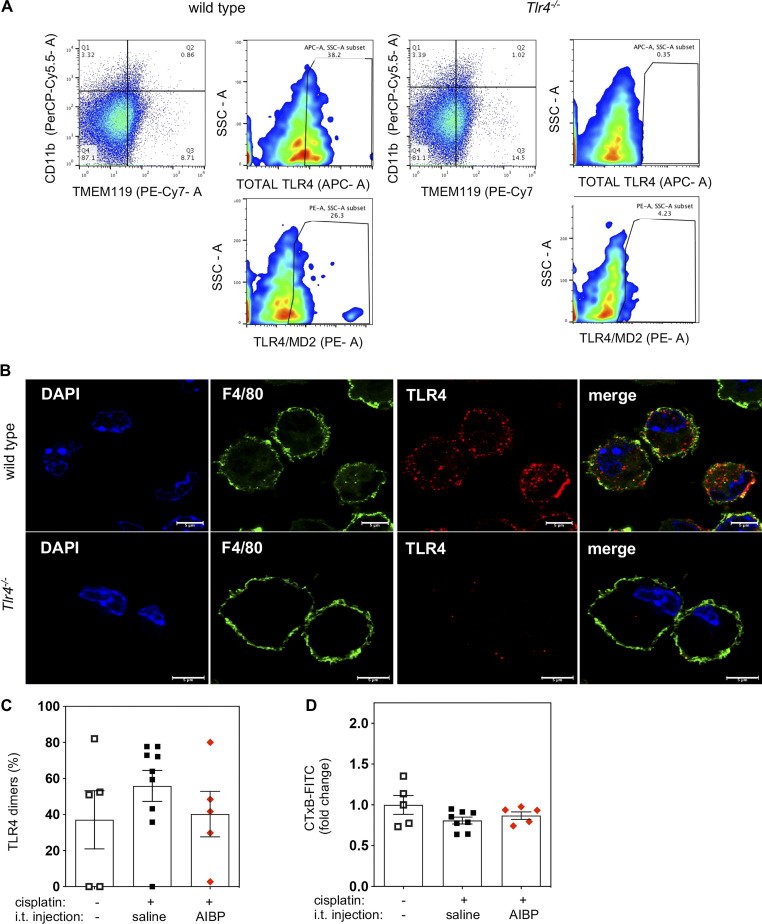
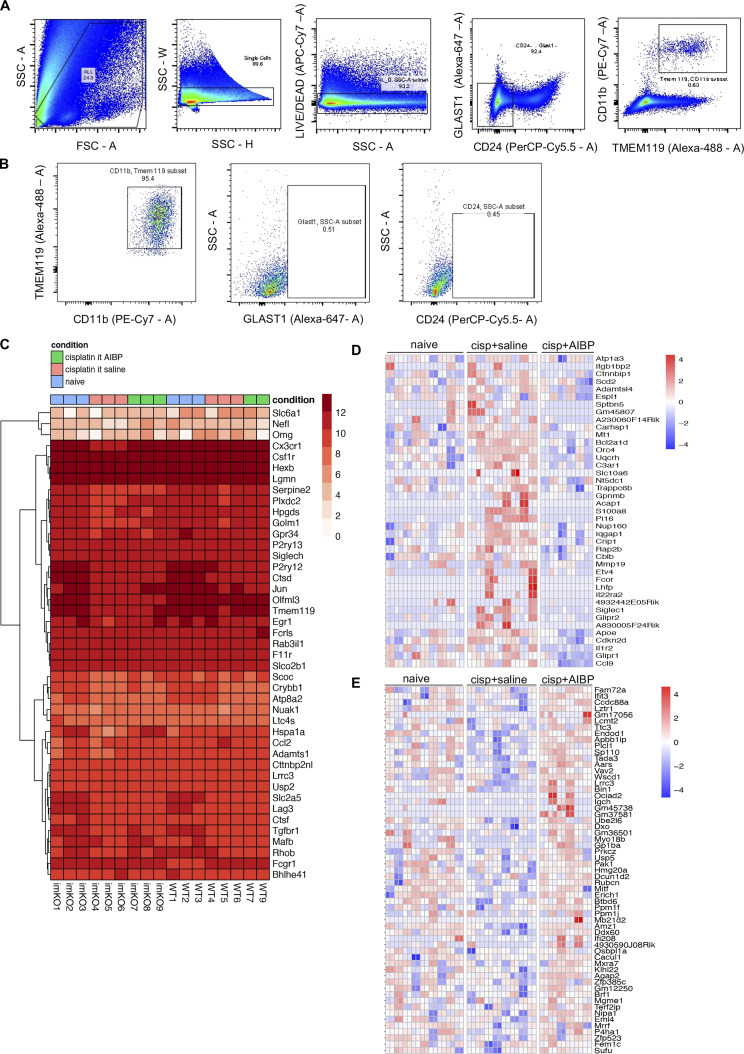
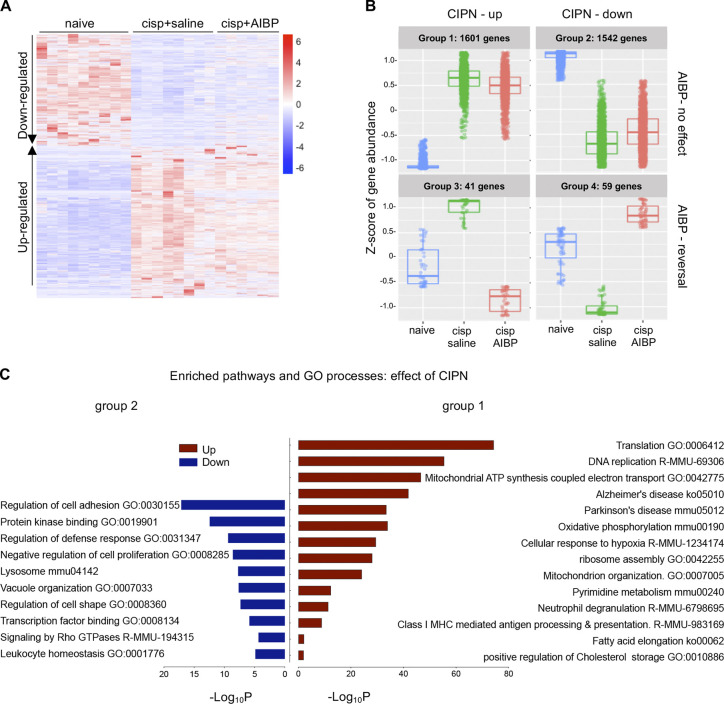
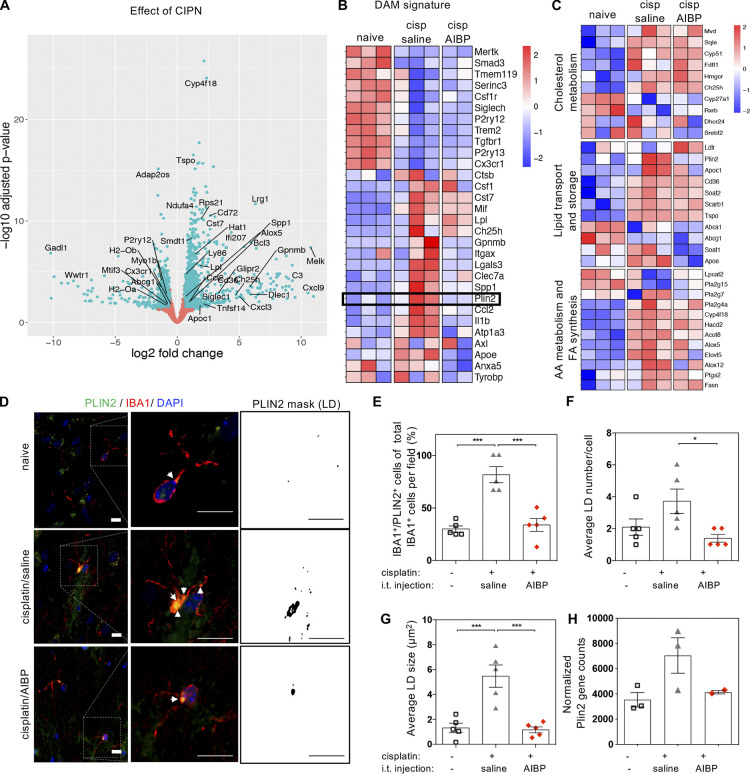
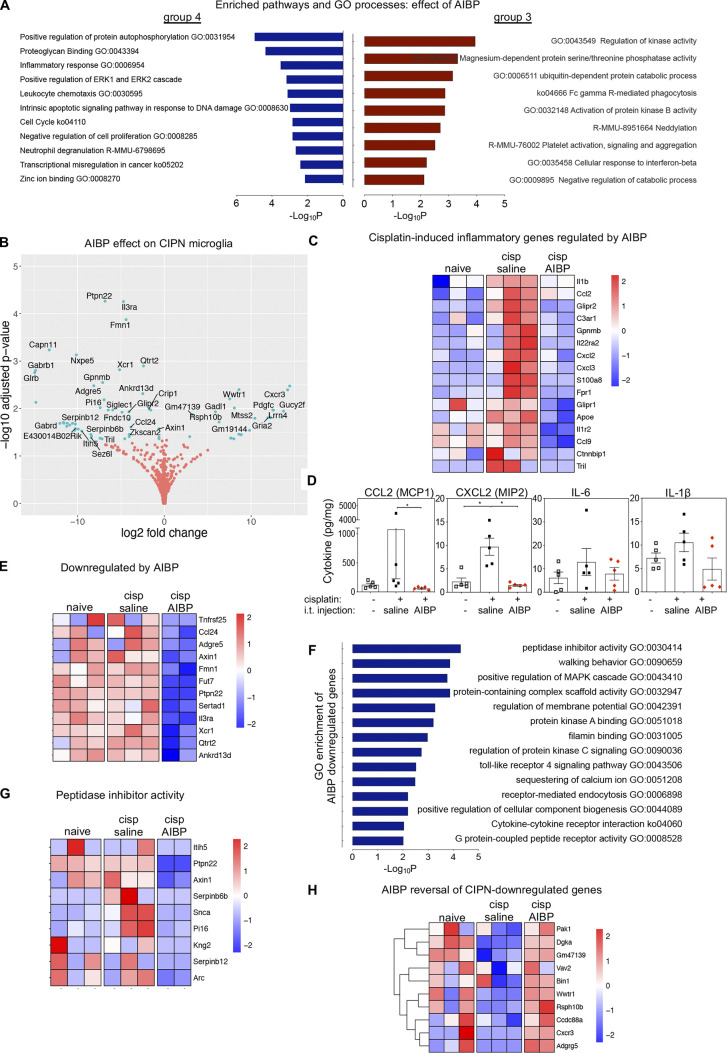
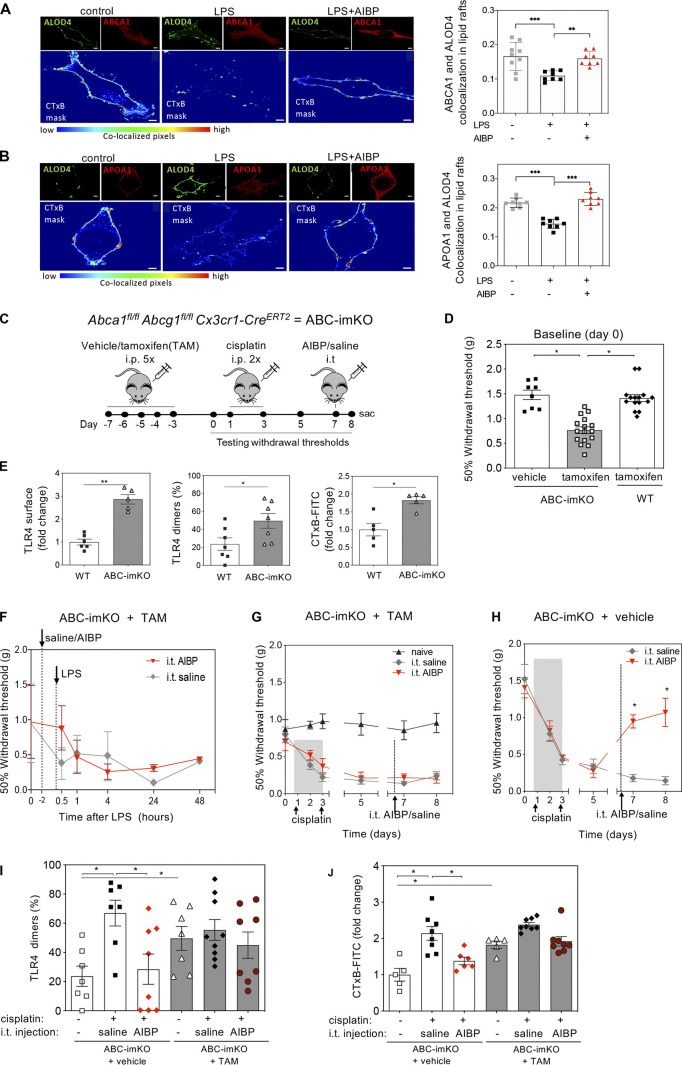
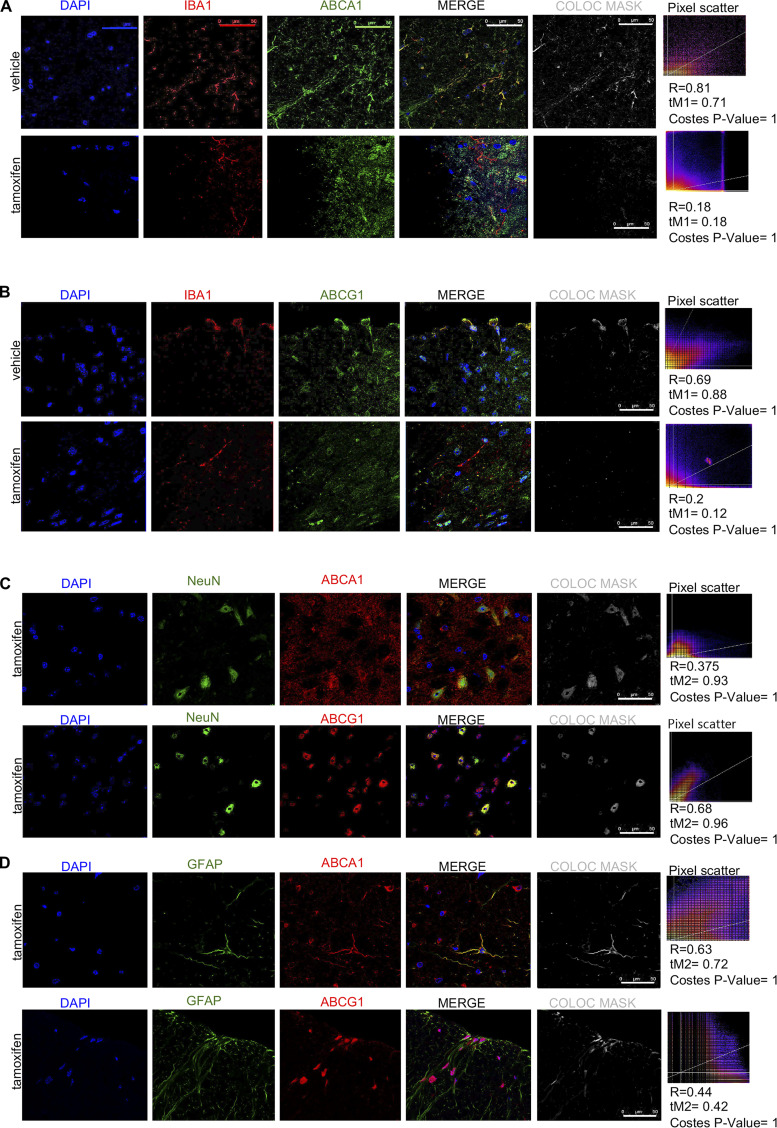
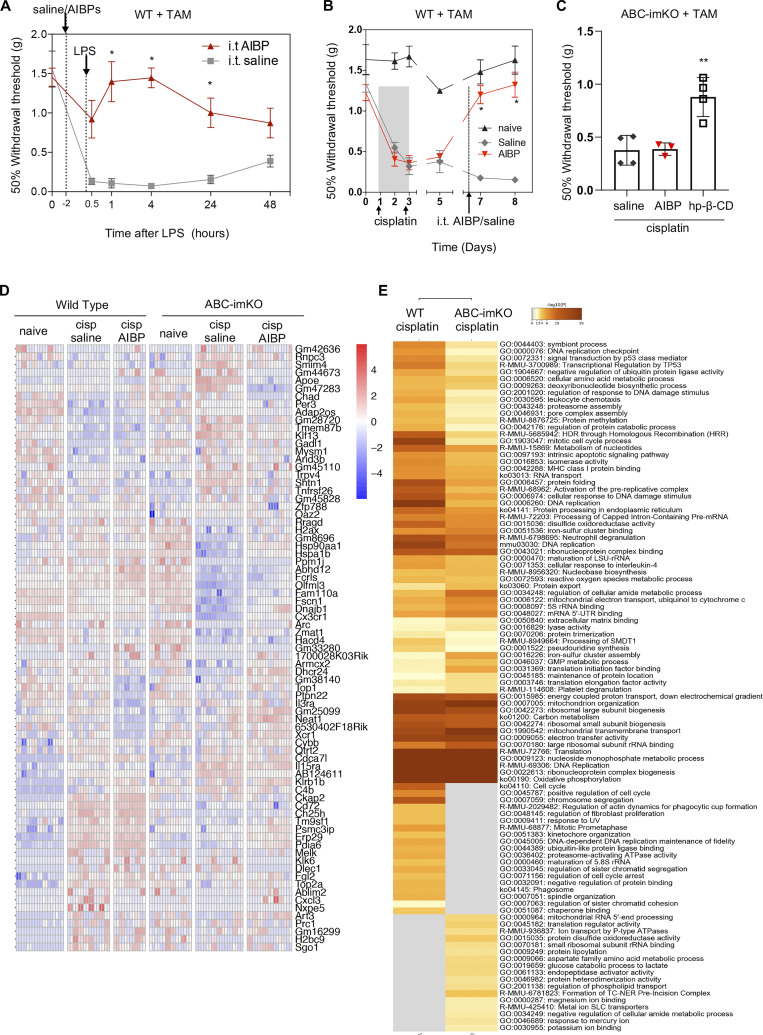
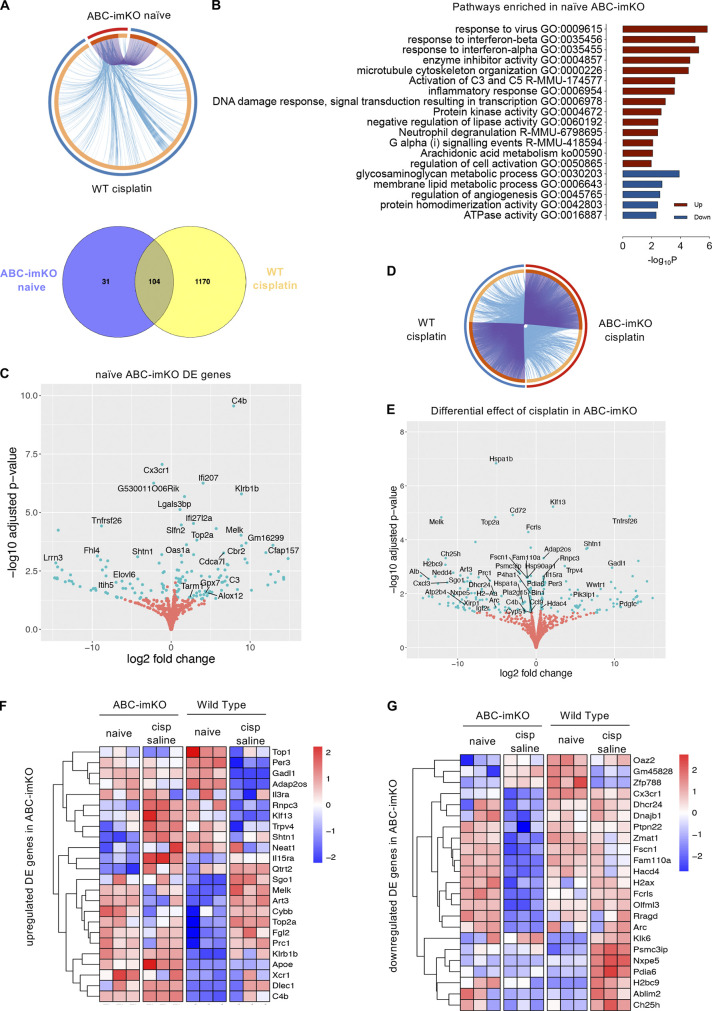
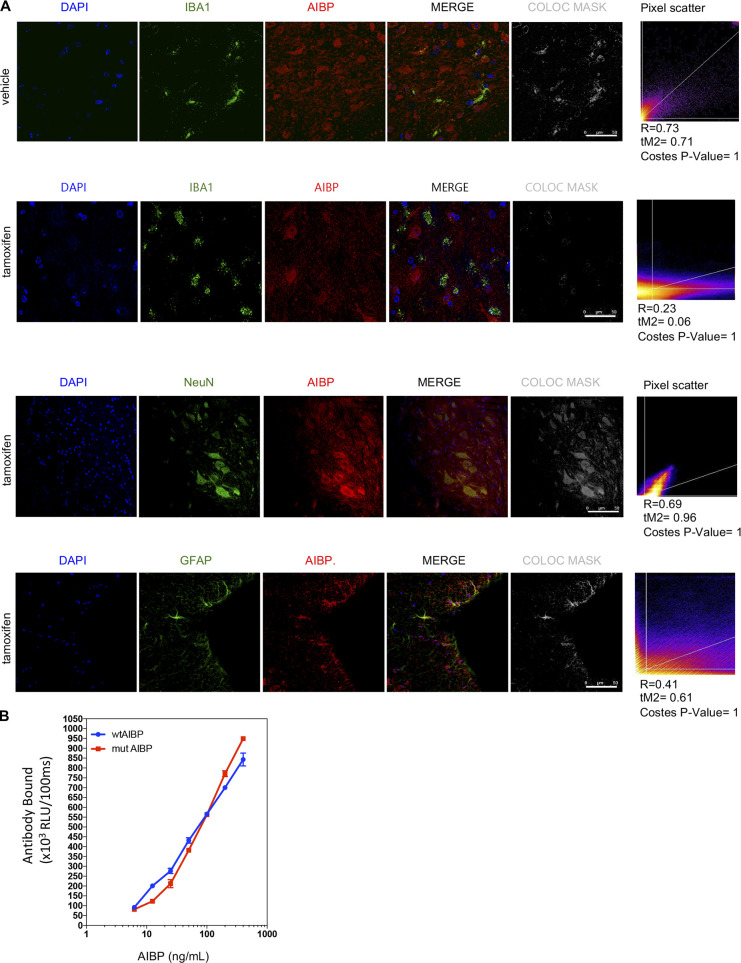
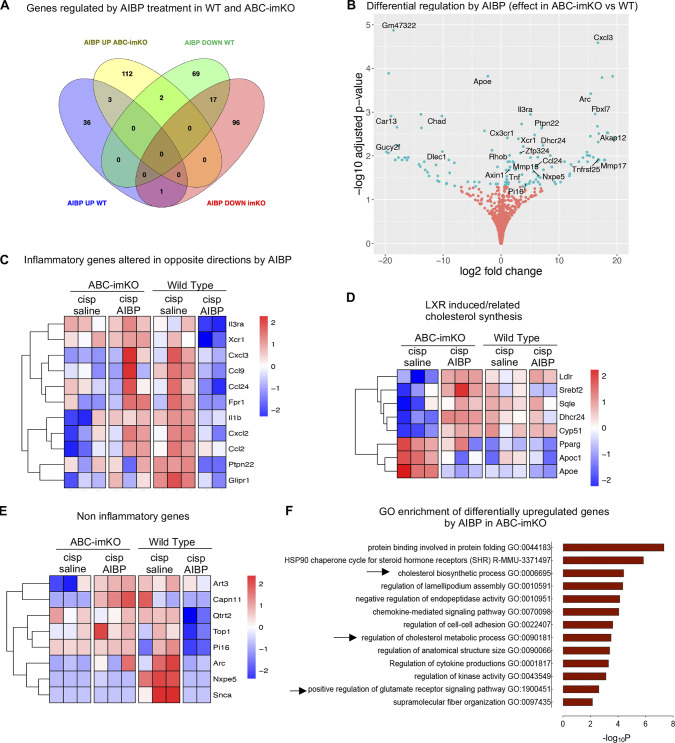
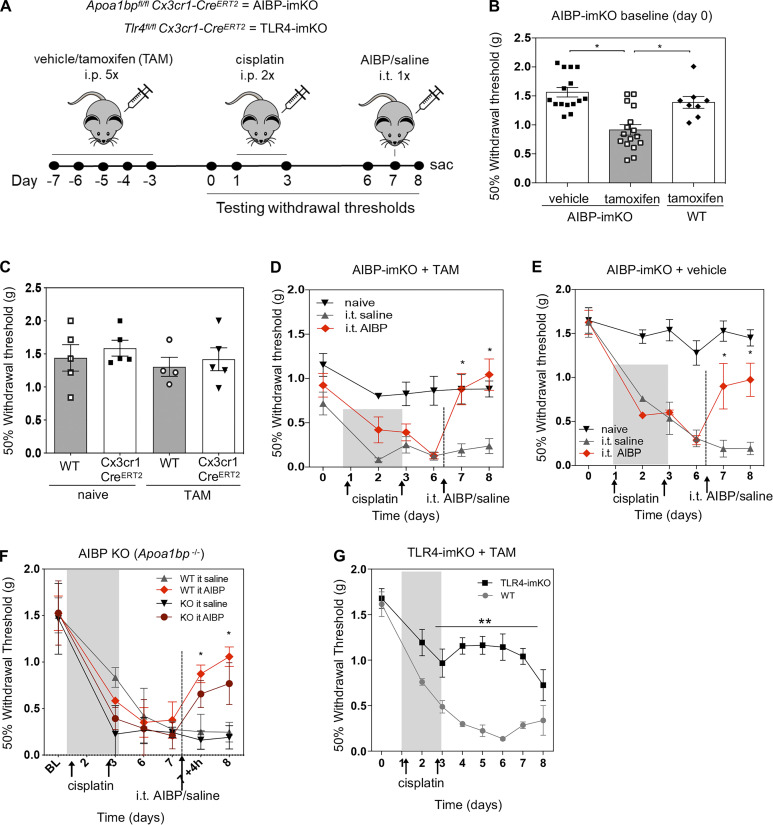
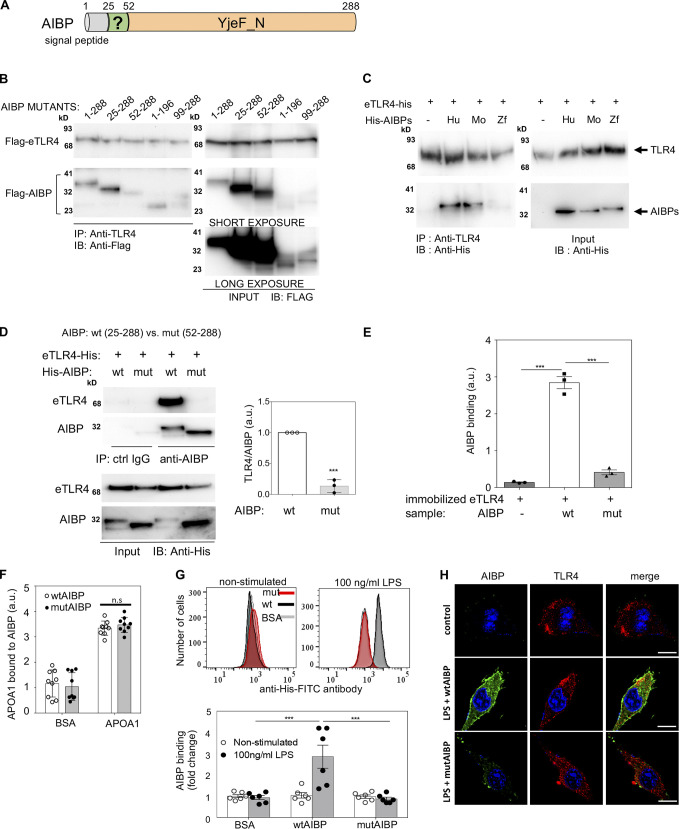
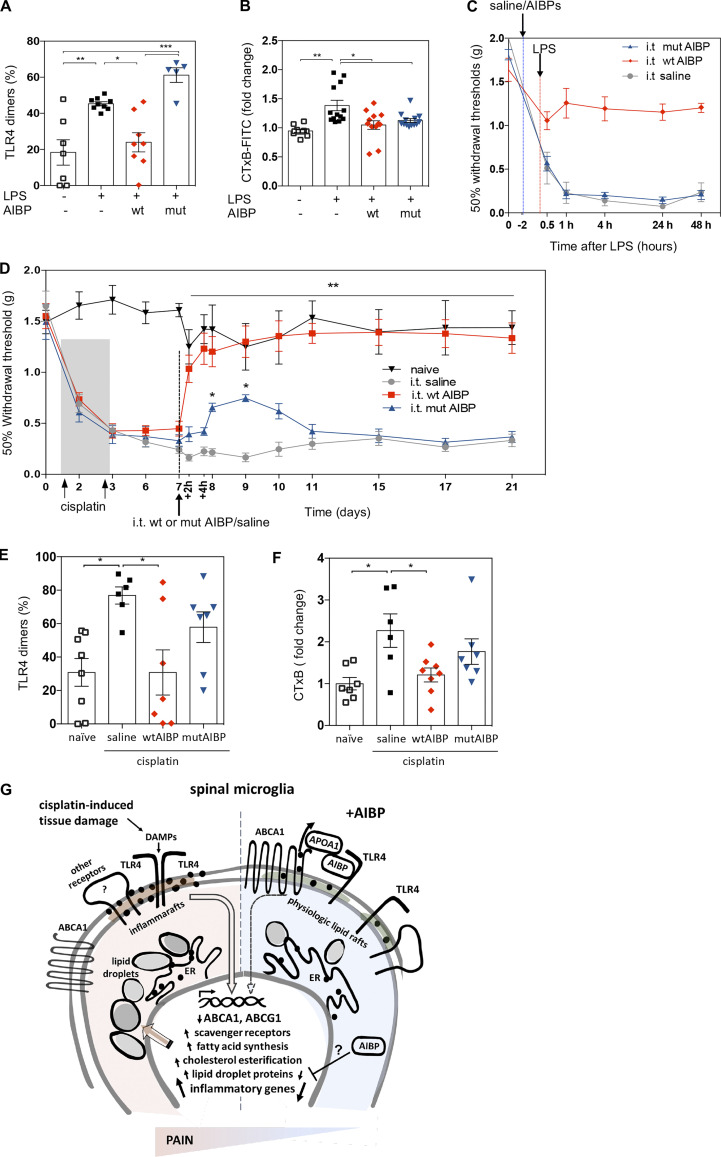
Neuroinflammation is a major component in the transition to and perpetuation of neuropathic pain states. Spinal neuroinflammation involves activation of TLR4, localized to enlarged, cholesterol-enriched lipid rafts, designated here as inflammarafts. Conditional deletion of cholesterol transporters ABCA1 and ABCG1 in microglia, leading to inflammaraft formation, induced tactile allodynia in naive mice. The apoA-I binding protein (AIBP) facilitated cholesterol depletion from inflammarafts and reversed neuropathic pain in a model of chemotherapy-induced peripheral neuropathy (CIPN) in wild-type mice, but AIBP failed to reverse allodynia in mice with ABCA1/ABCG1-deficient microglia, suggesting a cholesterol-dependent mechanism. An AIBP mutant lacking the TLR4-binding domain did not bind microglia or reverse CIPN allodynia. The long-lasting therapeutic effect of a single AIBP dose in CIPN was associated with anti-inflammatory and cholesterol metabolism reprogramming and reduced accumulation of lipid droplets in microglia. These results suggest a cholesterol-driven mechanism of regulation of neuropathic pain by controlling the TLR4 inflammarafts and gene expression program in microglia and blocking the perpetuation of neuroinflammation.


Conflict of interest statement

Disclosures: G. Beaton reported grants from University of California, San Diego, and Epigen Biosciences Inc. during the conduct of the study, and grants from RAFT Pharmaceuticals LLC outside the submitted work. K. Ley reported grants from NIH during the conduct of the study, and grants from Takeda and Novo Nordisk outside the submitted work. M. Corr reported "other" from Gilead outside the submitted work. T.L. Yaksh reported "other" from Raft Pharmaceuticals LLC outside the submitted work; in addition, T.L. Yaksh had a patent to US 10,729,788 B2 issued and is scientific co-founder of Raft Pharmaceuticals LLC. Y.I. Miller reported non-financial support from Raft Pharmaceuticals LLC outside the submitted work; in addition, Y.I. Miller had a patent to US 10,729,788 B2 issued and is scientific co-founder of Raft Pharmaceuticals LLC. The terms of this arrangement have been reviewed and approved by the University of California, San Diego in accordance with its conflict of interest policies. No other disclosures were reported.

Figures

None
Graphical abstract
Figure 1.
Figure 1.
CIPN alters TLR4 dimerization and lipid rafts in spinal microglia: Reversal by AIBP. (A) Withdrawal thresholds in WT mice in response to i.p. cisplatin (two injections of 2.3 mg/kg/d), followed by a single dose of i.t. saline (5 µl) or AIBP (0.5 µg/5 µl). Naive mice received no injections. Data from two independent experiments (n = 6 per group). (B and C) Analysis of CD11b+/TMEM119+ spinal microglia cells showing TLR4 dimerization (B) and lipid raft content measured by CTxB staining (C) 24 h after i.t. saline or AIBP (i.e., at day 8 of the time course shown in A). Data from three independent experiments (n = 9 per group for TLR4 dimerization and n = 12 for lipid raft staining). (D) BV-2 microglia cells were incubated for 30 min with AIBP (0.2 µg/ml) or vehicle in complete media, followed by a 5-min incubation with LPS (100 ng/ml). Scale bar, 5 µm. Bar graph shows Manders’ tM1 coefficient. (E and F) Pharmacokinetics of i.t. AIBP (2.5 µg/5 µl) in male Apoa1bp−/− mice in CSF (E) and lumbar spinal cord (F; n = 5). *, P < 0.05; ***, P < 0.001. Two-way ANOVA with Bonferroni post hoc test for multiple comparisons in grouped analyses; one-way ANOVA with Tukey post hoc test for multiple comparisons of three groups and imaging quantification.
Figure S1.
Figure S1.
Validation of the specificity of TLR4 antibodies used for flow cytometry and microscopy and TLR4 dimerization and lipid rafts in DRG macrophages. (A) Flow cytometry of single-cell suspensions from spinal cords of WT and Tlr4−/− mice showing TLR4-APC and TLR4/MD2-PE antibody staining of CD11b+(PerCP-Cy5.5)/TMEM199+(Pe-Cy7) microglia. (B) Confocal images of peritoneal elicited macrophages from WT and Tlr4−/− mice costained with F4/80-FITC and TLR4-647 antibodies. Scale bar, 5 µm. (C and D) Flow cytometry analysis of CD11b+ DRG macrophage cells showing TLR4 dimerization (C) and lipid raft content measured by CTxB staining (D) 24 h after i.t. saline or AIBP (i.e., at day 8 of the time course shown in Fig. 1 A); data from two independent experiments (n = 5 for control and AIBP group and n = 9 for cisplatin i.t. saline group). SSC-A, side scatter-A. Mean ± SEM.
Figure S2.
Figure S2.
FACS sorting strategy, QC, and phenotypic controls for RNA-seq. (A) Sorting strategy for lumbar CD11b+TMEM119+ spinal microglia. (B) Flow cytometry analysis of sorted microglia measuring purity of sorted cells and absence of GLAST1+ astrocytes or CD24+ neurons. (C) Microglial linkage analysis with a heatmap of microglia-specific genes. Log+1 of normalized counts from all samples was calculated for the 40 microglia-specific genes listed in Butovsky et al. (2014), as well as for the three genes that are expressed at low levels in microglia but at high levels specifically in neurons (Nefl), oligodendrocytes (Omg), or astrocytes (Slc6a1). (D and E) Heatmaps of CIPN-repressed genes that were up-regulated by AIBP (group 4; D) and CIPN-induced genes that were down-regulated by AIBP (group 3) in WT mice (E). Log2 normalized gene counts scaled by row, and columns represent all technical replicates of the three biological samples. cisp, cisplatin; FSC-A, forward scatter-A; SSC-A, side scatter-A; SSC-H, side scatter-H; SSC-W, side scatter-W.
Figure 2.
Figure 2.
Gene expression in spinal microglia of CIPN mice. (A and B) Microglia (CD11b+TEMEM119+) were FACS-sorted from three groups shown in Fig. 1 A: WT naive or injected with cisplatin (days 1 and 3) followed on day 7 by i.t. saline (5 µl) or AIBP (0.5 µg/5 µl), terminated on day 8, and subjected to RNA-seq; n = 3 biological replicates (mice) for naive and cisplatin/saline and n = 2 for cisplatin/AIBP (each biological replicate was collapsed from three technical replicates from the same animal). (A) Heatmap of DEGs across all samples (all technical replicates are presented in columns). Significant (adjusted P < 0.01) up- or down-regulated genes showing main effect tested by LRT. Log2 relative expression. (B) Groups of significant DEGs clustered based on expression profile patterns in different treatment conditions. (C) Pathway and GO enrichment analysis of up-regulated (group 1 in B) and down-regulated (group 2) genes induced by cisplatin treatment, using adjusted P < 0.05 and absolute fold change >1.5 and a minimum overlap of three genes in the pathway. Up-regulated pathways are shown in red and down-regulated in blue. cisp, cisplatin; GTPase, guanosine triphosphatase.
Figure 3.
Figure 3.
DAM and lipid-related gene expression and lipid droplets in spinal microglia of CIPN mice. (A–C) Same groups as in Fig. 2. (A) Volcano plot of up-regulated and down-regulated genes in spinal microglia of cisplatin-treated versus naive mice. Cutoff of adjusted P < 0.05 and absolute fold change >1.5 represented in light green dots. (B) Heatmap depicting DAM signature genes. (C) Heatmap of log2 normalized gene counts scaled by row showing lipid-related gene sets. (D–H) Lipid droplet (LD) accumulation in spinal microglia (white arrowheads) measured by PLIN2 immunostaining in spinal cord sections costained with IBA1 and DAPI. Experimental conditions as in Fig. 1 A; n = 5 fields of view from five mice per group from two independent experiments. Scale bar, 20 µm. Mean ± SEM; *, P < 0.05; ***, P < 0.001, tested by one-way ANOVA with Tukey’s test for multiple comparisons in grouped analyses. cisp, cisplatin; AA, arachidonic acid; FA, fatty acid.
Figure 4.
Figure 4.
Gene expression in spinal microglia of CIPN mice: Effect of AIBP. (A–H) Experimental conditions and analysis as in Fig. 1; n = 2 or 3 biological replicates per group (each biological replicate collapsed from three technical replicates). (A) Pathway and GO enrichment analyses of CIPN–up-regulated genes that were down-regulated by AIBP (group 3 in Fig. 2 B) and CIPN–down-regulated genes that were up-regulated by AIBP (group 4), using adjusted P < 0.05 and absolute fold change >1.5 and a minimum overlap of three genes in the pathway. Up-regulated pathways are shown in red and down-regulated in blue. (B) DEGs in spinal microglia induced by i.t. AIBP. Adjusted P < 0.05 and Benjamini–Hochberg FDR <5% represented in a volcano plot of up- and down-regulated genes in cisplatin/AIBP– versus cisplatin/saline–treated mice. Cutoff-adjusted P < 0.05 and absolute fold change >1.5 shown in light green dots. (C) Heatmap of inflammatory genes in group 3 up-regulated in CIPN and down-regulated by AIBP. (D) Cytokine protein expression in spinal tissue from WT naive, cisplatin/saline, and cisplatin/AIBP groups; n = 5 per group. (E) Heatmap of inflammatory genes not induced by cisplatin but down-regulated by AIBP. (F) Pathway and GO enrichment analysis of all genes down-regulated by AIBP using adjusted P < 0.05 and absolute fold change >1.5 and a minimum overlap of three genes in a pathway. (G) Heatmap of noninflammatory genes down-regulated by AIBP included in the most enriched pathway: peptidase inhibitor activity pathway. (H) Heatmap of genes whose down-regulation in CIPN was reversed by AIBP. Mean ± SEM; *, P < 0.05 compared with naive group and cisplatin/i.t. saline group. cisp, cisplatin.
Figure 5.
Figure 5.
ABCA1 and ABCG1 expression in microglia controls nociception and is required for AIBP-mediated reversal of allodynia in a mouse model of CIPN. (A and B) BV-2 cells were incubated for 30 min with AIBP (0.2 µg/ml) or vehicle in complete media, followed by a 5-min incubation with LPS (100 ng/ml). Colocalization of accessible cholesterol with ABCA1 (A) and APOA1 (B) in lipid rafts. Scale bar, 7 µm. Bar graphs show Manders’ tM1 coefficient. (C) Experimental design and timeline: Tamoxifen (TAM, 10 mg/ml, 200 µl/d), cisplatin (2.3 mg/kg), AIBP (0.5 µg/5 µl), or saline (5 µl). (D) Baseline (day 0) withdrawal thresholds before the start of cisplatin intervention. Data from three independent experiments (n = 8 for vehicle-treated ABC-imKO mice; n = 16 for TAM-treated ABC-imKO mice, and n = 15 for littermates Abca1fl/fl Abcg1fl/fl no-Cre [WT] mice treated with TAM). (E) TLR4 surface expression and dimerization and lipid rafts (CTxB) in CD11b+TMEM119+ spinal microglia of naive WT and ABC-imKO mice at baseline (day 0; n = 5 for TLR4 surface expression and lipid raft content analysis for both groups, n = 8 for WT, and n = 9 for ABC-imKO for TLR4 dimerization). (F) Withdrawal thresholds after i.t. saline or AIBP (0.5 µg/5 µl), followed by i.t. LPS (0.1 µg/5 µl) in TAM-induced ABC-imKO mice (n = 4 per group). (G and H) Withdrawal thresholds following i.p. cisplatin and i.t. saline or AIBP (0.5 µg/5 µl) injections in TAM-induced ABC-imKO (G) and noninduced (vehicle) ABC-imKO (H) mice (n = 6 per group); data from two independent experiments. (I and J) TLR4 dimerization (I) and lipid rafts (J) in CD11b+TEMEM119+ spinal microglia at day 8 in the groups shown in G and H. Mean ± SEM (n = 7 or 8) from two independent experiments. *, P < 0.05; **, P < 0.01; ***, P < 0.001. Two-way ANOVA with Bonferroni post hoc test for multiple comparisons in time course analysis; t test for two groups, and one-way ANOVA with Tukey post hoc test for multiple comparisons of more than two groups. sac, sacrificed.
Figure S3.
Figure S3.
Validation of ABCA1 and ABCG1 KO in spinal microglia of tamoxifen-induced ABC-imKO mice. (A–D) Immunohistochemistry of spinal cord frozen sections from vehicle- and tamoxifen-induced ABC-imKO mice, showing colocalization (COLOC) of ABCA1 and ABCG1 staining with IBA1 (microglia), NeuN (neurons), and GFAP (astrocytes). Slides were mounted with Prolong Gold with DAPI. Confocal images were acquired with a 63× objective and analyzed with ImageJ software for colocalization. Colocalization masks and Pearson’s R values, Manders’ colocalization coefficients above threshold, and randomization Costes P values were calculated as described in Materials and methods for at least one slide for each animal in the experiment. Representative images and values shown correspond to one animal per condition. Scale bar, 50 µm.
Figure S4.
Figure S4.
Tamoxifen WT controls for LPS- and CIPN-induced allodynia and RNA-seq data for ABC-imKO–dependent regulated genes and cisplatin effect on ABC-imKO versus WT mice. (A and B) As a control for ABC-imKO mice, in-house–bred WT littermate mice were subjected to the tamoxifen regimen (TAM, 200 µl/d, 10 mg/ml, 5 consecutive days), followed by i.t. injection of AIBP (0.5 µg/5 µl) or saline (5 µl) and i.t. LPS (0.1 µg/5 µl) 2 h later (n = 4 for i.t. saline and n = 5 for i.t. AIBP; A) and i.p. injections of cisplatin (2.3 mg/kg) on day 1 and day 3, followed by i.t. injection of AIBP (0.5 µg/5 µl) or saline (5 µl) on day 7 (n = 4 per group; B). Tactile allodynia (withdrawal thresholds) was measured using von Frey filaments. Mean ± SEM; *, P < 0.05. Two-way ANOVA with Bonferroni post hoc test for multiple comparisons in time course analysis. (C) ABC-imKO mice were injected with TAM and then cisplatin as above, followed by i.t. saline (5 µl), AIBP (0.5 µg/5 µl), or 2-hydroxypropyl-β-cyclodextrin (hp-β-CD; 0.25 mg/5 µl) on day 7. Shown are tactile thresholds 24 h after the i.t. injection. Mean ± SEM (n = 3 or 4 per group). **, P < 0.01. One-way ANOVA with Dunnett's multiple comparisons test. (D) Heatmap of differentially regulated genes across all conditions (naive, induced by cisplatin/saline or cisplatin/AIBP) regulated in an ABC-imKO manner. All significant genes from LRT using a reduced model without interaction term (condition: genotype). Log2 normalized gene counts scaled by row and columns represent all technical replicates of the two or three biological samples from each group. (E) Heatmap of pathway enrichment of cisplatin up-regulated genes in WT and ABC-imKO microglia using cutoff P < 0.05, enrichment >1.5, and a minimum overlap of three genes in the pathway. Heatmap depicts common and specific pathways enriched by cisplatin in both genotypes. ATPase, adenosine triphosphatase; cisp, cisplatin; rRNA, ribosomal RNA; UTR, untranslated region; HDR, homology-directed repair; LSU, large subunit; GMP, guanosine monophosphate; TC-NER, transcription-coupled nucleotide excision repair; SLC, solute carrier.
Figure 6.
Figure 6.
Gene expression in spinal microglia of ABC-imKO mice. Microglia (CD11b+TEMEM119+) were FACS-sorted from three groups of ABC-imKO mice: naive or injected with cisplatin (days 1 and 3), followed on day 7 by i.t. saline (5 µl) or AIBP (0.5 µg/5 µl), and terminated on day 8; n = 3 biological replicates (each biological replicate collapsed from three technical replicates). RNA-seq datasets from ABC-imKO and WT (not littermates) mice were acquired in the same experiment. (A) Top: Overlapping genes (purple lines) and pathways (blue lines) induced in naive ABC-imKO microglia and shared with WT microglia in mice treated with cisplatin showed in purple lines connecting overlapping genes and in blue lines connecting the overlapping enriched pathways. Bottom: Venn diagram of up-regulated genes in spinal microglia from WT cisplatin and ABC-imKO naive mice. (B) Enrichment pathway analysis of up- and down-regulated genes induced by ABCA1 and ABCG1 knockdown in microglia, using cutoff P < 0.05, enrichment >1.5, and a minimum overlap of three genes in the pathway. (C) DEGs in naive spinal microglia of TAM-induced ABC-imKO mice. Adjusted P < 0.05 and Benjamini–Hochberg FDR <5%. (D) Overlapping genes and pathways induced by cisplatin treatment in ABC-imKO microglia and shared with WT microglia in mice treated with cisplatin. (E) DEGs in spinal microglia of cisplatin-treated, TAM-induced ABC-imKO mice compared with cisplatin-treated WT mice. Adjusted P < 0.05 and Benjamini–Hochberg FDR <5%. (F and G) Heatmap of DEGs up-regulated (F) or down-regulated (G) in ABC-imKO microglia either in naive or cisplatin condition. cisp, cisplatin.
Figure S5.
Figure S5.
Validation of AIBP KO in spinal microglia of tamoxifen-induced AIBP-imKO mice and BE-1 mAb for AIBP detection. (A) Immunohistochemistry of spinal cord frozen sections from vehicle- and tamoxifen-induced AIBP-imKO mice showing colocalization (COLOC) of AIBP staining with IBA1 (microglia), NeuN (neurons), and GFAP (astrocytes). Slides were mounted with Prolong Gold with DAPI. Confocal images were acquired with a 63× objective and analyzed with ImageJ software for colocalization. Colocalization masks and Pearson’s R values, Manders’ colocalization coefficients, and randomization Costes’ P values were calculated as described in Materials and methods for at least one slide for each animal in the experiment. Representative images and values shown correspond to one animal per condition. Scale bar, 50 µm. (B) Sandwich ELISA using BE-1 as a capture antibody in a microtiter plate. Dose-response curves to wtAIBP and mutAIBP were detected using a rabbit polyclonal anti-AIBP antibody. Mean ± SEM. No statistical differences were found for BE-1 affinity to wtAIBP and mutAIBP using two-way ANOVA with Bonferroni post hoc test for multiple comparisons. RLU, relative light units.
Figure 7.
Figure 7.
Microglial reprogramming by AIBP is dependent on ABCA1/ABCG1 expression. (A) Venn diagram comparing the effect of AIBP treatment on gene expression in WT and ABC-imKO mice in which CIPN was induced by cisplatin. (B) Volcano plot representation of up- and down-regulated genes by AIBP treatment in CIPN comparing AIBP effect on ABC-imKO versus WT mice. Cutoff of adjusted P < 0.05 and absolute fold change >1.5 shown in light green dots. (C) Heatmap of log2 normalized gene counts of inflammatory genes altered by AIBP in an ABC-dependent manner (down-regulated by AIBP in WT microglia but up-regulated by AIBP in ABC-imKO. (D) Heatmap of cholesterol synthesis and LXR-related genes comparing cisplatin and AIBP effect in WT and ABC-imKO. (E) Heatmap of noninflammatory genes regulated by AIBP in an ABC-dependent manner. (F) Enrichment pathway analysis of up-regulated genes by AIBP in ABC-imKO microglia, using cutoff P < 0.05, enrichment >1.5, and a minimum overlap of three genes in the pathway. Black arrows highlight cholesterol-related pathways and signaling pathway related to neurotransmitter regulation. cisp, cisplatin.
Figure 8.
Figure 8.
Endogenous AIBP and TLR4 in microglia are important in nociception. (A) Experimental design and timeline. Tamoxifen (TAM, 10 mg/ml, 200 µl/d), cisplatin (2.3 mg/kg/d), AIBP (0.5 µg/5 µl), and saline (5 µl). (B) Baseline (day 0 in A) withdrawal thresholds before the start of cisplatin intervention. Mean ± SEM (n = 15 for vehicle-treated and n = 16 for TAM-treated AIBP-imKO mice and n = 8 for littermates Apoa1bpfl/fl no-Cre [WT] mice treated with TAM). (C) WT and Cx3cr1-CreERT2 (no floxed genes) mice were tested for withdrawal threshold before (naive, day −7 in A timeline) and after (TAM, day 0) tamoxifen injection regimen (10 mg/ml, 200 µl/d for 5 d). n = 5 per group. One animal was found dead for WT +TAM group. No statistical differences were found. (D-F) Withdrawal thresholds following i.p. cisplatin and i.t. saline or AIBP injections in TAM-induced AIBP-imKO mice (D; n = 6 or 7, data from two independent experiments), noninduced (vehicle) AIBP-imKO mice (E; n = 4 or 5, data from two independent experiments), and bred in-house whole-body AIBP KO mice (F; n = 4 per group). (G) Withdrawal thresholds in WT and tamoxifen-induced TLR4-imKO mice following cisplatin injections (n = 4 for bred in-house WT and n = 7 for TLR4-imKO mice). Mean ± SEM; *, P < 0.05; **, P < 0.01. Two-way ANOVA with Bonferroni post hoc test for multiple comparisons in grouped analyses; one-way ANOVA with Tukey post hoc test for multiple comparisons of more than two groups. sac, sacrificed.
Figure 9.
Figure 9.
Identification of the domain in the AIBP molecule responsible for TLR4 binding. (A) Human AIBP: signal peptide (aa 1–24), previously uncharacterized N-terminal domain (aa 25–51), and YjeF_N domain (aa 52–288). (B) Flag-tagged deletion mutants of human AIBP were coexpressed in HEK293 cells with the Flag-tagged eTLR4. Cell lysates were immunoprecipitated (IP) with an anti-TLR4 antibody and immunoblotted (IB) with an anti-Flag antibody. (C) His-tagged human (Hu), mouse (Mo), and zebrafish (Zf) AIBP, all lacking the signal peptide expressed in a baculovirus/insect cell system, were combined in a test tube with eTLR4-His, followed by IP with an anti-TLR4 antibody and IB with an anti-His antibody. (D–H) Binding of His-tagged WT (wt, 25–288 aa) and the deletion mutant (mut, 52–288 aa) human AIBP to eTLR4, APOA1, and microglia. IP of eTLR4 and wtAIBP or mutAIBP in a test tube with an anti-AIBP antibody; blot and quantification from three independent experiments (D). ELISA with plates coated with eTLR4 and incubated with wtAIBP or mutAIBP (n = 3; E). ELISA with plates coated with BSA, wtAIBP, or mutAIBP and incubated with APOA1 (F). Flow cytometry (n = 6; F) and confocal imaging (G) showing binding of wtAIBP and mutAIBP (2 µg/ml) to BV-2 microglia cells, unstimulated or treated for 15 min with LPS (100 ng/ml). Detection with an anti-His antibody (flow) and an anti-TLR4 antibody (imaging). Scale bar, 10 µm. Mean ± SEM. ***, P < 0.001. Two-way ANOVA with Bonferroni post hoc test for multiple comparisons in time course analysis; t test for two groups; and one-way ANOVA with Tukey post hoc test for multiple comparisons of more than two groups. a.u., arbitrary units; ctrl, control.
Figure 10.
Figure 10.
Intrathecal delivery of AIBP lacking the TLR4-binding domain cannot alleviate CIPN allodynia. (A and B) TLR4 dimerization (A) and lipid rafts (B) in BV-2 cells pretreated with wtAIBP or mutAIBP (0.2 µg/ml) and stimulated with 100 ng/ml LPS for 15 min. Mean ± SEM (n = 7 for control group, n = 5 for mutAIBP group, n = 9 for LPS group, and n = 8 for wtAIBP group in TLR4 dimerization analysis; n = 8 for control group and n = 13 for mutAIBP, LPS, and wtAIBP group in lipid rafts analysis; data from two independent experiments). (C) Withdrawal thresholds in WT mice that received i.t. AIBP (0.5 µg/5 µl) or saline (5 µl), followed by i.t. LPS (0.1 µg/5 µl); n = 5 per group. (D) Withdrawal thresholds in WT mice in response to i.p. cisplatin (2.3 mg/kg/d), followed by i.t. wtAIBP (0.5 µg/5 µl), mutAIBP (0.5 µg/5 µl), or saline (5 µl). Naive mice did not receive any injections (n = 7 for naive group, n = 8 for wtAIBP and mutAIBP group, n = 9 for i.t. saline group; data from two independent experiments). (E and F) TLR4 dimerization (E) and lipid rafts (F) in CD11b+/TMEM119+ microglia from lumbar spinal cord of mice in experimental groups shown in D, at day 21 (n = 7–9; data from two independent experiments). Mean ± SEM. *, P < 0.05; **, P < 0.01; ***, P < 0.005. Two-way ANOVA with Bonferroni post hoc test for multiple comparisons in time course analysis; and one-way ANOVA with Tukey post hoc test for multiple comparisons of more than two groups. (G) Diagram illustrating the effect of CIPN and AIBP treatment on microglia gene expression and lipid droplet accumulation. Black dots in the plasma membrane and the ER depict cholesterol. DAMPs, disease-associated molecular patterns.

Similar articles

Cited by

References

    1. Ahn, J.H., Cho H., Kim J.H., Kim S.H., Ham J.S., Park I., Suh S.H., Hong S.P., Song J.H., Hong Y.K., et al. . 2019. Meningeal lymphatic vessels at the skull base drain cerebrospinal fluid. Nature. 572:62–66. 10.1038/s41586-019-1419-5 - DOI - PubMed
    1. Akashi, S., Saitoh S., Wakabayashi Y., Kikuchi T., Takamura N., Nagai Y., Kusumoto Y., Fukase K., Kusumoto S., Adachi Y., et al. . 2003. Lipopolysaccharide interaction with cell surface Toll-like receptor 4-MD-2: higher affinity than that with MD-2 or CD14. J. Exp. Med. 198:1035–1042. 10.1084/jem.20031076 - DOI - PMC - PubMed
    1. Blasi, E., Barluzzi R., Bocchini V., Mazzolla R., and Bistoni F.. 1990. Immortalization of murine microglial cells by a v-raf/v-myc carrying retrovirus. J. Neuroimmunol. 27:229–237. 10.1016/0165-5728(90)90073-V - DOI - PubMed
    1. Brandolini, L., d’Angelo M., Antonosante A., Allegretti M., and Cimini A.. 2019. Chemokine Signaling in Chemotherapy-Induced Neuropathic Pain. Int. J. Mol. Sci. 20:2904. 10.3390/ijms20122904 - DOI - PMC - PubMed
    1. Bruno, K., Woller S.A., Miller Y.I., Yaksh T.L., Wallace M., Beaton G., and Chakravarthy K.. 2018. Targeting toll-like receptor-4 (TLR4)-an emerging therapeutic target for persistent pain states. Pain. 159:1908–1915. 10.1097/j.pain.0000000000001306 - DOI - PMC - PubMed

Publication types

Substances