. 2021 Jul 5;218(7):e20201763.
doi: 10.1084/jem.20201763. Epub 2021 May 10.

Uncovering a novel role of PLCβ4 in selectively mediating TCR signaling in CD8+ but not CD4+ T cells

Affiliations

Uncovering a novel role of PLCβ4 in selectively mediating TCR signaling in CD8+ but not CD4+ T cells

Miwa Sasai et al. J Exp Med. .

Abstract

Because of their common signaling molecules, the main T cell receptor (TCR) signaling cascades in CD4+ and CD8+ T cells are considered qualitatively identical. Herein, we show that TCR signaling in CD8+ T cells is qualitatively different from that in CD4+ T cells, since CD8α ignites another cardinal signaling cascade involving phospholipase C β4 (PLCβ4). TCR-mediated responses were severely impaired in PLCβ4-deficient CD8+ T cells, whereas those in CD4+ T cells were intact. PLCβ4-deficient CD8+ T cells showed perturbed activation of peripheral TCR signaling pathways downstream of IP3 generation. Binding of PLCβ4 to the cytoplasmic tail of CD8α was important for CD8+ T cell activation. Furthermore, GNAQ interacted with PLCβ4, mediated double phosphorylation on threonine 886 and serine 890 positions of PLCβ4, and activated CD8+ T cells in a PLCβ4-dependent fashion. PLCβ4-deficient mice exhibited defective antiparasitic host defense and antitumor immune responses. Altogether, PLCβ4 differentiates TCR signaling in CD4+ and CD8+ T cells and selectively promotes CD8+ T cell-dependent adaptive immunity.


Conflict of interest statement

Disclosures: H. Nagaoka reported personal fees from Ehime University outside the submitted work. E. Takashima reported personal fees from Ehime University outside the submitted work. No other disclosures were reported.

Figures

None
Graphical abstract
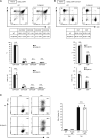
Figure 1.
Figure 1.
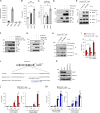
PLCβ4 is expressed in CD4+ and CD8+ T cells. (A) Quantitative PCR analysis of the levels of Plcb4 mRNA in the indicated cells. (B) Quantitative PCR analysis of the levels of Plcb4 mRNA in the indicated thymocytes and splenic CD8+ T cells. (C) Western blot analysis of PLCβ4 proteins in the indicated thymocytes and splenic CD8+ T cells. (D) Purified CD4+ or CD8+ T cells (2 × 10⁶ cells each) from WT or PLCβ4-deficient mice were lysed. PLCβ4 protein levels in the indicated lysates were determined by Western blotting with indicated Abs. (E) PLCβ4 protein levels in the indicated organs from WT or PLCβ4-deficient mice were determined by Western blotting with indicated Abs. Indicated values are means ± SD of three biological replicates (A). Data are representative two independent experiments (C–E) or cumulative of three independent experiments (B).
Figure S1.
Figure S1.
Generation of PLCβ4-deficient mice. (A) The gene-targeting strategy for Plcb4 locus using ES cells. (B) Southern blot analysis of total genomic DNA extracted from the WT or PLCβ4+/− ES cells. Genomic DNA was digested with EcoRI, electrophoresed, and hybridized with the radiolabeled probe indicated in (A). Southern blotting resulted in an 8-kb band for WT locus and a 2-kb band for mutated locus. Data are representative two independent experiments (B).
Figure S2.
Figure S2.
PLCβ4-deficient mice show intact T cell development and Th1 differentiation. (A) Percentages and cell numbers of CD4/CD8, CD4+/CD8, CD4/CD8+, and CD4+/CD8+ in the thymocytes from WT or PLCβ4-deficient mice were analyzed by flow cytometry. (B) Percentages and cell numbers of CD4+ and CD8+ T cells in the splenocytes from WT or PLCβ4-deficient mice were analyzed by flow cytometry. (C) Naive CD4+ T cells from WT or PLCβ4-deficient mice were cultured under Th1-polarizing conditions for 3 d. Frequencies of IFN-γ producers were determined by intracellular staining using flow cytometry. Indicated values are means ± SD of three biological replicates (A–C). N.S., nonsignificant.
Figure S3.
Figure S3.
Normal CD44/CD62L profiles of CD4+ and CD8+ T cells in PLCβ4-deficient or GNAQ-deficient mice. (A and B) Percentages of CD4+ (A) and CD8+ (B) T cells in the splenocytes from WT or PLCβ4-deficient mice were analyzed by flow cytometry. Indicated values are means ± SD of three biological replicates (A and B).
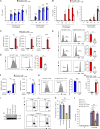
Figure 2.
Figure 2.
PLCβ4 deficiency exhibits impaired activation of CD8+ T cells, but not CD4+ T cells. (A and B) Purified CD4+ T cells (A) and CD8+ T cells (B) from WT and PLCβ4-deficient mice were stimulated with indicated doses of anti-CD3 and anti-CD28 for 72 h. Concentrations of IFN-γ and IL-2 in the culture supernatants were measured by ELISA. (C) Quantitative PCR analysis of the levels of Ifng, Il2, and Gzmb mRNA in WT or PLCβ4-deficient CD8+ T cells unstimulated or stimulated with anti-CD3 (5 µg/ml) and anti-CD28 (2 µg/ml) for 24 h. (D) CFSE-labeled WT or PLCβ4-deficient CD8+ T cells were stimulated with anti-CD3 (5 µg/ml)/anti-CD28 (2 µg/ml) for 3 d. The fluorescence intensity of CFSE-labeled CD8+ T cells was analyzed by flow cytometry. (E) Flow cytometry analysis of CD69, CD25, and CD62L in WT or PLCβ4-deficient CD8+ T cells stimulated with anti-CD3 (5 µg/ml) and anti-CD28 (2 µg/ml) for 6 h. (F) Quantitative PCR analysis of the levels of Ifng and Il2 mRNA in WT or PLCβ4-deficient CD4+ T cells unstimulated or stimulated with anti-CD3 (5 µg/ml) and anti-CD28 (2 µg/ml) for 24 h. (G) CFSE-labeled WT or PLCβ4-deficient CD4+ T cells were stimulated with anti-CD3 (5 µg/ml)/anti-CD28 (2 µg/ml) for 3 d. The fluorescence intensity of CFSE-labeled CD4+ T cells was analyzed by flow cytometry. (H) Purified CD8+ T cells from WT and PLCβ4-deficient mice were stimulated with PMA (50 ng/ml) and ionophore (1 µg/ml) for 72 h. Concentrations of IFN-γ in the culture supernatants were measured by ELISA. Med, medium. (I–L) Purified CD8+ T cells from WT or PLCβ4-deficient mice were retrovirally transduced with empty or Flp recombinase. (I) PLCβ4 protein levels in the indicated lysates were determined by Western blotting. (J and K) Frequencies of IFN-γ producers were determined by flow cytometry after stimulation with anti-CD3 (0.5 µg) and anti-CD28 (1 µg/ml). (L) Transduced cells were stimulated with anti-CD3 (0.5 µg) and anti-CD28 (1 µg/ml) for 72 h. Concentrations of IFN-γ in the culture supernatants were measured by ELISA. Indicated values are means ± SD of three biological replicates (A–L). **, P < 0.01; ***, P < 0.001; N.S., nonsignificant. Data are representative two (I) or three (J) independent experiments.
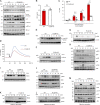
Figure 3.
Figure 3.
PLCβ4-deficient CD8+ T cells display impaired activation of signaling cascades downstream of IP3. (A) Purified CD8+ T cells from WT or PLCβ4-deficient mice were stimulated with anti-CD3 (5 µg) and anti-CD28 (2 µg/ml) for indicated times. Indicated proteins were detected by Western blotting using specific phospho- or nonphospho Abs. (B) Concentrations of PIP2 in the lysates of purified CD8+ T cells from WT and PLCβ4-deficient mice were measured by ELISA. (C) Purified CD8+ T cells from WT and PLCβ4-deficient mice were stimulated with indicated doses of anti-CD3 and anti-CD28 for 1 h and lysed. IP1 levels were determined by ELISA. (D) Purified CD8+ T cells from WT or PLCβ4-deficient mice were loaded with Fluo-8 AM and stimulated with anti-CD3 (1 µg), followed by cross-linking (arrowhead). Ca2+ flux was measured by flow cytometry. The x axis shows real-time Ca2+ release followed for 300 s, and the y axis shows the intensity of the increase in intracellular Ca2+ concentration. MFI, mean fluorescence intensity. (E–H) Purified CD8+ T cells from WT or PLCβ4-deficient mice were stimulated with anti-CD3 (5 µg) and anti-CD28 (2 µg/ml) for indicated times. (E) Dephosphorylation of NFAT1 was detected by Western blotting with ant-NFAT1. (F and G) The phosphorylation of PKCθ (F) and IκBα (G) was determined by Western blotting with indicated Abs. (H) Activation of ERK, p38, and JNK was detected by Western blotting using specific phospho- or nonphospho Abs. (I and J) Purified CD4+ T cells from WT or PLCβ4-deficient mice were stimulated with anti-CD3 (5 µg) and anti-CD28 (2 µg/ml) for various times. (I) The phosphorylation of PKCθ was determined by Western blotting with indicated Abs. (J) Activation of ERK and p38 was detected by Western blotting using specific phospho Abs. (K–M) Purified CD8+ T cells from WT or PLCβ4-deficient mice were stimulated with PMA (50 ng/ml) and ionophore (1 µg/ml) for indicated times. The phosphorylation of PKCθ (K), IκBα (L), and MAP kinases such as ERK, p38, and JNK (M) were detected by Western blotting using specific phospho Abs. Indicated values are means ± SD of three biological replicates (B and C). *, P < 0.05; ***, P < 0.001, N.S., nonsignificant. Data are representative of three (A and D–H) or two (I–M) independent experiments.
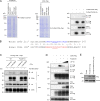
Figure 4.
Figure 4.
PLCβ4 binds to cytoplasmic tail of CD8α but not CD4. (A) Lysates of 293T cells transiently cotransfected with the indicated expression vectors were immunoprecipitated (IP) with anti-Flag and detected by Western blot (IB) with the indicated Abs. (B) Lysates of WT primary CD8+ T cells unstimulated or stimulated with anti-CD3 (5 µg/ml)/anti-CD28 (2 µg/ml) for 30 min were immunoprecipitated with the anti-CD8α or control IgG and detected by Western blot with the indicated Abs. (C) Schematic representation of various mutants of CD8α. (D and E) Lysates of 293T cells transiently cotransfected with Flag-tagged PLCβ4 and HA-tagged indicated mutants of CD8α vectors were immunoprecipitated with the anti-Flag and detected by Western blot with the indicated Abs. (F) Schematic representation of various mutants of PLCβ4. (G and H) Lysates of 293T cells transiently cotransfected with HA-tagged CD8α and Flag-tagged indicated deletion of PLCβ4 vectors were immunoprecipitated with the anti-Flag and detected by Western blot with the indicated Abs. (I and J) Purified CD8+ T cells from PLCβ4-deficient mice were retrovirally transduced with empty, PLCβ4 (WT), PLCβ4 (Δ920–940), or a catalytically inactive mutant of PLCβ4 (H328A/H377A) construct. The transduced cells were stimulated with anti-CD3 (0.5 µg) and anti-CD28 (1 µg/ml) for 72 h. Concentrations of IFN-γ in the culture supernatants were measured by ELISA. Indicated values are means ± SD of three biological replicates (I and J). **, P < 0.01; ***, P < 0.001. Data are representative three independent experiments (A, B, D, E, G, and H).
Figure S4.
Figure S4.
Assessment of possible competition between PLCβ4 and Lck in their interaction with CD8α. (A) Coomassie blue staining of the purified His-tagged recombinant PLCβ4-HA (left) and CD8α-Flag protein. The PLCβ4-HA (100 ng) and/or CD8α-Flag (100 ng) proteins were immunoprecipitated (IP) with anti-Flag and detected by Western blot (IB) with the indicated Abs. (B) Comparison of amino acid sequences for cytoplasmic tails of mouse and human CD8α. Colored or underlined amino acids denote the PLCβ4 binding region or the zinc clasp structure, respectively. (C) Lysates of WT or PLCβ4-deficient primary CD8+ T cells unstimulated or stimulated with anti-CD3 (5 µg/ml)/anti-CD28 (2 µg/ml) for 30 min were immunoprecipitated with anti-CD8α and detected by Western blot with the indicated Abs. (D) Lysates of 293T cells transiently cotransfected with the indicated expression vectors were immunoprecipitated with anti-Flag and detected by Western blot with the indicated Abs. WCL, whole cell lysates. (E) Purified CD8+ T cells from PLCβ4-deficient mice were transduced with empty, PLCβ4 (WT), or a catalytically inactive mutant of PLCβ4 (H328A/H377A) construct. Protein levels of PLCβ4 (WT) and mutant of PLCβ4 (H328A/H377A) in the indicated lysates were determined by Western blotting with indicated Abs. Data are representative of two (E) or three (A, C, and D) independent experiments.
Figure 5.
Figure 5.
The GNAQ-PLCβ4 axis is required for CD8+ T cell activation. (A) Quantitative PCR analysis of the expression of indicated GNA mRNA in WT CD8+ T cells. (B and C) Purified CD8+ T cells from WT (B) and PLCβ4-deficient (C) mice were transduced with empty, GNAQ, and GNA11 construct. The cells were stimulated with anti-CD3 (0.5 µg) and anti-CD28 (1 µg/ml) for 72 h. Concentrations of IFN-γ in the culture supernatants were measured by ELISA. (D, F, and G) Lysates of 293T cells transiently cotransfected with the indicated expression vectors were immunoprecipitated (IP) with anti-HA and detected by Western blot (IB) with the indicated Abs. (E and H) Lysates of WT primary CD8+ T cells unstimulated or stimulated with anti-CD3 (5 µg/ml)/anti-CD28 (2 µg/ml) for 30 min were immunoprecipitated with anti-CD3ε or control IgG (E), and with anti-GNAQ or control IgG (H). The immunoprecipitated samples were detected by Western blot with the indicated Abs. (I) Purified CD8+ T cells from WT or PLCβ4-deficient mice were retrovirally transduced with empty, GNAQ (WT), or the constitutively active mutant of GNAQ (Q209L). The transduced cells were stimulated with anti-CD3 (0.5 µg/ml) and anti-CD28 (1 µg/ml) for 72 h. Concentrations of IFN-γ in the culture supernatants were measured by ELISA. (J) The gene-targeting strategy for Gnaq locus by Cas9-mediated genome editing. Target sequences for gRNA were designed in the fourth exons of the Gnaq gene. Chr, chromosome. (K) WT and GNAQ-deficient tail fibroblasts were lysed, and the lysates were detected by Western blotting with the indicated Abs. (L and M) Purified CD8+ T cells (L) and CD4+ T cells (M) from WT and GNAQ-deficient mice were stimulated with indicated doses of anti-CD3 and anti-CD28 for 72 h. Concentrations of IFN-γ and IL-2 in the culture supernatants were measured by ELISA. Indicated values are means ± SD of three biological replicates (A–C, I, L, and M). **, P < 0.01; ***, P < 0.001; N.S., nonsignificant. Data are representative two (K) or three (D–H) independent experiments.
Figure 6.
Figure 6.
GNAQ-induced PLCβ4 phosphorylation is important for CD8+ T cell activation. (A) 293T cells transiently cotransfected with HA-tagged WT PLCβ4 and Flag-tagged GNAQ (Q209L) were subjected to immunoprecipitation with anti-HA antibody followed by tryptic digestion and LC-MS/MS analysis. The MS/MS spectrum suggested that phosphorylation of PLCβ4 occurs at T886 and S889, S890, or S891. (B–D) 293T cells transiently cotransfected with HA-tagged WT (B), T886A (C), or T886A/S889A, T886A/S890A, and T886A/S891A PLCβ4 (D) and Flag-tagged GNAQ (Q209L) or the empty vector were subjected to immunoprecipitation with anti-HA antibody followed by tryptic digestion. Phosphopeptides and nonphosphopeptides of the A883-K908 peptides were quantified by targeted MS using the parallel reaction monitoring method. It should be noted that the phosphopeptide was completely eliminated by T886A/S890A mutation. (E) Purified CD8+ T cells from PLCβ4-deficient mice were transduced with empty, PLCβ4 (WT), or PLCβ4 (T886A/S890A) construct. Protein levels of PLCβ4 (WT) and mutant of PLCβ4 (T886A/S890A) in the indicated lysates were determined by Western blotting with indicated Abs. (F) Purified CD8+ T cells from PLCβ4-deficient mice were retrovirally transduced with empty, PLCβ4 (WT), or mutant of PLCβ4 (T886A/S890A) construct. The transduced cells were stimulated with anti-CD3 (0.5 µg) and anti-CD28 (1 µg/ml) for 72 h. Concentrations of IFN-γ in the culture supernatants were measured by ELISA. Indicated values are means ± SD of three biological replicates (F). ***, P < 0.001. Data are representative of two independent experiments (A–E).
Figure 7.
Figure 7.
PLCβ4 is important for CD8+ T cell–mediated acquired immunity to OVA peptide. (A) Purified WT or PLCβ4-deficient OT-I CD8+ T cells were cocultured with WT BMDCs for 3 d at indicated ratios. Concentrations of IFN-γ in the culture supernatants were measured by ELISA. (B) CFSE-labeled WT or PLCβ4-deficient OT-I CD8+ T cells were adoptively transferred into WT mice, which were then injected subcutaneously with OVA (50 µg). After 2 d, the fluorescence intensity of CFSE-labeled OT-I CD8+ T cells in the spleen was analyzed by flow cytometry. (C) WT and PLCβ4-deficient mice were injected subcutaneously with OVA (50 µg) plus cGAMP (10 µg) on days 1 and 10. 10 d after the second immunization, the percentages and numbers of OVA-specific CD8+ T cells in the spleen from WT or PLCβ4-deficient mice were measured by flow cytometry. Indicated values are means ± SD of three biological replicates (A). **, P < 0.01; ***, P < 0.001; N.S., nonsignificant. Data are cumulative of four independent experiments (B and C).
Figure 8.
Figure 8.
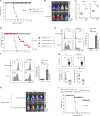
PLCβ4 is required for CD8+ T cell–mediated host defense against T. gondii. (A) WT or PLCβ4-deficient mice (n = 10 per group) were infected with 1 × 10⁵ T. gondii, and the survival rates were monitored for 20 d. P < 0.001 (WT vs. PLCβ4-deficient, log-rank test). (B) WT or PLCβ4-deficient mice (n = 4 per group) were infected with 1 × 10⁵ Pru T. gondii expressing luciferase, and the progress of infection was assessed by bioluminescence imaging on day 7 after infection. The color bar indicates photon emission during a 60-s exposure. Scale bar: 1 cm. p/cm2/s/sr: photon per square centimeter per second per steradian. (C) Quantification of parasites in indicated tissues from mice (n = 4 per group) on day 8 after infection using the standard curve (in Fig. S5 E). *, P < 0.05. (D) Survival analysis of PLCβ4fl/fl (n = 9), Lck-Cre/PLCβ4fl/fl (n = 9), Lyz2-Cre/PLCβ4fl/fl (n = 7), or PLCβ4-deficient (n = 5) mice after T. gondii infection. P < 0.001 (PLCβ4fl/fl vs. Lck-Cre/PLCβ4fl/fl, log-rank test); P < 0.001 (PLCβ4 KO vs. Lck-Cre/PLCβ4fl/fl, log-rank test). (E and F) WT or PLCβ4-deficient mice (n = 3 per group) were infected with 1 × 10⁵ T. gondii. After 5 d, the percentages of CD69+ (E) and CD62Llow (F) population on CD8+ T cells in the spleens from parasite-infected WT or PLCβ4-deficient mice were measured by flow cytometry. (G) WT or PLCβ4-deficient mice (n = 7 per group) were infected with 1 × 10⁵ OVA expressing irradiated T. gondii. 14 d after infection, the percentages and cell numbers of OVA tetramer-positive CD8+ T cells in the spleens from parasite-infected WT or PLCβ4-deficient mice were measured by flow cytometry. (H) Purified WT or PLCβ4-deficient CD8+ T cells were adoptively transferred into PLCβ4-deficient mice (n = 4 per group). Mice were infected with luciferase-expressing T. gondii, and the progress of the infection was assessed by bioluminescence imaging on day 7 after infection. Color scales indicate photon emission during a 60-s exposure. Scale bar: 1 cm. (I) Purified WT or PLCβ4-deficient CD8+ T cells were adoptively transferred into PLCβ4-deficient mice (n = 8 per group). Mice were infected with T. gondii, and the survival rates were monitored for 20 d. P < 0.001 (mice receiving WT CD8+ T cells vs. mice receiving PLCβ4-deficient CD8+ T cells, log-rank test). Indicated values are means ± SD of three biological replicates (E and F). *, P < 0.05; **, P < 0.01; N.S., nonsignificant. Data are cumulative (A, D, G, and I) or representative (B, C, and H) of three independent experiments.
Figure S5.
Figure S5.
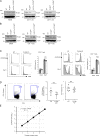
Generation of T cell– or myeloid-specific PLCβ4-deficient mice. (A and B) BMDM, CD4+, or CD8+ T cells from WT, PLC4β4fl/fl, Lyz2-Cre/PLCβ4fl/fl, or Lck-Cre/PLCβ4fl/fl mice were lysed. PLCβ4 protein levels in the indicated lysates were determined by Western blotting with indicated Abs. (C) WT or PLCβ4-deficient mice (n = 3 per group) were infected with 1 × 10⁵ T. gondii. After 5 d, the percentages of CD69+ (left) and CD62Llow (right) population on CD4+ T cells in the spleens from parasites infected WT or PLCβ4-deficient mice were measured by flow cytometry. (D) WT or PLCβ4-deficient mice (n = 6 per group) were infected with 1 × 10⁵ OVA expressing irradiated T. gondii. 14 d after infection, the percentages and cell numbers of OVA tetramer-positive CD4+ T cells in the spleens from parasite-infected WT or PLCβ4-deficient mice were measured by flow cytometry. (E) Luciferase activities of serial dilutions of Pru expressing luciferase (103–107) were plotted. A standard curve of luciferase activity (x axis) and parasite number (y axis) was generated by the data plots. Indicated values are means ± SD of three biological replicates (C). N.S., nonsignificant. Data are cumulative of three independent experiments (D) and representative of two (A, B) or three (E) independent experiments.
Figure 9.
Figure 9.
PLCβ4 is involved in antitumor CD8+ T cell response. (A) B16F10 melanoma cells (2 × 10⁵) were intravenously injected into WT (n = 10) or PLCβ4-deficient mice (n = 9), and the survival rates were monitored for 40 d. P = 0.022 (WT vs. PLCβ4-deficient, log-rank test). (B and C) B16F10 melanoma cells (2 × 10⁵) were intravenously injected into WT or PLCβ4-deficient mice (n = 12 per group). After 21 d, representative images of lungs from WT or PLCβ4-deficient mice (B) and the numbers of metastatic nodules in the lungs from WT or PLCβ4-deficient mice (C) are shown. Scale bar: 1 cm. (D) B16F10 melanoma cells (2 × 10⁵) were intravenously injected into WT or PLCβ4-deficient mice (n = 9 per group). After 14 d, the percentages of IFN-γ+ CD8+ T cells in the lungs from WT or PLCβ4-deficient mice were measured by intracellular staining. The percentages of CD44+ population on CD8+ T cells in the lungs from WT or PLCβ4-deficient mice were measured by flow cytometry. (E) Schematic of the GNAQ-PLCβ4 axis in CD8+ T cell TCR signaling. **, P < 0.01; ***, P < 0.001; N.S., nonsignificant. Data are cumulative (A, C, D) or representative (B) of three independent experiments.

Similar articles

Cited by

References

    1. Anderson, D.L., and Tsoukas C.D.. 1989. Cholera toxin inhibits resting human T cell activation via a cAMP-independent pathway. J. Immunol. 143:3647–3652. - PubMed
    1. Artyomov, M.N., Lis M., Devadas S., Davis M.M., and Chakraborty A.K.. 2010. CD4 and CD8 binding to MHC molecules primarily acts to enhance Lck delivery. Proc. Natl. Acad. Sci. USA. 107:16916–16921. 10.1073/pnas.1010568107 - DOI - PMC - PubMed
    1. Bando, H., Pradipta A., Iwanaga S., Okamoto T., Okuzaki D., Tanaka S., Vega-Rodríguez J., Lee Y., Ma J.S., Sakaguchi N., et al. . 2019. CXCR4 regulates Plasmodium development in mouse and human hepatocytes. J. Exp. Med. 216:1733–1748. 10.1084/jem.20182227 - DOI - PMC - PubMed
    1. Barnes, T.A., and Amir E.. 2017. HYPE or HOPE: the prognostic value of infiltrating immune cells in cancer. Br. J. Cancer. 117:451–460. 10.1038/bjc.2017.220 - DOI - PMC - PubMed
    1. Boothroyd, J.C. 2009. Toxoplasma gondii: 25 years and 25 major advances for the field. Int. J. Parasitol. 39:935–946. 10.1016/j.ijpara.2009.02.003 - DOI - PMC - PubMed

Publication types

Substances