. 2021 Jul 5;218(7):e20202733.
doi: 10.1084/jem.20202733. Epub 2021 May 10.

DNMT3A haploinsufficiency causes dichotomous DNA methylation defects at enhancers in mature human immune cells

Affiliations

DNMT3A haploinsufficiency causes dichotomous DNA methylation defects at enhancers in mature human immune cells

Jung-Yeon Lim et al. J Exp Med. .

Abstract

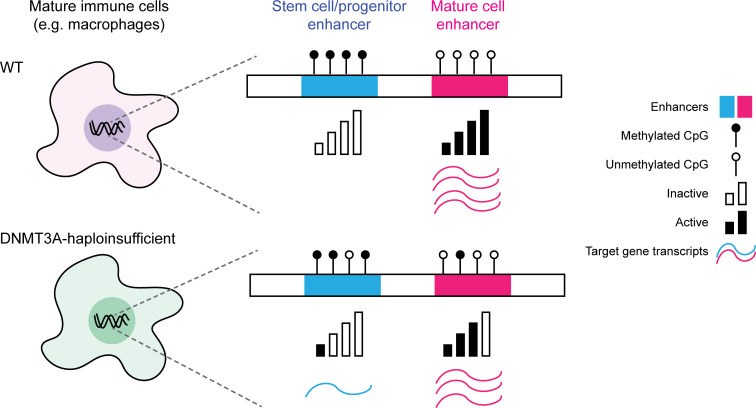
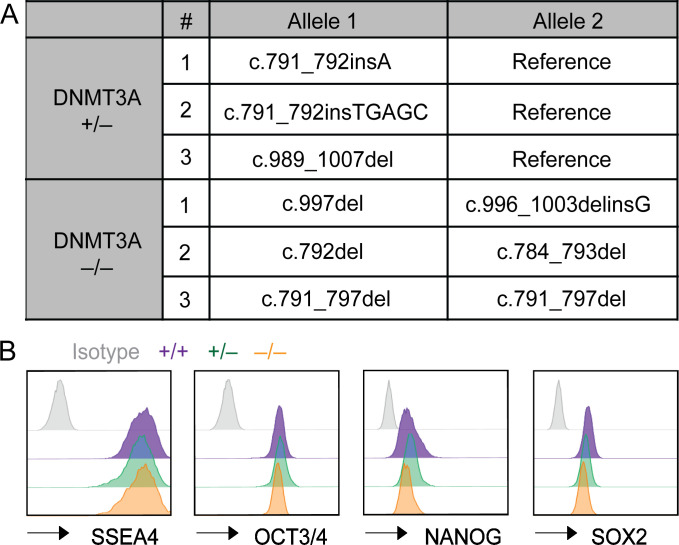
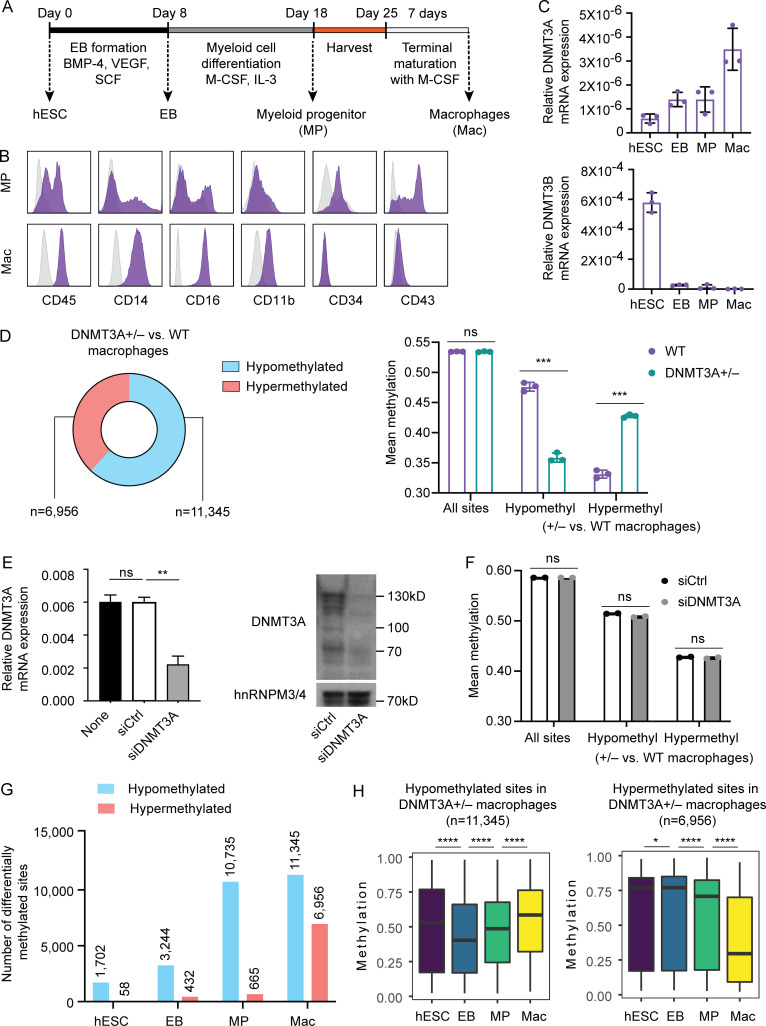
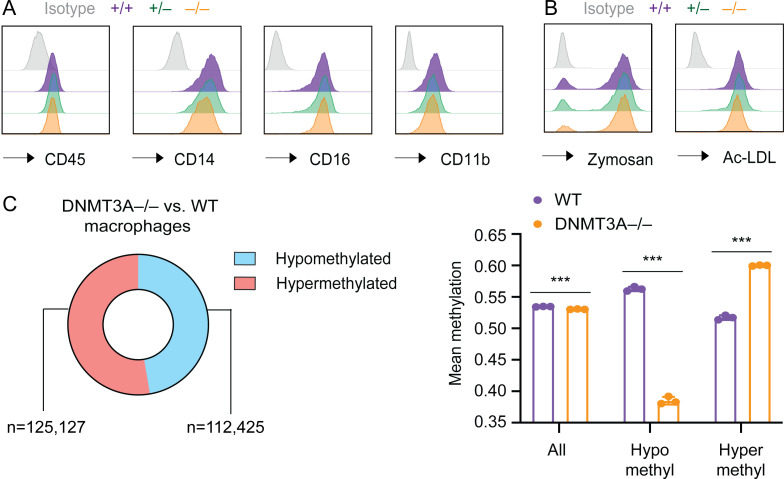
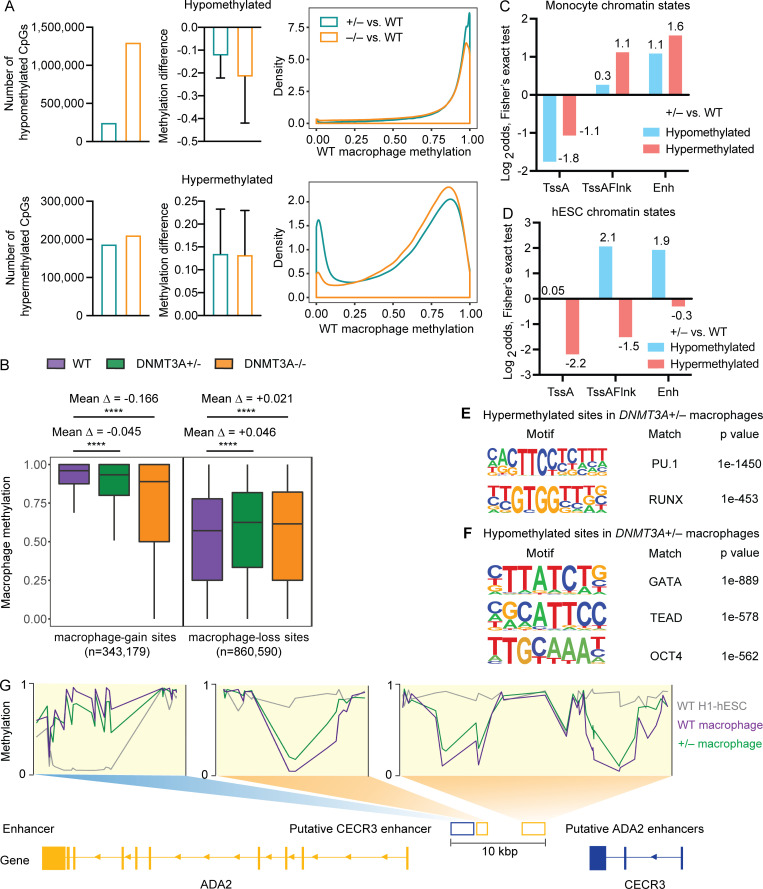
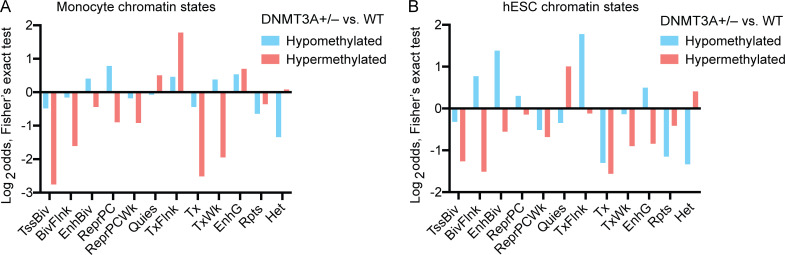
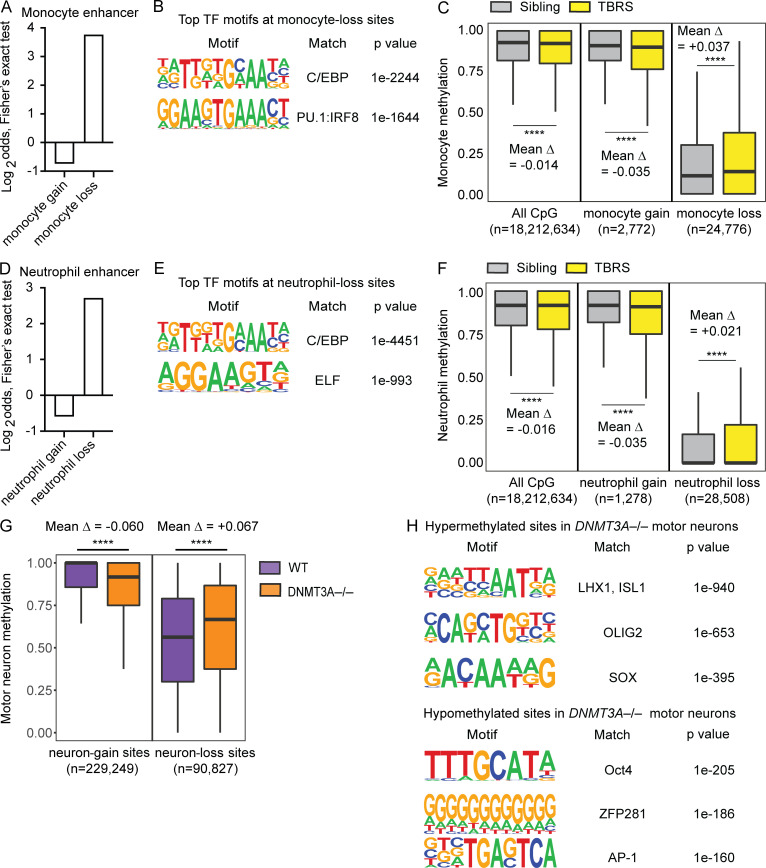
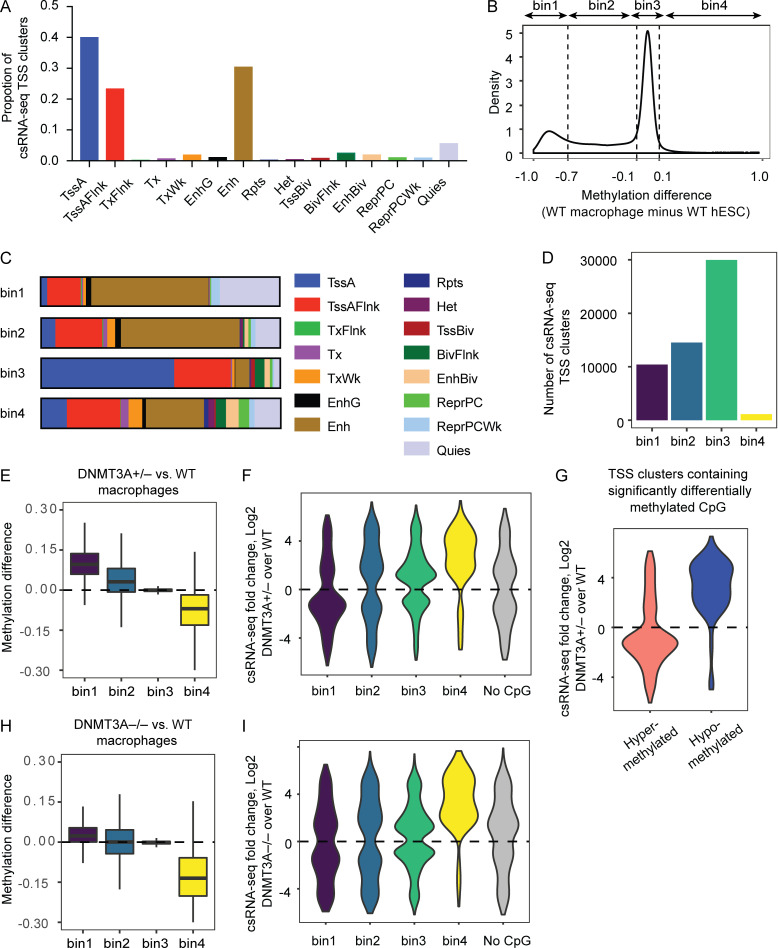
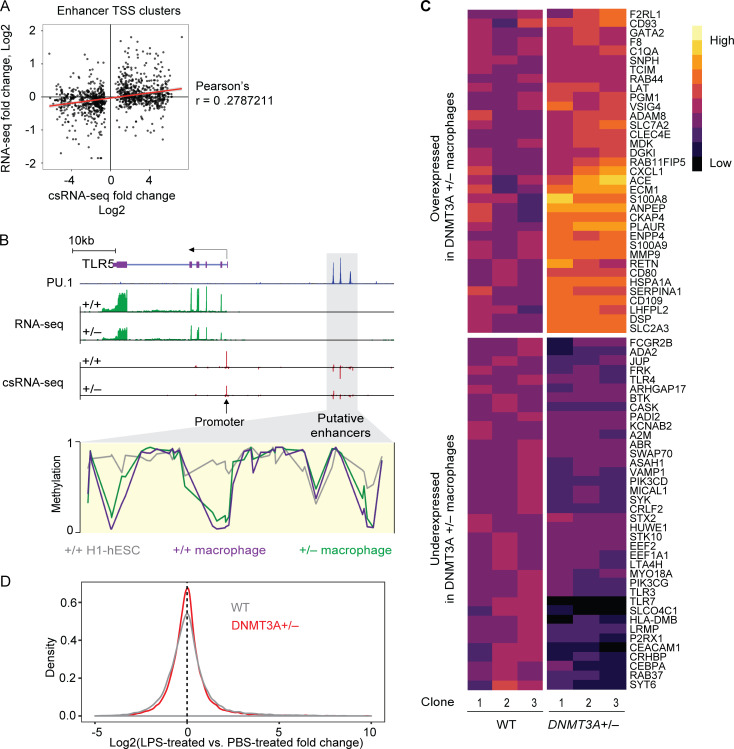
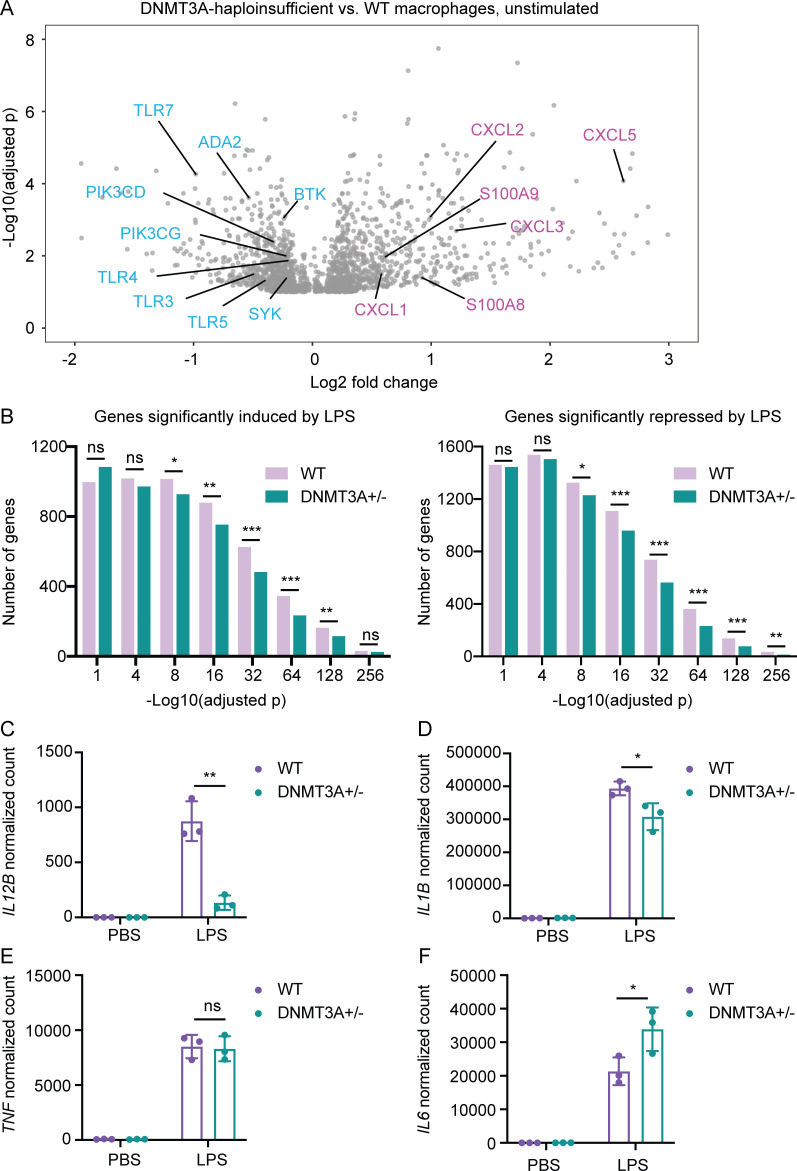
DNMT3A encodes an enzyme that carries out de novo DNA methylation, which is essential for the acquisition of cellular identity and specialized functions during cellular differentiation. DNMT3A is the most frequently mutated gene in age-related clonal hematopoiesis. As such, mature immune cells harboring DNMT3A mutations can be readily detected in elderly persons. Most DNMT3A mutations associated with clonal hematopoiesis are heterozygous and predicted to cause loss of function, indicating that haploinsufficiency is the predominant pathogenic mechanism. Yet, the impact of DNMT3A haploinsufficiency on the function of mature immune cells is poorly understood. Here, we demonstrate that DNMT3A haploinsufficiency impairs the gain of DNA methylation at decommissioned enhancers, while simultaneously and unexpectedly impairing DNA demethylation of newly activated enhancers in mature human myeloid cells. The DNA methylation defects alter the activity of affected enhancers, leading to abnormal gene expression and impaired immune response. These findings provide insights into the mechanism of immune dysfunction associated with clonal hematopoiesis and acquired DNMT3A mutations.


Conflict of interest statement

Disclosures: D.C. Fajgenbaum reported grants from EUSA Pharma and non-financial support from Pfizer outside the submitted work; in addition, D.C. Fajgenbaum had a patent for "Methods of Treating Idiopathic Multicentric Castleman Disease with JAK1/2 inhibition" pending (no licensee) and a patent for "Treatment of Castleman Disease" pending (no licensee). No other disclosures were reported.

Figures

None
Graphical abstract
Figure 1.
Figure 1.
Biochemical and functional characterization of DNMT3A haploinsufficiency in patient-derived cells. (A) Schematic diagram of the translated product of the DNMT3A isoform DNMT3A1 (ENST00000264709.7) with its functional domains. The somatic mutation identified in the iMCD patient is indicated. (B) Variant allele fraction (VAF) of the c.891G>A mutation in various cells and tissues from the patient was determined by digital droplet PCR. Each dot indicates an independent assay run. Error bars represent the SEM. (C) DNMT3A mRNA levels were determined by a TaqMan assay. GAPDH was used as an endogenous control. Each dot indicates an iPSC clone. Error bars represent the SEM. Data are representative of three independent experiments. ****, P < 0.0001 by Student’s t test. (D) DNMT3A protein levels were determined by immunoblotting using an antibody raised against an N-terminal peptide of DNMT3A. The * and # symbols indicate translated products of DNMT3A1 and DNMT3A2 (ENST00000380746.8) isoforms, respectively. A nuclear protein, hnRNPM3/4, was used as a loading control. Three WT and three mutant iPSC clones were tested. Data are representative of three independent experiments. (E) Mean DNA methylation levels of six WT and seven mutant iPSC clones as determined by the EPIC array. A total of 836,845 sites were included in the analysis. Each dot indicates an iPSC clone. Error bars represent the SEM. ***, P < 0.001 by Student’s t test. (F) Proportions of methylation sites that were significantly hypo- or hypermethylated in mutant iPSCs compared with WT controls. n, the total number of differentially methylated sites. ADD, Atrx-Dnmt3-Dnmt3l domain; B, B lymphocytes; BM, bone marrow; Gr, granulocytes; Hair, hair roots; Mo, monocytes; MTase, methyltransferase domain. T, T lymphocytes.
Figure S1.
Figure S1.
Expression levels of pluripotency markers in the iMCD patient-derived iPSCs. Expression levels of the indicated pluripotency markers in WT and mutant iPSC clones were determined with flow cytometry. Data for a representative clone for each genotype are shown.
Figure 2.
Figure 2.
Generation of hESC models of DNMT3A haploinsufficiency. (A) Schematic diagram of the DNMT3A1 transcript. Positions of the guide RNAs (gRNA) used for CRISPR-Cas9 targeting are indicated. Boxes indicate exons, and the numbers within the boxes are the exon numbers. Exons encoding the protein domains shown in Fig. 1 A are shaded with the matching colors. (B) DNMT3A mRNA levels in hESC clones with the indicated DNMT3A genotype were determined with a TaqMan assay. GAPDH was used as an endogenous control. Each dot indicates a clone. Error bars represent the SEM. Data are representative of five independent experiments. **, P < 0.01; ***, P < 0.001 by Student’s t test. (C) DNMT3A protein levels were assessed by immunoblotting using hnRNPM3/4 as a loading control. The * and # symbols indicate DNMT3A1 and DNMT3A2 isoforms, respectively. Data are representative of three independent experiments. (D) Mean DNA methylation levels of WT (DNMT3A+/+), DNMT3A+/−, and DNMT3A−/− hESC clones were determined with the EPIC array. A total of 821,449 sites were included in the analysis. Each dot indicates a clone. Error bars represent the SEM. *, P < 0.05; **, P < 0.01; ***, P < 0.001 by Student’s t test. (E) Proportions of methylation sites that were significantly hypo- or hypermethylated in mutant hESCs compared with WT controls . n, the total number of differentially methylated sites. UTR, untranslated region.
Figure S2.
Figure S2.
DNMT3A genotypes and expression levels of pluripotency markers in genome-edited hESCs. (A) Genotypes of DNMT3A-haploinsufficient and -null hESCs generated by CRISPR-Cas9 genome editing. (B) Expression levels of the indicated pluripotency markers were assessed with flow cytometry. Data for a representative clone for each DNMT3A genotype are shown.
Figure 3.
Figure 3.
DNMT3A haploinsufficiency causes dichotomous DNA methylation defects in mature macrophages. (A) Schematic of the macrophage differentiation protocol. (B) WT H1 hESC-derived MPs harvested at day 18 and macrophages harvested at day 32 were examined for expression of the indicated cell surface markers with flow cytometry. Gray histograms indicate isotype controls. Data are representative of two independent experiments. (C) Relative mRNA levels of DNMT3A and DNMT3B at the indicated differentiation stages were assessed by TaqMan gene expression assays. Eukaryotic 18S ribosomal RNA was used as an endogenous control. Each dot indicates a WT hESC clone and cells derived from it. Error bars represent the SEM. Data are representative of two independent experiments. (D) DNA methylation of macrophages differentiated from three WT, three DNMT3A+/−, and three DNMT3A−/− hESC clones were determined with the EPIC array. Proportions and numbers of hypo- or hypermethylated sites (left) and mean methylation (right) in DNMT3A-haploinsufficient macrophages compared with WT controls are shown. Each dot in the bar graph indicates a clone. Error bars represent the SEM. ns, P > 0.05; ***, P < 0.001 by Student’s t test. See Fig. S3 C for DNMT3A-null macrophage data. (E) DNMT3A levels in WT hESC-derived macrophages transfected with the indicated siRNAs were measured with a TaqMan gene expression assay (left) and immunoblotting (right) 5 d after transfection. siCtrl, a pool of nontargeting siRNAs; siDNMT3A, a pool of DNMT3A-targeting siRNAs. GAPDH was used as an endogenous control for the TaqMan assay. hnRNPM3/4 was used as a loading control for immunoblotting. Error bars represent the SEM. Data are representative of two independent experiments. ns, P > 0.05; **, P < 0.01 by Student’s t test. (F) DNA methylation in WT hESC-derived macrophages transfected with the indicated siRNAs for 5 d was assessed using the EPIC array. Mean methylation levels across the same methylation sites in D are shown. Each dot represents an independent transfection experiment. ns, P > 0.05 by Student’s t test.  (G) The numbers of hypo- or hypermethylated sites in DNMT3A-haploinsufficient cells compared with their WT counterparts (e.g., DNMT3A-haploinsufficient EB vs. WT EB) are shown. (H) Methylation levels of the hypo- or hypermethylated sites, as defined in D, in hESCs, EBs, MPs, and macrophages (all WT). *, P < 0.05; ****, P < 0.0001 by paired t test. BMP-4, bone morphogenetic protein 4; M-CSF, macrophage colony-stimulating factor; SCF, stem cell factor; VEGF, vascular endothelial growth factor.
Figure S3.
Figure S3.
Characterization of DNMT3A+/− and DNMT3A−/− hESC-derived macrophages. (A) Expression levels of the indicated cell surface markers were assessed with flow cytometry in macrophages derived from hESC clones with indicated DNMT3A genotype. (B) The ability to uptake fluorescently labeled zymosan and acetylated low-density lipoprotein (AcLDL) was assessed in the same set of cells as in A with flow cytometry. (C) Proportions and numbers of hypo- or hypermethylated sites (left) as well as mean methylation levels (right) in DNMT3A-null hESC-derived macrophages in comparison with WT controls are shown. Error bars represent the SEM. ***, P < 0.001 by Student’s t test.
Figure 4.
Figure 4.
Cell-type–specific enhancers are abnormally methylated in DNMT3A-haploinsufficient macrophages. (A) WGBS was performed for macrophages differentiated from three WT, three DNMT3A+/− and three DNMT3A−/− hESC clones. The number of significantly differentially methylated CpGs (left), the average difference in the methylation level (middle), and the distribution of WT macrophage methylation levels at hypo- and hypermethylated sites in DNMT3A+/− and DNMT3A−/− macrophages are shown. Error bars represent the SEM. (B) Methylation levels of WT, DNMT3A+/−, and DNMT3A−/− macrophages are compared at macrophage-gain sites and macrophage-loss sites. Mean Δ, mean differences in the methylation level. ****, P < 0.0001 by paired t test. (C) Two-sided Fisher’s exact test results (Log2odds) for enrichment/depletion of monocyte chromatin states in hypo- and hypermethylated sites in DNMT3A+/− macrophage are shown (P < 0.05 for all tests). TssA, active TSS; TssAFlnk, flanking active TSS; Enh, enhancers. Actual values used for plotting are shown near each column. (D) Same as C for hESC chromatin states. (E) Top two significant TF binding motifs enriched near (±100 bp) the hypermethylated sites in DNMT3A+/− macrophage. (F) Top three significant TF binding motifs enriched near (±100 bp) the hypomethylated sites in DNMT3A+/− macrophage. (G) Schematic of a locus on chromosome 22 containing two genes, ADA2 (chr22:17,179,304–17,221,989) and CECR3 (chr22:17,256,859–17,266,733). DNA methylation levels at the three intergenic enhancers in WT and DNMT3A+/− macrophages as well as WT H1-hESCs are shown. Putative CECR3 enhancer: GeneHancer GH22J017233 (chr22:17,233,077–17,236,254). Putative ADA2 enhancers: GeneHancer GH22J017236 (chr22:17,236,596–17,237,929) and GeneHancer GH22J017241 (chr22:17,241,402–17,244,449). All coordinates are from the GRCh38 assembly.
Figure S4.
Figure S4.
Association of cell-type–specific chromatin states with differentially methylated sites in DNMT3A-haploinsufficient macrophages. (A) Two-sided Fisher’s exact test results (Log2odds) for enrichment/depletion of monocyte chromatin states are shown (P < 0.05 for all tests). BivFlnk, flanking bivalent TSS/Enh; EnhBiv, bivalent enhancer; EnhG, genic enhancers; Het, heterochromatin; Quies, quiescent; ReprPC, repressed polycomb; ReprPCWk, weak repressed polycomb; Rpts, ZNF genes and repeats; TssBiv, bivalent/poised TSS; TxFlnk, transcribed at gene 5′ and 3′; Tx, strong transcription; TxWk, weak transcription. (B) Same as A for hESC chromatin states.
Figure 5.
Figure 5.
DNMT3A defects cause DNA hypermethylation at cell-type–specific enhancers in primary myeloid cells and hESC-derived neurons. Results of analyzing publicly available datasets: A–F (Spencer et al., 2017) and G and H (Ziller et al., 2018). (A) Two-sided Fisher’s exact test results (Log2odds) for enrichment/depletion of the monocyte enhancer chromatin state in monocyte-gain and monocyte-loss sites (P < 0.05 for both tests). (B) Top two significant TF binding motifs enriched near (±100 bp) the monocyte-loss sites. (C) Methylation levels of monocytes from a TBRS patient and his sibling are compared at all examined CpG, monocyte-gain, and monocyte-loss sites. The number of CpG sites included in each analysis and mean differences in the methylation level (Δ) are shown. ****, P < 0.0001 by paired t test. (D) Same as A for neutrophils. (E) Top two significant TF binding motifs enriched near (±100 bp) the neutrophil-loss sites. (F) Same as C for neutrophils. (G) Methylation levels of motor neurons differentiated from WT or DNMT3A−/− HUES64-hESCs are compared at neuron-gain and neuron-loss sites. The number of CpG sites included in each analysis and mean differences in the methylation level (Δ) are shown. ****, P < 0.0001 by paired t test. (H) Top three significant TF binding motifs enriched near (±100 bp) the hyper- or hypomethylated sites in DNMT3A−/− motor neurons.
Figure 6.
Figure 6.
DNA methylation defects alter enhancer activity. (A) Proportions of csRNA-seq TSS clusters in hESC-derived macrophage corresponding to indicated monocyte chromatin states. (B) DNA methylation levels of WT hESCs and WT hESC-derived macrophages were determined for each csRNA-seq TSS cluster (average of all CpGs within a given TSS cluster), and their differential is plotted as a density plot. (C) csRNA-seq TSS clusters grouped as in B were annotated based on monocyte chromatin states. (D) The number of csRNA-seq TSS clusters belonging to each bin is shown. (E) Differences in the methylation levels between DNMT3A-haploinsufficient macrophages and WT controls for each TSS-cluster bin. Positive y-axis values indicate hypermethylation in DNMT3A-haploinsufficient macrophages. (F) csRNA-seq TSS clusters differentially expressed (P < 0.05) in DNMT3A-haploinsufficient macrophages compared with WT macrophages are grouped based on their bin membership. The No CpG group represents TSS clusters devoid of CpGs. Positive y-axis values indicate increased expression/activity. (G) csRNA-seq fold changes of TSS clusters containing at least one CpG site significantly hyper- or hypomethylated in DNMT3A-haploinsufficient macrophages are plotted, regardless of their bin membership. (H) Same as E for DNMT3A-null macrophages. (I) Same as F for DNMT3A-null macrophages. BivFlnk, flanking bivalent TSS/Enh; EnhBiv, bivalent enhancer; EnhG, genic enhancers; Het, heterochromatin; Quies, quiescent; ReprPC, repressed polycomb; ReprPCWk, weak repressed polycomb; Rpts, ZNF genes and repeats; TssBiv, bivalent/poised TSS; TxFlnk, transcribed at gene 5′ and 3′; Tx, strong transcription; TxWk, weak transcription.
Figure S5.
Figure S5.
Transcriptomic characterization of DNMT3A-haploinsufficient macrophages. (A) Comparison of eRNA fold-changes (DNMT3A+/− over WT macrophages) as measured with csRNA-seq and mRNA fold-changes (DNMT3A+/− over WT macrophages) of nearest genes as measured with RNA-seq. (B) Schematic of a locus on chromosome 1 containing TLR5 (chr1:223,109,404–223,143,248). PU.1 chromatin immunoprecipitation sequencing data of blood monocyte-derived macrophages is from a published study (Heinz et al., 2018). RNA-seq and csRNA-seq data from hESC-derived macrophages with indicated DNMT3A genotype are shown in green and red, respectively. DNA methylation levels at putative TLR5 enhancers (gray box) in WT and DNMT3A+/− macrophages as well as WT H1-hESCs are shown. (C) A heatmap of genes with Gene Ontology term “myeloid leukocyte activation” (GO:0002274), expressed differentially between WT and DNMT3A-haploinsufficient macrophages. Each column indicates macrophages differentiated from an independent hESC clone. (D) The LPS-treated vs. PBS-treated gene expression fold-change distributions in WT and DNMT3A-haploinsufficient macrophages are shown in a density plot. The vertical dotted line indicates genes with no detectable expression difference between LPS- and PBS-treated conditions.
Figure 7.
Figure 7.
DNMT3A haploinsufficiency causes complex alterations in gene expression. (A) A volcano plot showing genes differentially expressed between DNMT3A-haploinsufficient macrophages and WT controls at steady state. Each gray dot represents a gene with adjusted P < 0.1. Representative genes overexpressed (pink) or underexpressed (blue) in DNMT3A-haploinsufficient macrophages compared with WT controls are labeled. Results are based on a pooled analysis of two independent RNA-seq experiments. Macrophages derived from three independent DNMT3A+/− and three WT hESC clones were included in each RNA-seq experiment. (B) Macrophages stimulated with either PBS or LPS for 4 h were subjected to RNA-seq. The numbers of significantly (adjusted P < 0.1) LPS-induced or LPS-repressed genes are plotted in histogram plots. Results are based on a pooled analysis of two independent RNA-seq experiments. ns, P > 0.05; *, P < 0.05; **, P < 0.01; ***, P < 0.001 by Fisher’s exact test. (C) Normalized counts of IL12B transcripts in hESC-derived macrophages stimulated with PBS or LPS for 4 h. Macrophages differentiated from three DNMT3A+/− and three WT hESC clones were included in the RNA-seq experiment. Each dot in the bar plot indicates a clone. A representative result of two independent RNA-seq experiments is shown. Error bars represent the SEM. **, P < 0.01 by Student’s t test. (D) Same as C for IL1B. *, P < 0.05 by Student’s t test. (E) Same as C for TNF. ns, P > 0.05 by Student’s t test. (F) Same as C for IL6. *, P < 0.05 by Student’s t test.

Similar articles

Cited by

References

    1. Andersson, R., Gebhard C., Miguel-Escalada I., Hoof I., Bornholdt J., Boyd M., Chen Y., Zhao X., Schmidl C., Suzuki T., et al. . 2014. An atlas of active enhancers across human cell types and tissues. Nature. 507:455–461. 10.1038/nature12787 - DOI - PMC - PubMed
    1. Arends, C.M., Galan-Sousa J., Hoyer K., Chan W., Jäger M., Yoshida K., Seemann R., Noerenberg D., Waldhueter N., Fleischer-Notter H., et al. . 2018. Hematopoietic lineage distribution and evolutionary dynamics of clonal hematopoiesis. Leukemia. 32:1908–1919. 10.1038/s41375-018-0047-7 - DOI - PubMed
    1. Aryee, M.J., Jaffe A.E., Corrada-Bravo H., Ladd-Acosta C., Feinberg A.P., Hansen K.D., and Irizarry R.A.. 2014. Minfi: a flexible and comprehensive Bioconductor package for the analysis of Infinium DNA methylation microarrays. Bioinformatics. 30:1363–1369. 10.1093/bioinformatics/btu049 - DOI - PMC - PubMed
    1. Baker, T.S., Gambino K.J., Schriefer L., Lim J.Y., Steinberg K.M., Fajgenbaum D.C., Martín García-Sancho A., and Byun M.. 2018. A novel FAS mutation with variable expressivity in a family with unicentric and idiopathic multicentric Castleman disease. Blood Adv. 2:2959–2963. 10.1182/bloodadvances.2018023911 - DOI - PMC - PubMed
    1. Bock, C., Kiskinis E., Verstappen G., Gu H., Boulting G., Smith Z.D., Ziller M., Croft G.F., Amoroso M.W., Oakley D.H., et al. . 2011. Reference Maps of human ES and iPS cell variation enable high-throughput characterization of pluripotent cell lines. Cell. 144:439–452. 10.1016/j.cell.2010.12.032 - DOI - PMC - PubMed

Publication types

MeSH terms

Substances