. 2021 May 10;17(5):e1008937.
doi: 10.1371/journal.pcbi.1008937. eCollection 2021 May.

Agent-based model provides insight into the mechanisms behind failed regeneration following volumetric muscle loss injury

Affiliations

Agent-based model provides insight into the mechanisms behind failed regeneration following volumetric muscle loss injury

Amanda M Westman et al. PLoS Comput Biol. .

Abstract

Skeletal muscle possesses a remarkable capacity for repair and regeneration following a variety of injuries. When successful, this highly orchestrated regenerative process requires the contribution of several muscle resident cell populations including satellite stem cells (SSCs), fibroblasts, macrophages and vascular cells. However, volumetric muscle loss injuries (VML) involve simultaneous destruction of multiple tissue components (e.g., as a result of battlefield injuries or vehicular accidents) and are so extensive that they exceed the intrinsic capability for scarless wound healing and result in permanent cosmetic and functional deficits. In this scenario, the regenerative process fails and is dominated by an unproductive inflammatory response and accompanying fibrosis. The failure of current regenerative therapeutics to completely restore functional muscle tissue is not surprising considering the incomplete understanding of the cellular mechanisms that drive the regeneration response in the setting of VML injury. To begin to address this profound knowledge gap, we developed an agent-based model to predict the tissue remodeling response following surgical creation of a VML injury. Once the model was able to recapitulate key aspects of the tissue remodeling response in the absence of repair, we validated the model by simulating the tissue remodeling response to VML injury following implantation of either a decellularized extracellular matrix scaffold or a minced muscle graft. The model suggested that the SSC microenvironment and absence of pro-differentiation SSC signals were the most important aspects of failed muscle regeneration in VML injuries. The major implication of this work is that agent-based models may provide a much-needed predictive tool to optimize the design of new therapies, and thereby, accelerate the clinical translation of regenerative therapeutics for VML injuries.


Conflict of interest statement

The authors have declared that no competing interests exist.

Figures
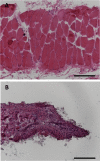
Fig 1
Fig 1
Histology of hematoxylin and eosin-stained rat latissimus dorsi skeletal muscle shows the cross-section of healthy muscle (A) and the cross-section 7 days after VML injury (B). The lack of muscle fibers on the right half of the image marks the defect caused by the VML injury. Scale bars = 200 μm.
Fig 2
Fig 2. ABM simulates muscle regeneration for 28 days following VML injury.
The spatial geometry of the ABM was defined by importing a histological image [9]. Then a VML injury was simulated by removing 12 fibers and creating an injury space, and replacing severed fibers at the edge of the injury and native muscle with necrotic elements. The ABM consisted of two regions–the healthy region of muscle fibers near the injury that were not affected by the defect and the border region consisted of fibers near the injury and the injury space. Regeneration was followed over time by tracking cell counts, muscle fiber counts, and collagen density in each region.
Fig 3
Fig 3. Flowchart depicts the ABM rules, logic flow, and agent actions.
After initialization, the growth factors and inflammatory cells are calculated during each subsequent time step. Then SSCs, fibroblasts, fibers, and ECM follow a probability-based decision tree to guide their actions.
Fig 4
Fig 4. ABM of VML injury regeneration without repair parameterized to capture experimentally reported cell population behaviors.
The model replicated an experimentally measured fold change in (A) the number of fibroblasts and myofibroblasts, (B) SSCs, and (C) M1 and M2 macrophages, within the model’s predicted 95% confidence interval. Model results were reported as mean ± 95% confidence interval. Aguilar et al. 2018 experimental data of fibroblasts and satellite cells reported as median ± standard deviation, and Garg et al. 2014 experimental data of macrophages reported as mean ± standard error mean [9,23].
Fig 5
Fig 5. ABM predictions of cell behaviors, muscle fiber, and ECM changes 7, 14, and 28 days after injury and treatment were compared with published experimental results.
Triangles represent an increase (blue), decrease (red), no change (grey), in response to the indicated treatment (i.e. Losartan with no repair, decellularized ECM, or MMG) or no quantified data available (striped) compared to VML injuries without repair (A). We compared quantitative changes in fibroblast, SSC, and pro-inflammatory macrophage numbers and compared qualitative changes in fibers and fibrosis in the VML defect. We also simulated VML injury treatments published in the literature and compared our model predictions to independent experimental results published in the literature: *[23], ° [11,13], #[9,13,35]. Graphical ABM outputs at 28 days showed that treating the VML injury with decellularized ECM resulted in fibrotic tissue (i.e. increased collagen) filling the defect (B) and minced muscle graft (MMG) treatment resulted in muscle fibers present in the defect (C).
Fig 6
Fig 6. Limiting the number of M1 macrophages in the no repair (NR) ABM did not alter the amount of fibrosis as indicated by collagen density nor result in new muscle fibers filling the defect.
The number of M1 macrophages was reduced to 50% and 75% of baseline levels. Outputs included fibroblast and myofibroblast fold changes, SSC fold changes, collagen density, macrophages fold changes, and number of new, regenerated fibers. Model results were reported as mean ± 95% confidence interval. Aguilar et al. 2018 experimental data of fibroblasts and SSCs reported as median ± standard deviation, and Garg et al. 2014 experimental data of M1 and M2 macrophages reported as mean ± standard error mean [9,23].
Fig 7
Fig 7. Limiting the number of fibroblasts in the no repair (NR) ABM reduced the number of fibroblasts and myofibroblasts following VML injury and altered the amount of fibrosis as indicated by collagen density.
The number of fibroblasts was reduced to 50% and 75% of baseline levels. Outputs included fibroblast and myofibroblast fold changes, SSC fold changes, collagen density, macrophages fold changes, and numbers of new, regenerated fibers. Reducing the number of fibroblasts to 50% or 75% of baseline increased the number of SSCs and impaired the rate and extent of collagen accumulation in the defect. None of the perturbations to fibroblasts resulted in new muscle fibers filling the defect. Model results were reported as mean ± 95% confidence interval. Aguilar et al. 2018 experimental data of fibroblasts and SSCs reported as median ± standard deviation, and Garg et al. 2014 experimental data of M1 and M2 macrophages reported as mean ± standard error mean [9,23].
Fig 8
Fig 8. Limiting the amount of growth factors produced by fibroblasts in the no repair (NR) ABM revealed that only a large reduction in TGF-β levels altered the collagen density following VML injury.
The levels of TGF-β (A), FGF (B), and IGF (C) were reduced to 25%, 50% and 75% below baseline levels, and fibroblast, SSC, and macrophage fold changes, collagen density, and counts of new, regenerated fibers were predicted. A 75% reduction of TGF-β secretion by fibroblasts increased the number of SSCs present and decreased the rate and amount of collagen accumulation (A). None of the perturbations resulted in new fibers filling the defect. Model results were reported as mean ± 95% confidence interval. Aguilar et al. 2018 experimental data of fibroblasts and SSCs reported as median ± standard deviation, and Garg et al. 2014 experimental data of M1 and M2 macrophages reported as mean ± standard error mean [9,23].
Fig 9
Fig 9. A combination of model parameters, reflecting the key biological aspects of failed regeneration in VML injuries, were adjusted in combination to determine how these perturbations affected collagen density and new muscle fiber infiltration into the defect.
In perturbation “A”, the maximum number of M1 macrophages and in perturbation “B”, the maximum number of fibroblasts were reduced to 75% of baseline levels. In perturbation “C”, SSC migration behaviors were adjusted such that SSCs preferred being in isolation on ECM as opposed to in their niche next to a fiber. Model perturbation D, which corresponded to the threshold for SSC differentiation into myofiber, was reduced so that SSC differentiation was more frequent. When perturbations, C and D, were implemented simultaneously, then there was a significant increase in the number of myotubes and new fibers. ** p < 0.01, statistical significance between groups using a one-way analysis of variance and Holm-Sidak post hoc test.
Fig 10
Fig 10. In model perturbation combinations i and vi, the number of new fibers correlated with the maximum number of SSCs.
In model combinations i, v, and vi, the maximum number of SSCs correlated with the maximum number of myotubes. In perturbation “A”, the maximum number of M1 macrophages and in perturbation “B”, the maximum number of fibroblasts were reduced to 75% of baseline levels. In perturbation “C”, SSC migration behaviors were adjusted such that SSCs preferred being in isolation on ECM as opposed to in their niche next to a fiber. Model perturbation D, which corresponded to the threshold for SSC differentiation into myofiber, was reduced so that SSC differentiation was more frequent. R2 values quantify the goodness of fit for linear regression. If R2 values are not shown, then the linear regression was a perfect line (R2 = 1). ROUT analysis was used to identify outliers for each model combination and three outliers were identified in combination vi.

References

    1. Chargé SB, Rudnicki MA. Cellular and molecular regulation of muscle regeneration. Physiol Rev 2004; 84:209–238. 10.1152/physrev.00019.2003 - DOI - PubMed
    1. Tidball JG, Villalta SA. Regulatory interactions between muscle and the immune system during muscle regeneration. Am J Physiol Regul Integr Comp Physiol 2010; 298:R1173–87. 10.1152/ajpregu.00735.2009 - DOI - PMC - PubMed
    1. Passipieri JA, Christ GJ. The potential of combination therapeutics for more complete repair of volumetric muscle loss injuries: The role of exogenous growth factors and/or progenitor cells in implantable skeletal muscle tissue engineering technologies. Cells Tissues Organs 2016; 202:202–213. 10.1159/000447323 - DOI - PubMed
    1. Karalaki M, Fili S, Philippou A, Koutsilieris M. Muscle regeneration: cellular and molecular events. In Vivo 2009; 23:779–96. - PubMed
    1. Carlson BM, Faulkner JA. The regeneration of skeletal muscle fibers following injury: a review. Med. Sci. Sports Exerc. 1983; 15:187–198. - PubMed

Publication types

MeSH terms