

Correlative fluorescence microscopy, transmission electron microscopy and secondary ion mass spectrometry (CLEM-SIMS) for cellular imaging
- PMID: 33970908
- PMCID: PMC8109779
- DOI: 10.1371/journal.pone.0240768
Correlative fluorescence microscopy, transmission electron microscopy and secondary ion mass spectrometry (CLEM-SIMS) for cellular imaging
Abstract
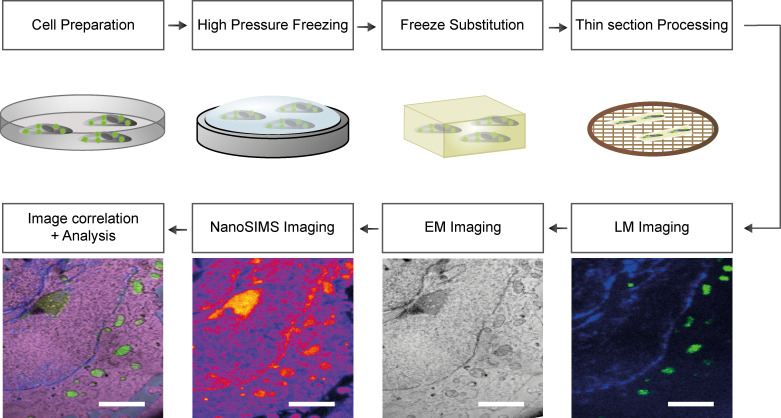
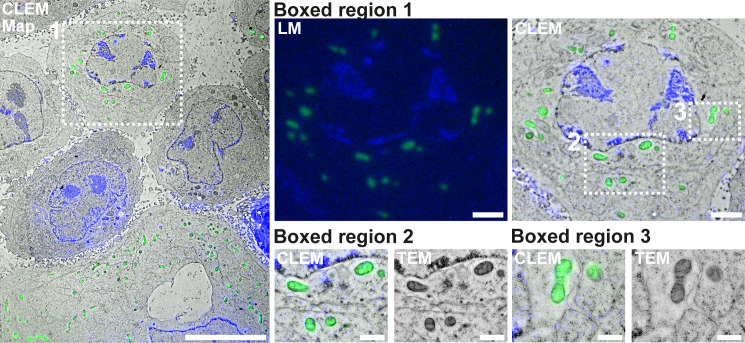
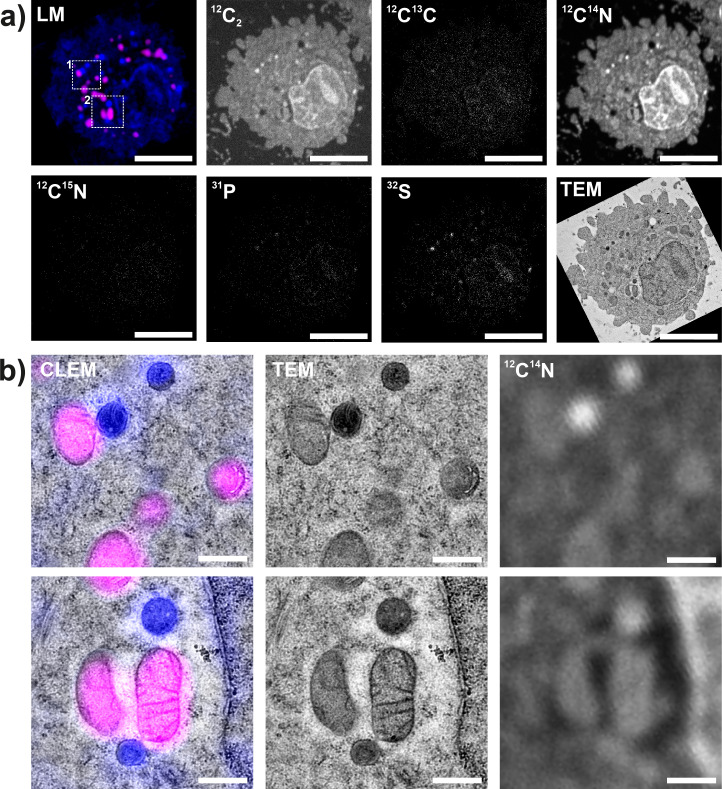
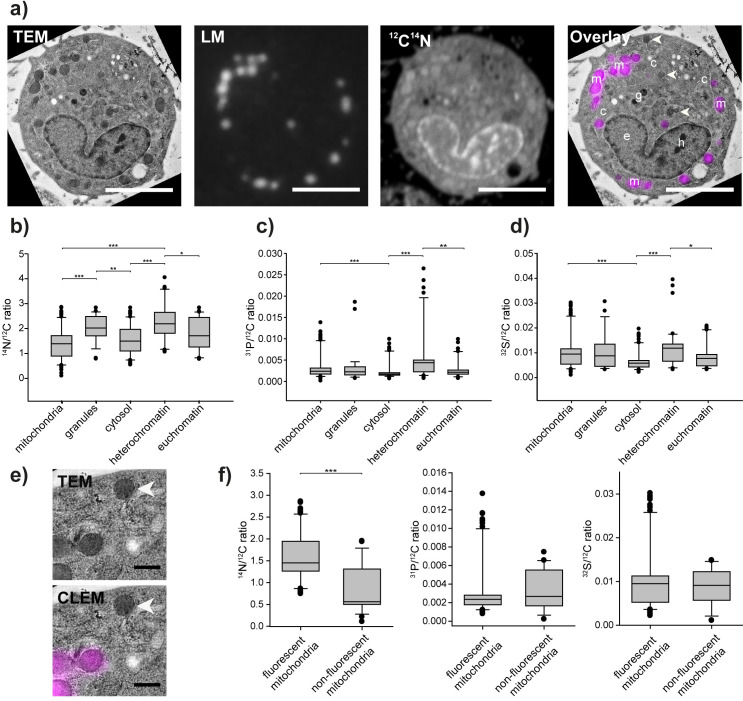
Electron microscopy (EM) has been employed for decades to analyze cell structure. To also analyze the positions and functions of specific proteins, one typically relies on immuno-EM or on a correlation with fluorescence microscopy, in the form of correlated light and electron microscopy (CLEM). Nevertheless, neither of these procedures is able to also address the isotopic composition of cells. To solve this, a correlation with secondary ion mass spectrometry (SIMS) would be necessary. SIMS has been correlated in the past to EM or to fluorescence microscopy in biological samples, but not to CLEM. We achieved this here, using a protocol based on transmission EM, conventional epifluorescence microscopy and nanoSIMS. The protocol is easily applied, and enables the use of all three technologies at high performance parameters. We suggest that CLEM-SIMS will provide substantial information that is currently beyond the scope of conventional correlative approaches.
Conflict of interest statement
The authors have declared that no competing interests exist.
Figures
Similar articles
-
3D HDO-CLEM: cellular compartment analysis by correlative light-electron microscopy on cryosection.Methods Cell Biol. 2012;111:95-115. doi: 10.1016/B978-0-12-416026-2.00006-6. Methods Cell Biol. 2012. PMID: 22857925
-
How to apply the broad toolbox of correlative light and electron microscopy to address a specific biological question.Methods Cell Biol. 2024;187:1-41. doi: 10.1016/bs.mcb.2024.02.030. Epub 2024 Mar 26. Methods Cell Biol. 2024. PMID: 38705621
-
High-vacuum optical platform for cryo-CLEM (HOPE): A new solution for non-integrated multiscale correlative light and electron microscopy.J Struct Biol. 2018 Jan;201(1):63-75. doi: 10.1016/j.jsb.2017.11.002. Epub 2017 Nov 4. J Struct Biol. 2018. PMID: 29113848
-
Towards correlative super-resolution fluorescence and electron cryo-microscopy.Biol Cell. 2016 Sep;108(9):245-58. doi: 10.1111/boc.201600008. Epub 2016 Jun 22. Biol Cell. 2016. PMID: 27225383 Free PMC article. Review.
-
Progress in analytical imaging of the cell by dynamic secondary ion mass spectrometry (SIMS microscopy).Biochim Biophys Acta. 2005 Aug 5;1724(3):228-38. doi: 10.1016/j.bbagen.2005.05.013. Biochim Biophys Acta. 2005. PMID: 15982822 Review.
Cited by
-
A Reliable Approach for Revealing Molecular Targets in Secondary Ion Mass Spectrometry.Int J Mol Sci. 2022 Apr 21;23(9):4615. doi: 10.3390/ijms23094615. Int J Mol Sci. 2022. PMID: 35563005 Free PMC article.
-
Chemical Imaging and Analysis of Single Nerve Cells by Secondary Ion Mass Spectrometry Imaging and Cellular Electrochemistry.Front Synaptic Neurosci. 2022 May 16;14:854957. doi: 10.3389/fnsyn.2022.854957. eCollection 2022. Front Synaptic Neurosci. 2022. PMID: 35651734 Free PMC article. Review.
-
Characterization and morphological methods for oral biofilm visualization: where are we nowadays?AIMS Microbiol. 2024 Jun 6;10(2):391-414. doi: 10.3934/microbiol.2024020. eCollection 2024. AIMS Microbiol. 2024. PMID: 38919718 Free PMC article. Review.
-
Antifungal activity of eumelanin-inspired indoylenepheyleneethynylene against Cryptococcus neoformans.Front Microbiol. 2024 Jan 16;14:1339303. doi: 10.3389/fmicb.2023.1339303. eCollection 2023. Front Microbiol. 2024. PMID: 38293553 Free PMC article.
-
Multiparametric physicochemical analysis of a type 1 collagen 3D cell culture model using light and electron microscopy and mass spectrometry imaging.Sci Rep. 2025 Mar 20;15(1):9578. doi: 10.1038/s41598-025-93700-3. Sci Rep. 2025. PMID: 40113888 Free PMC article.
References
Publication types
MeSH terms
Associated data
LinkOut - more resources
Full Text Sources
Other Literature Sources
Miscellaneous
