. 2021 May 10;19(5):e3001228.
doi: 10.1371/journal.pbio.3001228. eCollection 2021 May.

Sensitivity to expression levels underlies differential dominance of a putative null allele of the Drosophila tβh gene in behavioral phenotypes

Affiliations

Sensitivity to expression levels underlies differential dominance of a putative null allele of the Drosophila tβh gene in behavioral phenotypes

Christine Damrau et al. PLoS Biol. .

Abstract

The biogenic amine octopamine (OA) and its precursor tyramine (TA) are involved in controlling a plethora of different physiological and behavioral processes. The tyramine-β-hydroxylase (tβh) gene encodes the enzyme catalyzing the last synthesis step from TA to OA. Here, we report differential dominance (from recessive to overdominant) of the putative null tβhnM18 allele in 2 behavioral measures in Buridan's paradigm (walking speed and stripe deviation) and in proboscis extension (sugar sensitivity) in the fruit fly Drosophila melanogaster. The behavioral analysis of transgenic tβh expression experiments in mutant and wild-type flies as well as of OA and TA receptor mutants revealed a complex interaction of both aminergic systems. Our analysis suggests that the different neuronal networks responsible for the 3 phenotypes show differential sensitivity to tβh gene expression levels. The evidence suggests that this sensitivity is brought about by a TA/OA opponent system modulating the involved neuronal circuits. This conclusion has important implications for standard transgenic techniques commonly used in functional genetics.


Conflict of interest statement

The authors have declared that no competing interests exist.

Figures

Fig 1
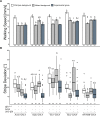
Fig 1. Differential dominance of the tβh mutation.
Homo-, hetero-, and hemizygous tβh mutants and their controls were tested in Buridan’s paradigm and the sugar sensitivity test. (A) Median walking speed in Buridan’s paradigm. Homozygous tβhnM18 mutants walk more slowly than the wild-type controls, while heterozygous mutants walk faster than wild type (2-way ANOVA followed by Tukey HSD post hoc test, p < 0.005). Hemizygous mutant males walk more slowly than wild-type males (Welch 2-sample t test, p < 0.005). (B) Stripe deviation, a measure of stripe fixation during walking, is reduced in homozygous tβhnM18 mutants compared to heterozygous mutants and wild type (paired Wilcoxon rank sum test with Bonferroni correction for repeated measurement, p < 0.005) as well as in hemizygous males compared to their wild-type control (Wilcoxon rank sum test, p < 0.005). (C) The total number of proboscis extension responses (PER) to a serial dilution of sucrose after 20 h of starvation is depicted. Homozygous and hemizygous tβhnM18 mutants respond less to sucrose compared to wild-type controls; heterozygous mutants are not statistically different from wild type but different from homozygous mutants. Significant differences are tested by paired Wilcoxon rank sum test with Bonferroni correction (p < 0.005). In (A), bars and error bars indicate mean and standard error of the mean. In (B) and (C), the Tukey boxplots represent the median (bar), 25%–75% quartiles (box), and total data range (whiskers) excluding outliers outside of 1.5× interquartile range (dots). Numbers below graphs indicate sample size. Bars and boxes labeled with different letters are statistically significantly different. Raw data and evaluation code available at doi: 10.5281/zenodo.4568550.
Fig 2
Fig 2. X-linked UAS-tβh expression cannot rescue the mutant Buridan phenotypes.
(A) Median walking speed cannot be rescued by heterozygous GAL4-UAS-dependent tβh expression in mutants. All groups are different from the wild-type control, except for the UAS-tβh control in the nSyb experiment (2-way ANOVA with Tukey HSD post hoc test and correction for multiple measurements, p < 0.005). (B) Stripe deviation performance is already increased by the presence of the GAL4 or UAS construct. Ubiquitous Actin-GAL4 or pan-neuronal nSyb-GAL4 expression worsens the phenotype compared to the control lines (paired Wilcoxon rank sum test with Bonferroni correction, p < 0.005). In (A), bars and error bars indicate mean and standard error of the mean. In (B), the Tukey boxplots represent the median (bar), 25%–75% quartiles (box), and total data range (whiskers) excluding outliers outside of 1.5× interquartile range (dots). Numbers below graphs indicate sample size. Bars and boxes labeled with different letters are statistically significantly different. Raw data and evaluation code available at doi: 10.5281/zenodo.4568550.
Fig 3
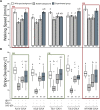
Fig 3. Autosomal UAS-tβh expression can rescue mutant Buridan phenotypes and phenocopy overdominance.
(A) Median walking speed can sometimes be rescued by heterozygous GAL4-UAS-dependent tβh expression in mutants. Only expression in all cells (Actin-GAL4) and exclusively in octopaminergic cells via NP7088-GAL4 leads to a full rescue (FR, red boxes) of the walking phenotype, characterized by significant differences of the experimental line (blue) from both mutant control groups (grey), but not from the wild-type control (white) (2-way ANOVA with Tukey HSD post hoc test and correction for multiple measurements, p < 0.005). (B) Stripe deviation performance is already increased by the presence of the UAS construct. Only the octopaminergic NP7088-GAL4 rescues the stripe fixation phenotype. Expression of the transgene in all cells (Actin-GAL4) and in non-neuronal tyraminergic cells (Tdc1-GAL4) leads to a partial rescue (PR, green boxes), characterized by the experimental group failing to reach significant differences from either the wild-type control or one of the mutant controls (paired Wilcoxon rank sum test with Bonferroni correction, p < 0.005). In (A), bars and error bars indicate mean and standard error of the mean. In (B), the Tukey boxplots represent the median (bar), 25%–75% quartiles (box), and total data range (whiskers) excluding outliers outside of 1.5× interquartile range (dots). Numbers below graphs indicate sample size. Bars and boxes labeled with different letters are statistically significantly different. Raw data and evaluation code available at doi: 10.5281/zenodo.4568550.
Fig 4
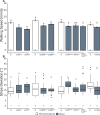
Fig 4. Acute and ubiquitous tβh expression rescues walking speed and sugar response but not stripe deviation.
Temporal control of tβh expression was achieved by inducing transcription with a heat shock (HStβh) 3 h before the test. (A) Median walking speed is increased beyond wild-type levels after tβh induction (2-way ANOVA followed by Tukey HSD post hoc test, p < 0.005, F = 69.8). (B) Stripe deviation is not affected by tβh induction. (C) Sugar response (proboscis extension response [PER]) is increased by tβh expression, but does not reach wild-type levels (paired Wilcoxon rank sum test with Bonferroni correction, p < 0.005; data already published in Damrau et al. [51]). In (A), bars and error bars indicate mean and standard error of the mean. In (B) and (C), the Tukey boxplots represent the median (bar), 25%–75% quartiles (box), and total data range (whiskers) excluding outliers outside of 1.5× interquartile range (dots). Numbers below graphs indicate sample size. Bars and boxes labeled with different letters are statistically significantly different. Raw data and evaluation code available at doi: 10.5281/zenodo.4568550.
Fig 5
Fig 5. Acute overexpression of tyramine and octopamine synthesis enzymes in wild-type background affects behavior in Buridan’s paradigm.
(A) Median walking speed is not affected when tβh is overexpressed in wild type 3 h before testing via hsp-tβh (Welch 2-sample t test, p < 0.005). (B) In contrast, stripe deviation is reduced when tβh is overexpressed (Wilcoxon rank sum test with correction for multiple measurements, p < 0.005). (C) Median walking speed is reduced after overexpression of Tdc2 (2-way ANOVA followed by Tukey HSD post hoc test, p < 0.005). (D) The 2 parental controls show very different stripe deviation behavior, which prevents the interpretation of the performance of the overexpression group (paired Wilcoxon rank sum test with Bonferroni correction, p < 0.005). In (A) and (C), bars and error bars indicate mean and standard error of the mean. In (B) and (D), the Tukey boxplots represent the median (bar), 25%–75% quartiles (box), and total data range (whiskers) excluding outliers outside of 1.5× interquartile range (dots). Numbers below graphs indicate sample size. Bars and boxes labeled with different letters are statistically significantly different. Raw data and evaluation code available at doi: 10.5281/zenodo.4568550.
Fig 6
Fig 6. Differential roles of tyramine and octopamine signaling in Buridan’s paradigm.
(A) oamb286, oamb584, Octβ2RΔ3.22, Octβ2RΔ4.3, honoka, and TyrRf05682 mutants and the double mutant TyrRII-TyrRΔ124 walk more slowly than their respective controls, while the walking speed of the TyrRIIΔ29 mutant is indistinguishable from that of wild type (Welch 2-sample t test with correction for multiple measurements, p < 0.005). (B) Stripe deviation is not affected in octopamine receptor mutants. In TyrRf05682 and honoka mutants, stripe deviation is significantly increased. Significant differences between control and the respective receptor mutant are calculated by Wilcoxon rank sum test with correction for multiple measurements (p < 0.005). In (A), bars and error bars indicate mean and standard error of the mean. In (B), the Tukey boxplots represent the median (bar), 25%–75% quartiles (box), and total data range (whiskers) excluding outliers outside of 1.5× interquartile range (dots). Numbers below graphs indicate sample size. Bars and boxes labeled with different letters are statistically significantly different. Raw data and evaluation code available at doi: 10.5281/zenodo.4568550.

Similar articles

Cited by

References

    1. Fisher RA. The genetical theory of natural selection. Oxford: Oxford University Press; 1930.
    1. Orr HA. Adaptation and the cost of complexity. Evolution. 2000;54:13–20. 10.1111/j.0014-3820.2000.tb00002.x - DOI - PubMed
    1. Waxman D, Peck JR. Pleiotropy and the preservation of perfection. Science. 1998;279:1210–3. - PubMed
    1. Kenney-Hunt JP, Cheverud JM. Differential dominance of pleiotropic loci for mouse skeletal traits. Evolution. 2009;63:1845–51. 10.1111/j.1558-5646.2009.00681.x - DOI - PubMed
    1. Otto SP. Two steps forward, one step back: the pleiotropic effects of favoured alleles. Proc Biol Sci. 2004;271:705–14. 10.1098/rspb.2003.2635 - DOI - PMC - PubMed

Publication types

MeSH terms

LinkOut - more resources