Meta-Analysis
. 2021 May 10;18(5):e1003602.
doi: 10.1371/journal.pmed.1003602. eCollection 2021 May.

Parenting interventions to promote early child development in the first three years of life: A global systematic review and meta-analysis

Affiliations
Meta-Analysis

Parenting interventions to promote early child development in the first three years of life: A global systematic review and meta-analysis

Joshua Jeong et al. PLoS Med. .

Abstract

Background: Parents are the primary caregivers of young children. Responsive parent-child relationships and parental support for learning during the earliest years of life are crucial for promoting early child development (ECD). We conducted a global systematic review and meta-analysis to evaluate the effectiveness of parenting interventions on ECD and parenting outcomes.

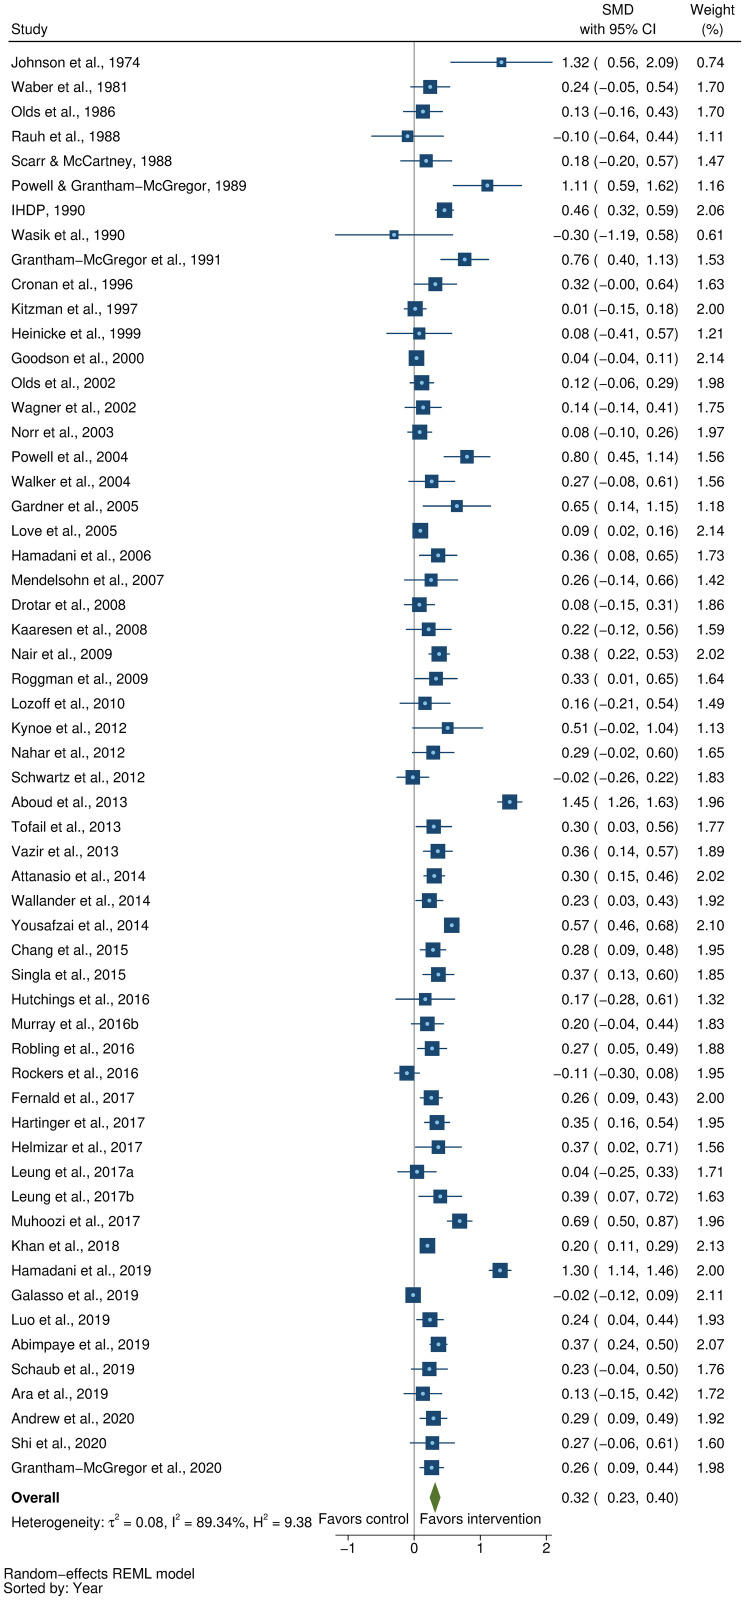
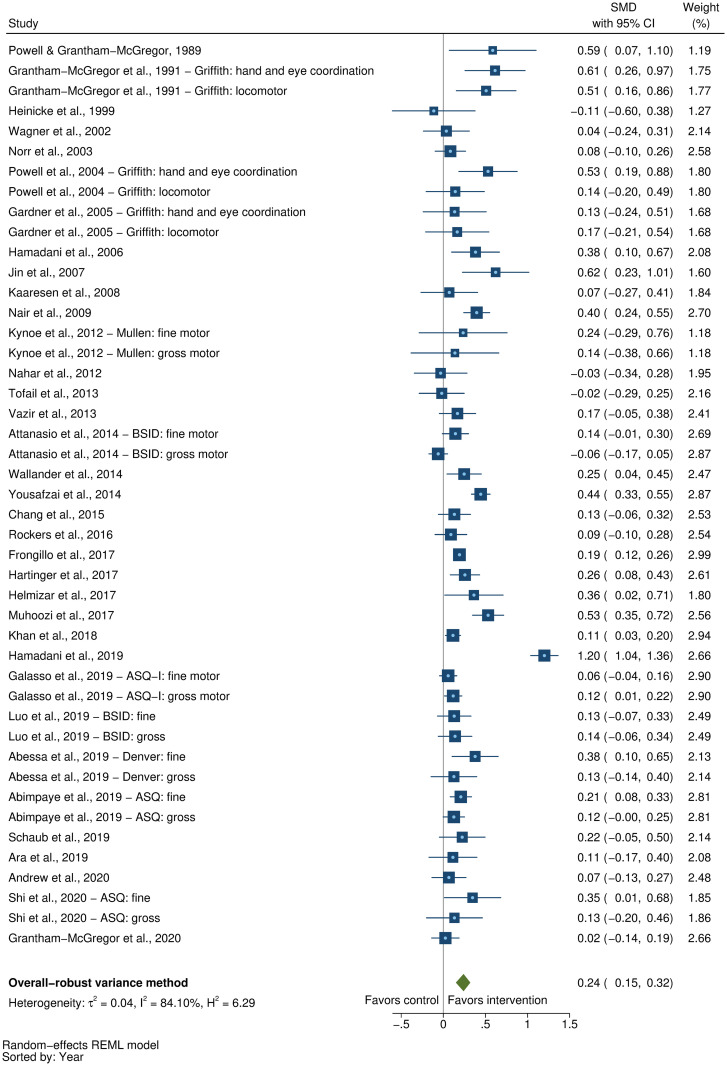
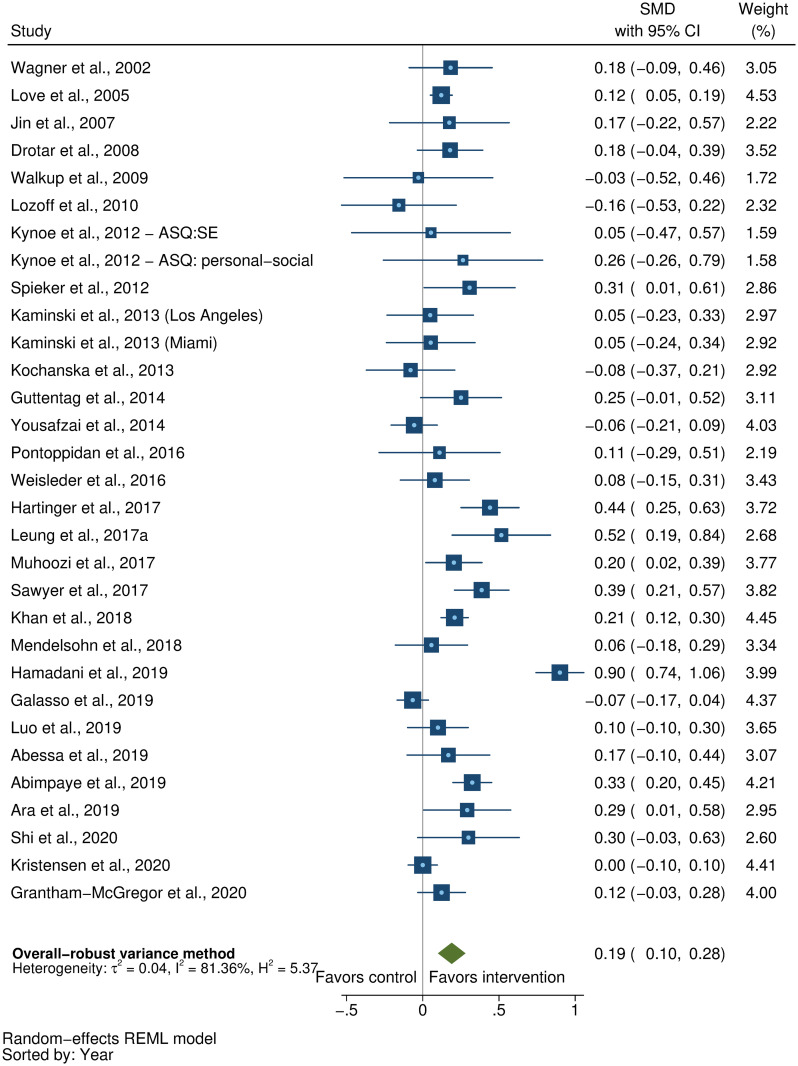
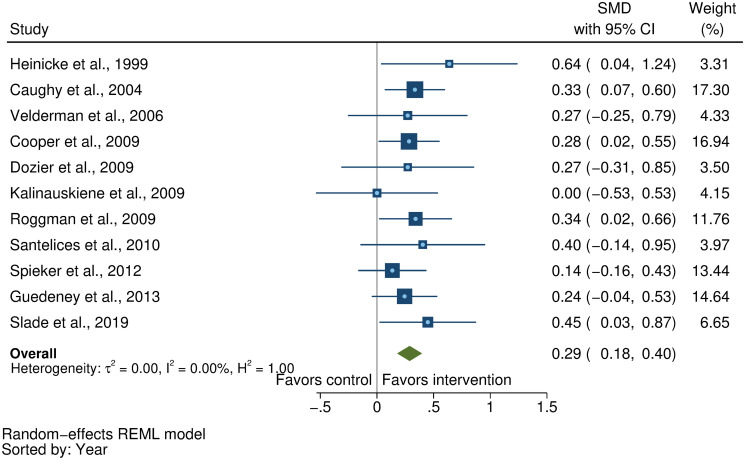
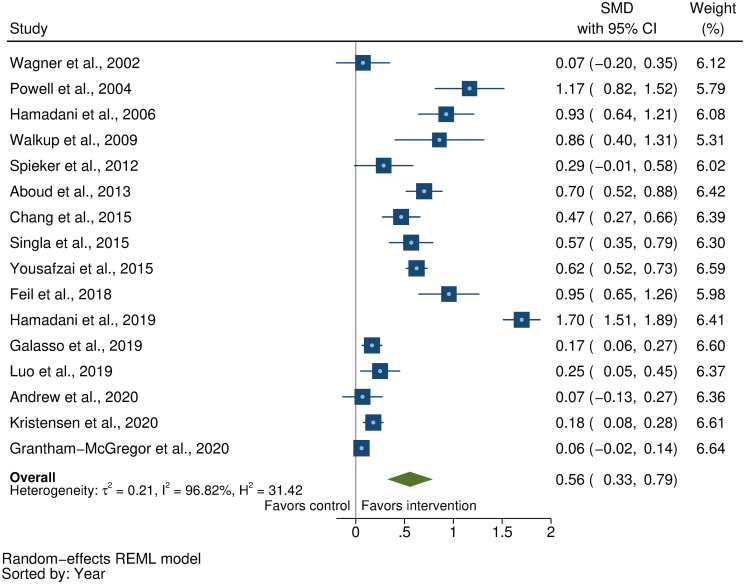
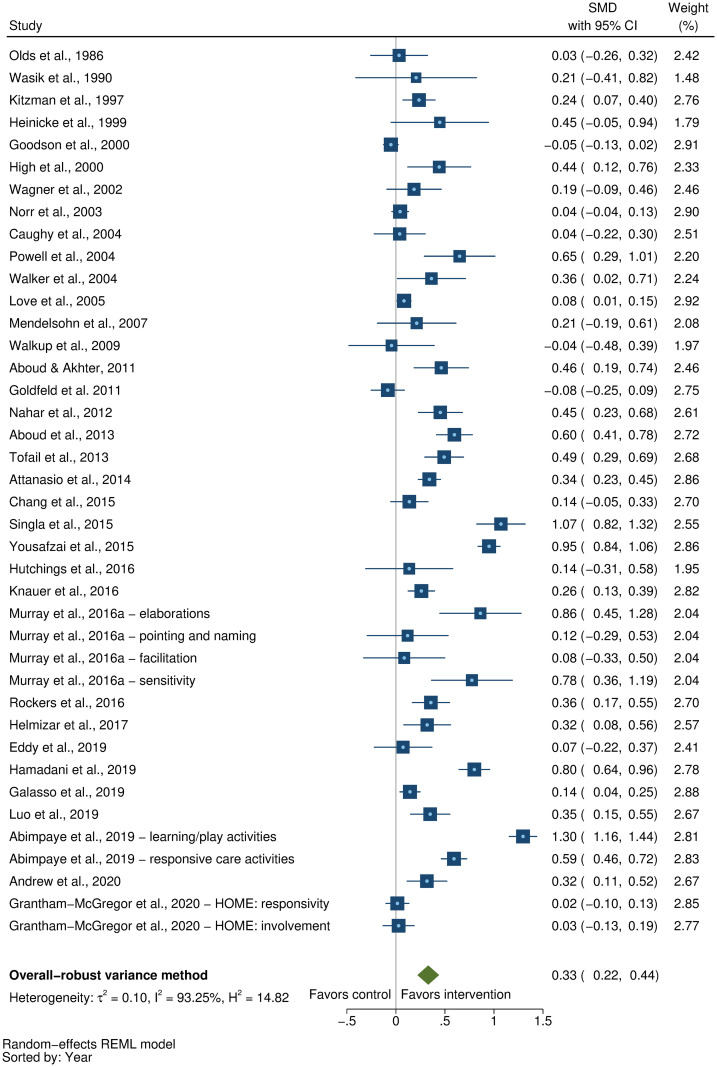
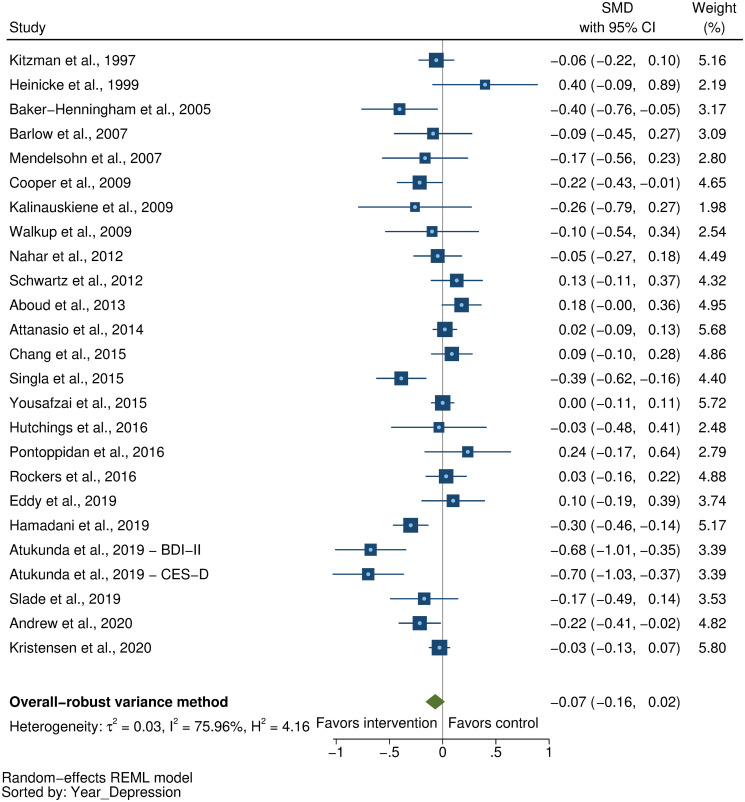
Methods and findings: We searched MEDLINE, Embase, PsycINFO, CINAHL, Web of Science, and Global Health Library for peer-reviewed, published articles from database inception until November 15, 2020. We included randomized controlled trials (RCTs) of parenting interventions delivered during the first 3 years of life that evaluated at least 1 ECD outcome. At least 2 reviewers independently screened, extracted data, and assessed study quality from eligible studies. ECD outcomes included cognitive, language, motor, and socioemotional development, behavior problems, and attachment. Parenting outcomes included parenting knowledge, parenting practices, parent-child interactions, and parental depressive symptoms. We calculated intervention effect sizes as the standardized mean difference (SMD) and estimated pooled effect sizes for each outcome separately using robust variance estimation meta-analytic approaches. We used random-effects meta-regression models to assess potential effect modification by country-income level, child age, intervention content, duration, delivery, setting, and study quality. This review was registered with PROSPERO (CRD42018092458 and CRD42018092461). Of the 11,920 articles identified, we included 111 articles representing 102 unique RCTs. Pooled effect sizes indicated positive benefits of parenting interventions on child cognitive development (SMD = 0.32, 95% CI [confidence interval]: 0.23, 0.40, P < 0.001), language development (SMD = 0.28, 95% CI: 0.18 to 0.37, P < 0.001), motor development (SMD = 0.24, 95% CI: 0.15 to 0.32, P < 0.001), socioemotional development (SMD = 0.19, 95% CI: 0.10 to 0.28, P < 0.001), and attachment (SMD = 0.29, 95% CI: 0.18 to 0.40, P < 0.001) and reductions in behavior problems (SMD = -0.13, 95% CI: -0.18 to -0.08, P < 0.001). Positive benefits were also found on parenting knowledge (SMD = 0.56, 95% CI: 0.33 to 0.79, P < 0.001), parenting practices (SMD = 0.33, 95% CI: 0.22 to 0.44, P < 0.001), and parent-child interactions (SMD = 0.39, 95% CI: 0.24 to 0.53, P < 0.001). However, there was no significant reduction in parental depressive symptoms (SMD = -0.07, 95% CI: -0.16 to 0.02, P = 0.08). Subgroup analyses revealed significantly greater effects on child cognitive, language, and motor development, and parenting practices in low- and middle-income countries compared to high-income countries; and significantly greater effects on child cognitive development, parenting knowledge, parenting practices, and parent-child interactions for programs that focused on responsive caregiving compared to those that did not. On the other hand, there was no clear evidence of effect modification by child age, intervention duration, delivery, setting, or study risk of bias. Study limitations include considerable unexplained heterogeneity, inadequate reporting of intervention content and implementation, and varying quality of evidence in terms of the conduct of trials and robustness of outcome measures used across studies.

Conclusions: Parenting interventions for children during the first 3 years of life are effective for improving ECD outcomes and enhancing parenting outcomes across low-, middle-, and high-income countries. Increasing implementation of effective and high-quality parenting interventions is needed globally and at scale in order to support parents and enable young children to achieve their full developmental potential.


Conflict of interest statement

The authors have declared that no competing interests exist.

Figures

Fig 1
Fig 1. Preferred Reporting Items for Systematic Reviews and Meta-analyses (PRISMA) flow diagram of search results and included studies.
Fig 2
Fig 2. Forest plot for the effect of parenting interventions on cognitive development.
Blue squares represent the SMD for each study, with the size of the square being proportional to the study weight. The whiskers extending from each side of the square represent the range of the 95% CI. The green diamond shows the overall pooled effect size using a random-effects model, which is centered at the point estimate and the diamond width representing the 95% CI. SMD, standardized mean difference.
Fig 3
Fig 3. Forest plot for the effect of parenting interventions on language development.
Blue squares represent the SMD for each study, with the size of the square being proportional to the study weight. The whiskers extending from each side of the square represent the range of the 95% CI. The green diamond shows the overall pooled effect size using a random-effects model, which is centered at the point estimate and the diamond width representing the 95% CI. SMD, standardized mean difference.
Fig 4
Fig 4. Forest plot for the effect of parenting interventions on motor development.
Blue squares represent the SMD for each study, with the size of the square being proportional to the study weight. The whiskers extending from each side of the square represent the range of the 95% CI. The green diamond shows the overall pooled effect size using a random-effects model, which is centered at the point estimate and the diamond width representing the 95% CI. SMD, standardized mean difference.
Fig 5
Fig 5. Forest plot for the effect of parenting interventions on socioemotional development.
Blue squares represent the SMD for each study, with the size of the square being proportional to the study weight. The whiskers extending from each side of the square represent the range of the 95% CI. The green diamond shows the overall pooled effect size using a random-effects model, which is centered at the point estimate and the diamond width representing the 95% CI. SMD, standardized mean difference.
Fig 6
Fig 6. Forest plot for the effect of parenting interventions on behavior problems.
Blue squares represent the SMD for each study, with the size of the square being proportional to the study weight. The whiskers extending from each side of the square represent the range of the 95% CI. The green diamond shows the overall pooled effect size using a random-effects model, which is centered at the point estimate and the diamond width representing the 95% CI. SMD, standardized mean difference.
Fig 7
Fig 7. Forest plot for the effect of parenting interventions on attachment.
Blue squares represent the SMD for each study, with the size of the square being proportional to the study weight. The whiskers extending from each side of the square represent the range of the 95% CI. The green diamond shows the overall pooled effect size using a random-effects model, which is centered at the point estimate and the diamond width representing the 95% CI. SMD, standardized mean difference.
Fig 8
Fig 8. Forest plot for the effect of parenting interventions on parenting knowledge.
Blue squares represent the SMD for each study, with the size of the square being proportional to the study weight. The whiskers extending from each side of the square represent the range of the 95% CI. The green diamond shows the overall pooled effect size using a random-effects model, which is centered at the point estimate and the diamond width representing the 95% CI. SMD, standardized mean difference.
Fig 9
Fig 9. Forest plot for the effect of parenting interventions on parenting practices.
Blue squares represent the SMD for each study, with the size of the square being proportional to the study weight. The whiskers extending from each side of the square represent the range of the 95% CI. The green diamond shows the overall pooled effect size using a random-effects model, which is centered at the point estimate and the diamond width representing the 95% CI. SMD, standardized mean difference.
Fig 10
Fig 10. Forest plot for the effect of parenting interventions on parent–child interactions.
Blue squares represent the SMD for each study, with the size of the square being proportional to the study weight. The whiskers extending from each side of the square represent the range of the 95% CI. The green diamond shows the overall pooled effect size using a random-effects model, which is centered at the point estimate and the diamond width representing the 95% CI. SMD, standardized mean difference.
Fig 11
Fig 11. Forest plot for the effect of parenting interventions on parental depressive symptoms.
Blue squares represent the SMD for each study, with the size of the square being proportional to the study weight. The whiskers extending from each side of the square represent the range of the 95% CI. The green diamond shows the overall pooled effect size using a random-effects model, which is centered at the point estimate and the diamond width representing the 95% CI. SMD, standardized mean difference.

Similar articles

Cited by

References

    1. Lu C, Black MM, Richter LM. Risk of poor development in young children in low-income and middle-income countries: an estimation and analysis at the global, regional, and country level. Lancet Glob Health. 2016;4(12):e916–e22. Epub 2016/10/09. 10.1016/S2214-109X(16)30266-2 . - DOI - PMC - PubMed
    1. Walker SP, Wachs TD, Gardner JM, Lozoff B, Wasserman GA, Pollitt E, et al.. Child development: risk factors for adverse outcomes in developing countries. Lancet. 2007;369(9556):145–57. Epub 2007/01/16. 10.1016/S0140-6736(07)60076-2 . - DOI - PubMed
    1. Walker SP, Wachs TD, Grantham-McGregor S, Black MM, Nelson CA, Huffman SL, et al.. Inequality in early childhood: risk and protective factors for early child development. Lancet. 2011;378(9799):1325–38. Epub 2011/09/29. 10.1016/S0140-6736(11)60555-2 . - DOI - PubMed
    1. Shonkoff JP, Richter L, van der Gaag J, Bhutta ZA. An integrated scientific framework for child survival and early childhood development. Pediatrics. 2012;129(2):e460–72. Epub 2012/01/06. 10.1542/peds.2011-0366 . - DOI - PubMed
    1. Britto PR, Lye SJ, Proulx K, Yousafzai AK, Matthews SG, Vaivada T, et al.. Nurturing care: Promoting early childhood development. Lancet. 2017;389(10064):91–102. 10.1016/S0140-6736(16)31390-3 . - DOI - PubMed

Publication types