Published Erratum
. 2021 May 10;17(5):e1009584.
doi: 10.1371/journal.ppat.1009584. eCollection 2021 May.

Correction: Single-cell glycolytic activity regulates membrane tension and HIV-1 fusion

Published Erratum

Correction: Single-cell glycolytic activity regulates membrane tension and HIV-1 fusion

Charles A Coomer et al. PLoS Pathog. .

Abstract

[This corrects the article DOI: 10.1371/journal.ppat.1008359.].


Figures
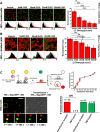
Fig 3
Fig 3. Addition of 2DG arrests HIV-1 fusion at the hemifusion stage.
A.) (Left) Representative images of CCF2-loaded cells recorded 90 minutes after HIV-1JR-FL infection in vehicle and incrementally increasing 2-DG treatment conditions; scale bar 50μm. (Right) Corresponding bar graph compiling data extracted from the β-lactamase assay and normalised to vehicle-treated control illustrating that increasing concentrations of 2-DG led to reductions in viral fusion for HIV-1JR-FL. in TZM-bl cells (mean of three independent experiments). *p<0.05, **p<0.01 *** p<0.001 as determined by one-way ANOVA. B.) (Left) Representative images of CCF2-loaded cells recorded 90 minutes after HIV-1VSV-G infection in vehicle and incrementally increasing 2-DG treatment conditions; scale bar 50μm. (Right) Corresponding bar graph compiling data extracted from the β-lactamase assay and normalised to vehicle-treated control illustrating that increasing concentrations of 2-DG led to partial reduction in viral fusion for HIV-1VSV-G in TZM-bl cells (mean of three independent experiments). *p<0.05, **p<0.01 *** p<0.001 as determined by one-way ANOVA. In panels A and B, the control histogram data are overlaid as gray curves in the experimental histogram panels to enable easy comparison of the results. C.) (Top row, left) Cartoon diagram illustrating the concept of single-particle tracking with double-labelled virions with DiD and eGFP-gag. Briefly, double-labelled virions entering via endocytosis will have their eGFP-gag signal infinitely diluted during endosomal fusion whilst DiD signal is retained in the endosome, which is mobile. Virions entering via plasma membrane fusion will have their DiD signal infinitely diluted in the plasma membrane whereas the eGFP-gag signal is retained and mobile. Hemifusion is denoted when DiD signal infinitely diluted in the plasma membrane whereas the eGFP-gag signal is retained and immobile. (Top row, right) Kinetics of the individual hemifusion events plotted as cumulative distributions as a function of time. (Bottom row, left) Representative panel of images illustrating doubled-labelled HIV-1JRFL particles losing DiD signal (red) and maintaining immobile eGFP signal (green) when attempting fusion in 2-DG treated cells, suggesting arrest at hemifusion (n = 15, acquired during three independent experiments). (Bottom row, right) Bar chart representing the total number of HIVJRFL double-labelled particles tracked for TZM-bl cells treated with 2DG (red bars) and without treatment (green bars). Only in cells without 2-DG treatment plasma membrane fusion was observed. Total number events tracked in control conditions: 217. Total number of events tracked in 2-DG-treated conditions: 236.
Fig 4
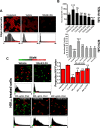
Fig 4. Addition of 2-DG sequesters cholesterol from the cell membrane.
A.) Representative images depicting filipin mean fluorescence intensity per cell indicating two-hour incubation of increasing concentrations of 2-DG decreases surface cholesterol in TZM-bl cells; scale bar 50 μm. B.) Bar charts depicting mean fluorescence intensity per cell of three independent experiments normalised to vehicle in TZM-bl cells (top) and MT4 cells (bottom) in cells treated with 400μg/mL cholesterol, 5mM MBCD and increasing concentrations of 2-DG. C.) Representative images (left) and bar chart (right) of three independent experiments depicting percent of fusion positive cells, as determined by the BlaM assay, relative to vehicle control illustrating increasing concentrations of cholesterol rescues fusion in 2-DG treated TZM-bl cells; scale bar 50 μm. In the histogram for Fig 4C, ‘μg/mL’is the correct unit of cholesterol (Chol) concentration, but this is abbreviated to ‘μg’ in the x axis data labels. The x axes in the histograms represent the relative values in arbitrary intensity units of the ratio between the blue and the green channels (B/G). *p<0.05, **p<0.01 *** p<0.001 as determined by one-way ANOVA.

Erratum for

References

    1. Coomer CA, Carlon-Andres I, Iliopoulou M, Dustin ML, Compeer EB, Compton AA, et al.. (2020) Single-cell glycolytic activity regulates membrane tension and HIV-1 fusion. PLoS Pathog 16(2): e1008359. 10.1371/journal.ppat.1008359 - DOI - PMC - PubMed

Publication types

LinkOut - more resources