. 2021 Sep 23;138(12):1040-1052.
doi: 10.1182/blood.2019000553.

Overexpression of wild-type IL-7Rα promotes T-cell acute lymphoblastic leukemia/lymphoma

Affiliations

Overexpression of wild-type IL-7Rα promotes T-cell acute lymphoblastic leukemia/lymphoma

Ana Silva et al. Blood. .

Erratum in

Abstract

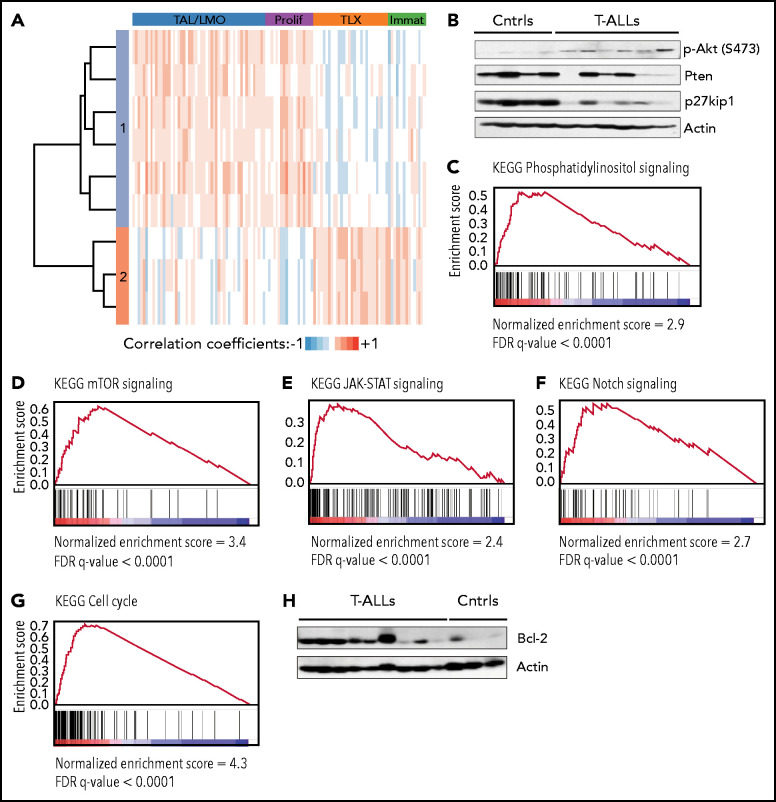
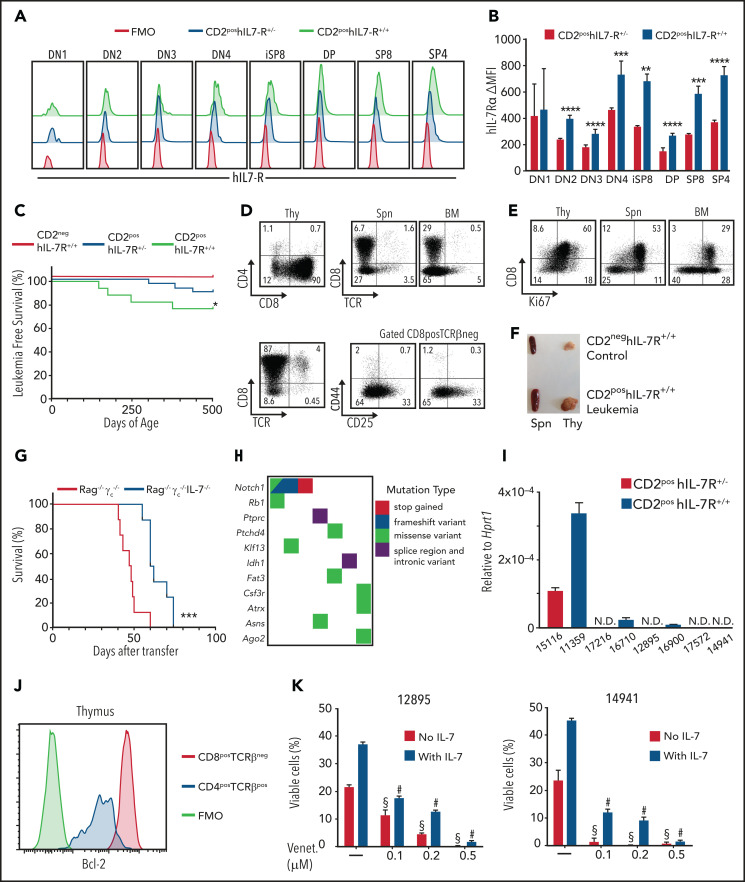
Tight regulation of IL-7Rα expression is essential for normal T-cell development. IL-7Rα gain-of-function mutations are known drivers of T-cell acute lymphoblastic leukemia (T-ALL). Although a subset of patients with T-ALL display high IL7R messenger RNA levels and cases with IL7R gains have been reported, the impact of IL-7Rα overexpression, rather than mutational activation, during leukemogenesis remains unclear. In this study, overexpressed IL-7Rα in tetracycline-inducible Il7r transgenic and Rosa26 IL7R knockin mice drove potential thymocyte self-renewal, and thymus hyperplasia related to increased proliferation of T-cell precursors, which subsequently infiltrated lymph nodes, spleen, and bone marrow, ultimately leading to fatal leukemia. The tumors mimicked key features of human T-ALL, including heterogeneity in immunophenotype and genetic subtype between cases, frequent hyperactivation of the PI3K/Akt pathway paralleled by downregulation of p27Kip1 and upregulation of Bcl-2, and gene expression signatures evidencing activation of JAK/STAT, PI3K/Akt/mTOR and Notch signaling. Notably, we also found that established tumors may no longer require high levels of IL-7R expression upon secondary transplantation and progressed in the absence of IL-7, but remain sensitive to inhibitors of IL-7R-mediated signaling ruxolitinib (Jak1), AZD1208 (Pim), dactolisib (PI3K/mTOR), palbociclib (Cdk4/6), and venetoclax (Bcl-2). The relevance of these findings for human disease are highlighted by the fact that samples from patients with T-ALL with high wild-type IL7R expression display a transcriptional signature resembling that of IL-7-stimulated pro-T cells and, critically, of IL7R-mutant cases of T-ALL. Overall, our study demonstrates that high expression of IL-7Rα can promote T-cell tumorigenesis, even in the absence of IL-7Rα mutational activation.


Figures

None
Graphical abstract
Figure 1.
Figure 1.
IL-7Rα expression results in progressive thymic hyperplasia and disseminated, fatal T-cell leukemia/lymphoma. (A) Thymus cellularity vs age from wild-type F5 control and F5 TetIL-7RON mice. Numbers indicate slope of line fit and 95% confidence intervals. (B) CD4 vs CD8 expression by thymocytes and splenocytes from TetIL-7RON mice (n = 36). Lymphoma/leukemia present in thymus and spleen, characterized by their expression of CD4 and CD8 into DN, CD8 SP, DP, and CD4 SP. A representative example of each phenotype is shown and the percent incidence of phenotype indicated under the phenotypic label. (C) CD4 vs CD8 expression by thymocytes and splenocytes from TetIL-7RON or control C57Bl6/J mice. Histograms are of Ki67 labeling of thymocytes (top) and splenocytes (bottom) of the indicated subpopulation from either TetIL-7RON or C57Bl6/J control mice. (D) Survival of cohorts of TetIL-7RON (n = 8) vs TetIL-7ROFF (n = 4) and TreIL-7R+ rtTA– Il7r−/− mice (n = 4). Mice were culled when they reached the defined humane end point (see “Methods”). P = .0003. (E) Phenotype in the indicated organs of F5 TetIL-7RON mice identified with clinical signs of disease (tumor), as compared with IL-7RWT F5 control mice (control). Density plots are of CD4 vs CD8 in the thymus, spleen and bone marrow of the indicated conditions. (F) Malignant thymocytes from donor mouse in (E) were transferred into Rag1−/− recipients (n = 8). Four weeks later, thymus, spleen, and bone marrow were analyzed for the presence of donor cells. Shown is pooled data of 2 (D) or 6 (A-B) independent experiments or mean results of 3 (C,E-F) independent experiments.
Figure 2.
Figure 2.
Disease development is influenced by Rag1 expression but not TCR signaling. (A) Development of malignant disease was monitored in cohorts of TetIL-7RON mice, whose T cells have a polyclonal TCR repertoire (Poly; n = 8), and TCR transgenic F5 TetIL-7RON (F5; n = 6) and OTII TetIL-7RON (OTII; n = 10) mice. Survival of the different strains over time is shown. (B) Survival of cohorts of F5 TetIL-7RON (F5 Rag1+) and F5 Rag1−/− TetIL-7RON (F5 Rag1; n = 11) mice was monitored up to 400 days of age. *P = .018; n.s., nonsignificant; log-rank, Mantel-Cox test.
Figure 3.
Figure 3.
Maintenance of established TetIL-7R tumors no longer appears to require high IL-7Rα expression. (A) IL-7Rα expression was measured in F5 TetIL-7R primary tumor cells (left), and after adoptive transfer into Rag1−/− mice (middle). Mean fluorescence intensity (MFI) of primary tumor cells collected from the thymus of a sick mouse continuously fed dox (tumor) were compared with the DP (CD4+CD8+) cells of an F5 control mouse (used as the negative control; left). Malignant cells collected from the thymus of the same mouse were transplanted into Rag1−/− recipient mice that were fed with (On dox) or not fed (Off dox) dox-containing food for 4 weeks after transplantation (middle). MFI was compared after 4 weeks between On- and Off-dox groups. IL-7Rα MFI for each transplant-recipient animal (right). (B) Transplanted cells collected from the bone marrow of On- and Off-dox recipient mice 4 weeks after transplantation were compared for their immunophenotype. CD4 vs CD8 (top) and CD5 vs TCRαβ (bottom). Frequency of cells within the gate (left) for each transplant recipient. Results are representative of 3 independent experiments (each from a different primary tumor).
Figure 4.
Figure 4.
TetIL-7R tumors display hyperactivation of the PI3K/Akt pathway and mimic multiple features of human T-ALL. (A) Hierarchical clustering analysis of Pearson correlation coefficients between mouse tumors and human T-ALL. Each row corresponds to a mouse leukemia and each lane to a human T-ALL sample. Transcriptomic analyses showed that mouse tumors resemble either TAL/LMO+proliferative T-ALLs (cluster 1) or HOXA/TLX+immature (cluster 2), as defined in Homminga et al. Robustness of this analysis is shown by the fact that mouse leukemias that were “classified” as HOXA/TLX+immature–like display features of immature/ETP-ALL, such as higher KIT, CD33, and CD34 than the other tumors (supplemental Figure 4). (B) Akt activation (p-Akt), and PTEN and p27Kip1 expression levels were evaluated by immunoblot in On-dox F5 TetIL-7R thymic tumors (T-ALLs) vs control thymic samples from healthy, F5 mice (Ctrls). (C-G) GSEA of the ranked expression differences between tumors and controls for the KEGG pathways: phosphatidylinositol signaling (C), mTOR signaling (D), JAK-STAT signaling (E), Notch signaling (F), and cell cycle (G). (H) Bcl-2 expression levels were evaluated by immunoblot in tumors and controls. KEGG, Kyoto Encyclopedia of Genes and Genomes.
Figure 5.
Figure 5.
Human IL-7Rα expression leads to the dose-dependent development of T-cell leukemias that are sensitive to Bcl-2 inhibition. (A) Flow cytometry analysis for hIL-7Rα within Linneg thymocytes from 12-week-old animals of the indicated genotypes. FMO, fluorescence minus 1 negative control. (B) Difference from FMO of MFI of hIL-7Rα within each thymocyte subpopulation in heterozygous or homozygous animals. Standard deviation (SD) is indicated. **P < .01; ***P < .001; ****P < .0001; Student t test. (C) Survival corresponding to the indicated genotypes. No leukemias were observed in the CD2neg hIL-7R+/− cohort (not shown). *P < .05; log-rank, Mantel-Cox test . CD2neg hIL-7R+/+; n = 23; CD2pos hIL-7R+/−; n = 28; and CD2pos hIL7R+/+; n = 18. (D-F) Analysis of a representative leukemic animal euthanized when moribund. (D) Dot plots show CD4/CD8 coreceptor and CD8/TCRβ expression within Linneg thymocytes (Thy) and the presence of the same cells in the spleen (Spn) and bone marrow (BM). (E) CD8/Ki67 expression in thymus (Thy), Spn, and BM. (F) Animal that presented with a very large thymus and enlarged spleen vs control. (G) Survival of Rag−/−γc−/− or Rag−/−γc−/−IL-7−/− recipients of leukemic cells (4 × 10⁵; n = 8 per group). ***P < .001, log-rank, Mantel-Cox. (H) Mutational burden map of single-nucleotide and indel variants with predicted high and moderate impact in functionally relevant genes and drivers of T-ALL or pediatric leukemias in CD2pos hIL-7R leukemias. (I) Il7 messenger RNA expression levels relative to Hprt1 in leukemic cells from CD2pos hIL-7R leukemias were quantified by quantitative real-time reverse transcription polymerase chain reaction. Average of triplicate experiments and SD are shown. (J) Bcl-2 flow cytometry analysis of CD4posTCRβpos normal SP thymocytes and CD8posTCRβneg leukemic cells of the same animal as in panels D-F. (K) Cells from 2 different leukemias (12895 and 14941) were cultured in the presence of the indicated doses of the Bcl-2 inhibitor venetoclax and in the absence (red bars) or presence (purple bars) of IL-7. Data show viability at 48 hours. One-way analysis of variance with Tukey’s correction for multiple comparisons. #P < .0001, venetoclax in the presence of IL-7 vs IL-7 alone; §P < .0001, venetoclax in the absence of IL-7 vs medium alone.
Figure 6.
Figure 6.
Patients with T-ALL with high wild-type IL7R expression display evidence of oncogenic IL-7R–dependent signaling activation. (A) Normalized IL7R gene expression levels in T-ALL patients with wild-type IL7R (n = 246). Dashed lines mark the 20 cases with the highest expression (above top line) and the 20 cases with lowest IL7R expression (below bottom line), used for comparison in the subsequent analyses. Only IL7R wild-type cases were analyzed. (B-C) Ranked GSEA on differentially expressed genes between IL7R-high and -low cases for the sets of IL-7 target genes in pro-T cells (B), and genes upregulated in IL7R-mutant T-ALL samples (left) and downregulated in IL7R-mutant cases (right) (C).

Comment in

  • T-ALL and the talented Mr IL7Rα.
    Han C, Ntziachristos P. Han C, et al. Blood. 2021 Sep 23;138(12):1003-1004. doi: 10.1182/blood.2021012184. Blood. 2021. PMID: 34554220 No abstract available.

References

    1. Fry TJ, Mackall CL.. Interleukin-7: from bench to clinic. Blood. 2002;99(11):3892-3904. - PubMed
    1. Peschon JJ, Morrissey PJ, Grabstein KH, et al. . Early lymphocyte expansion is severely impaired in interleukin 7 receptor-deficient mice. J Exp Med. 1994;180(5):1955-1960. - PMC - PubMed
    1. von Freeden-Jeffry U, Vieira P, Lucian LA, McNeil T, Burdach SE, Murray R.. Lymphopenia in interleukin (IL)-7 gene-deleted mice identifies IL-7 as a nonredundant cytokine. J Exp Med. 1995;181(4):1519-1526. - PMC - PubMed
    1. Barata JT, Durum SK, Seddon B.. Flip the coin: IL-7 and IL-7R in health and disease. Nat Immunol. 2019;20(12):1584-1593. - PubMed
    1. Puel A, Ziegler SF, Buckley RH, Leonard WJ.. Defective IL7R expression in T(-)B(+)NK(+) severe combined immunodeficiency. Nat Genet. 1998;20(4):394-397. - PubMed

Publication types

MeSH terms

Substances