. 2021 Dec;47(7):1033-1049.
doi: 10.1111/nan.12732. Epub 2021 May 21.

Distinct brain-derived TDP-43 strains from FTLD-TDP subtypes induce diverse morphological TDP-43 aggregates and spreading patterns in vitro and in vivo

Affiliations

Distinct brain-derived TDP-43 strains from FTLD-TDP subtypes induce diverse morphological TDP-43 aggregates and spreading patterns in vitro and in vivo

Sílvia Porta et al. Neuropathol Appl Neurobiol. 2021 Dec.

Abstract

Aim: The heterogeneity in the distribution and morphological features of TAR DNA-binding protein-43 (TDP-43) pathology in the brains of frontotemporal lobar degeneration (FTLD-TDP) patients and their different clinical manifestations suggest that distinct pathological TDP-43 strains could play a role in this heterogeneity between different FTLD-TDP subtypes (A-E). Our aim was to evaluate the existence of distinct TDP-43 strains in the brains of different FTLD-TDP subtypes and characterise their specific seeding properties in vitro and in vivo.

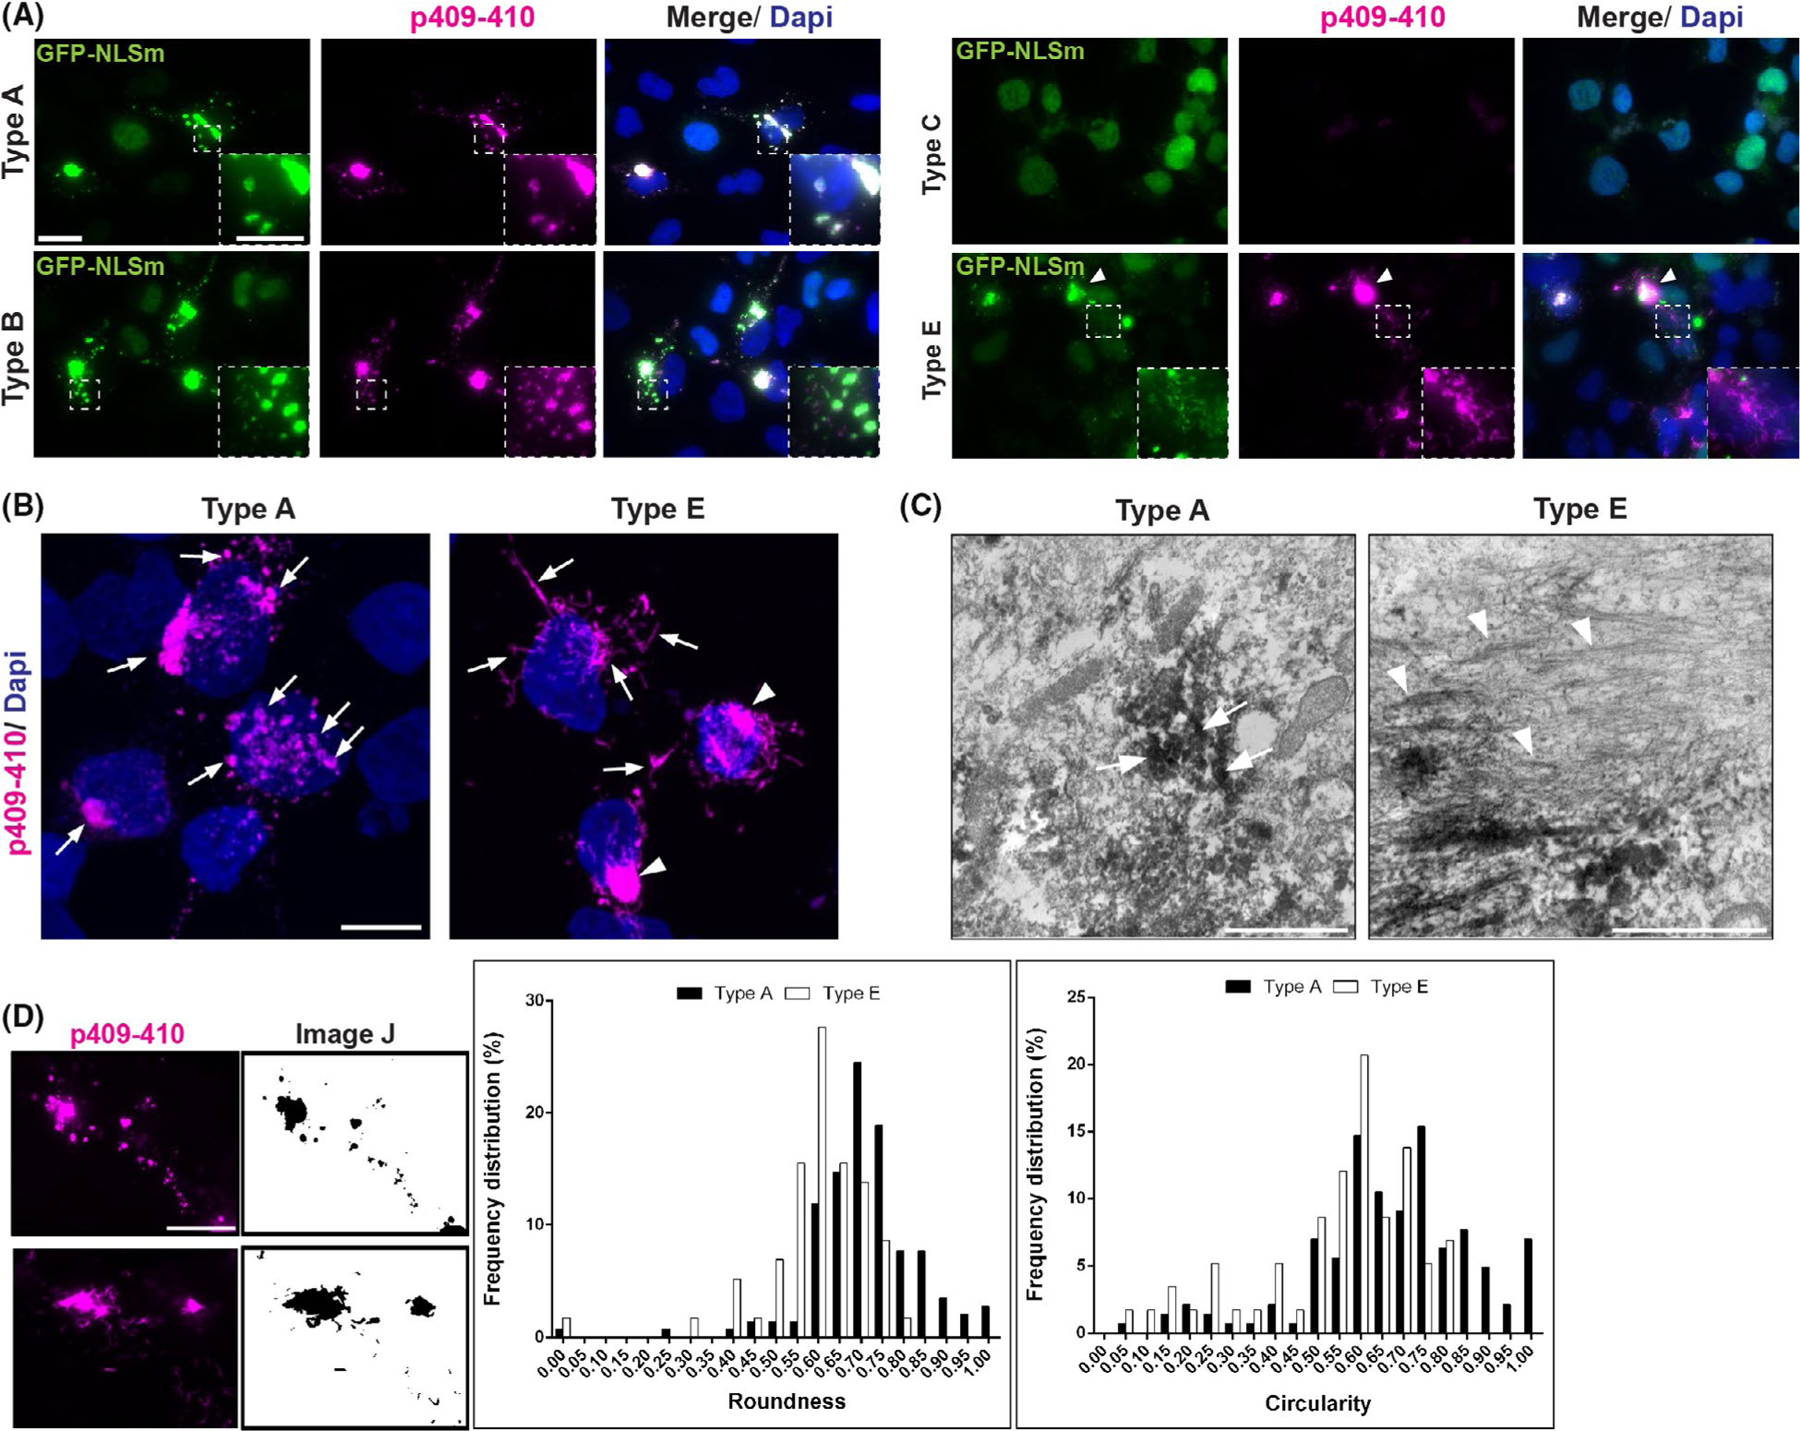
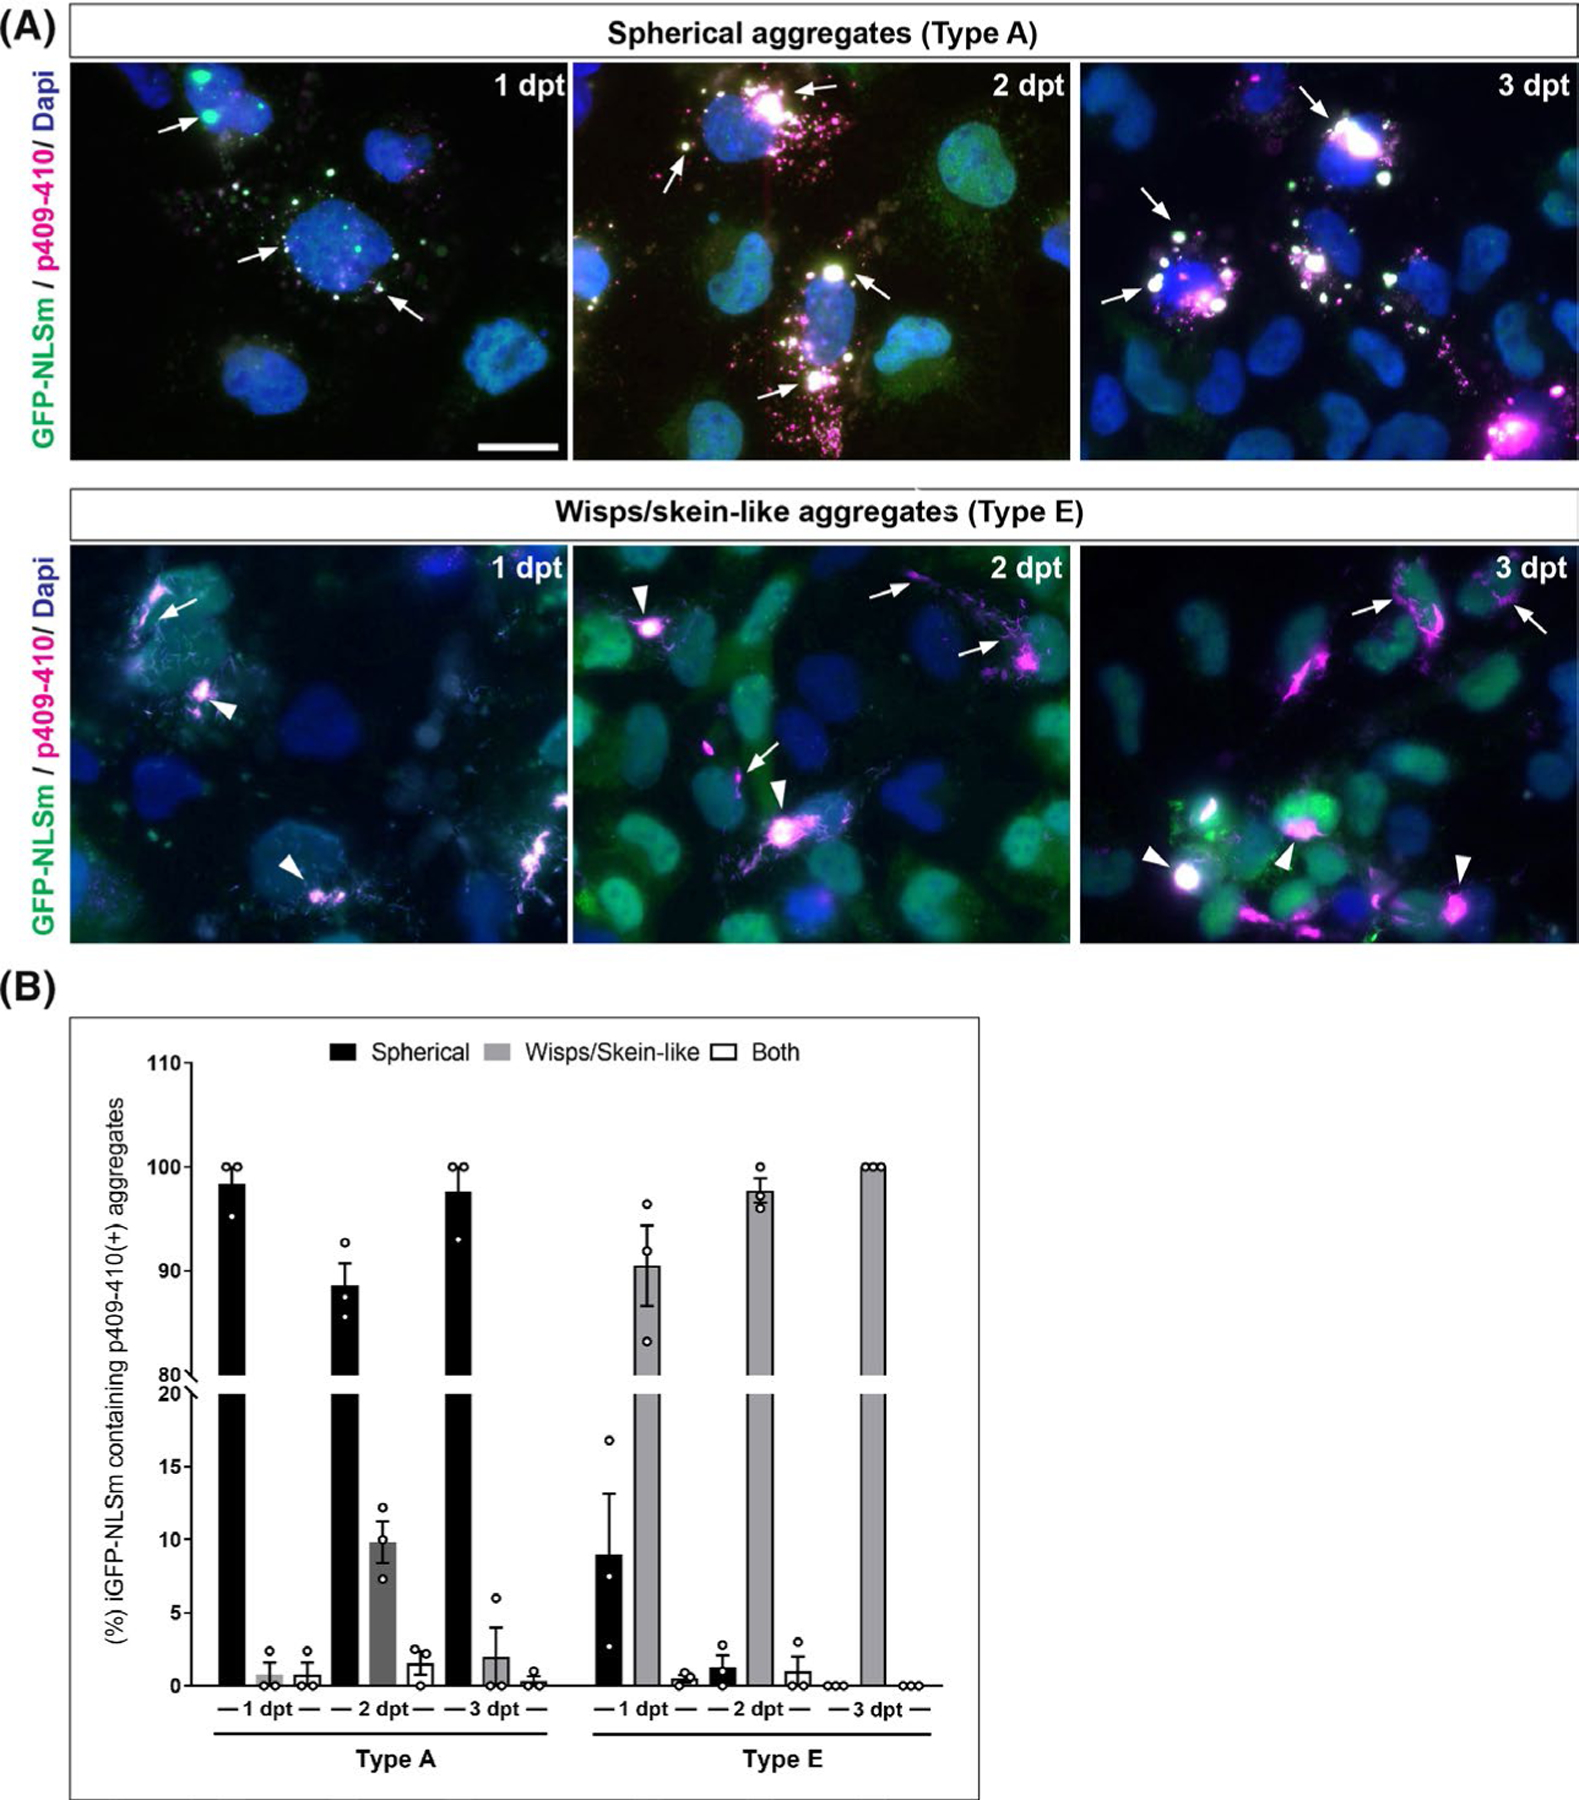
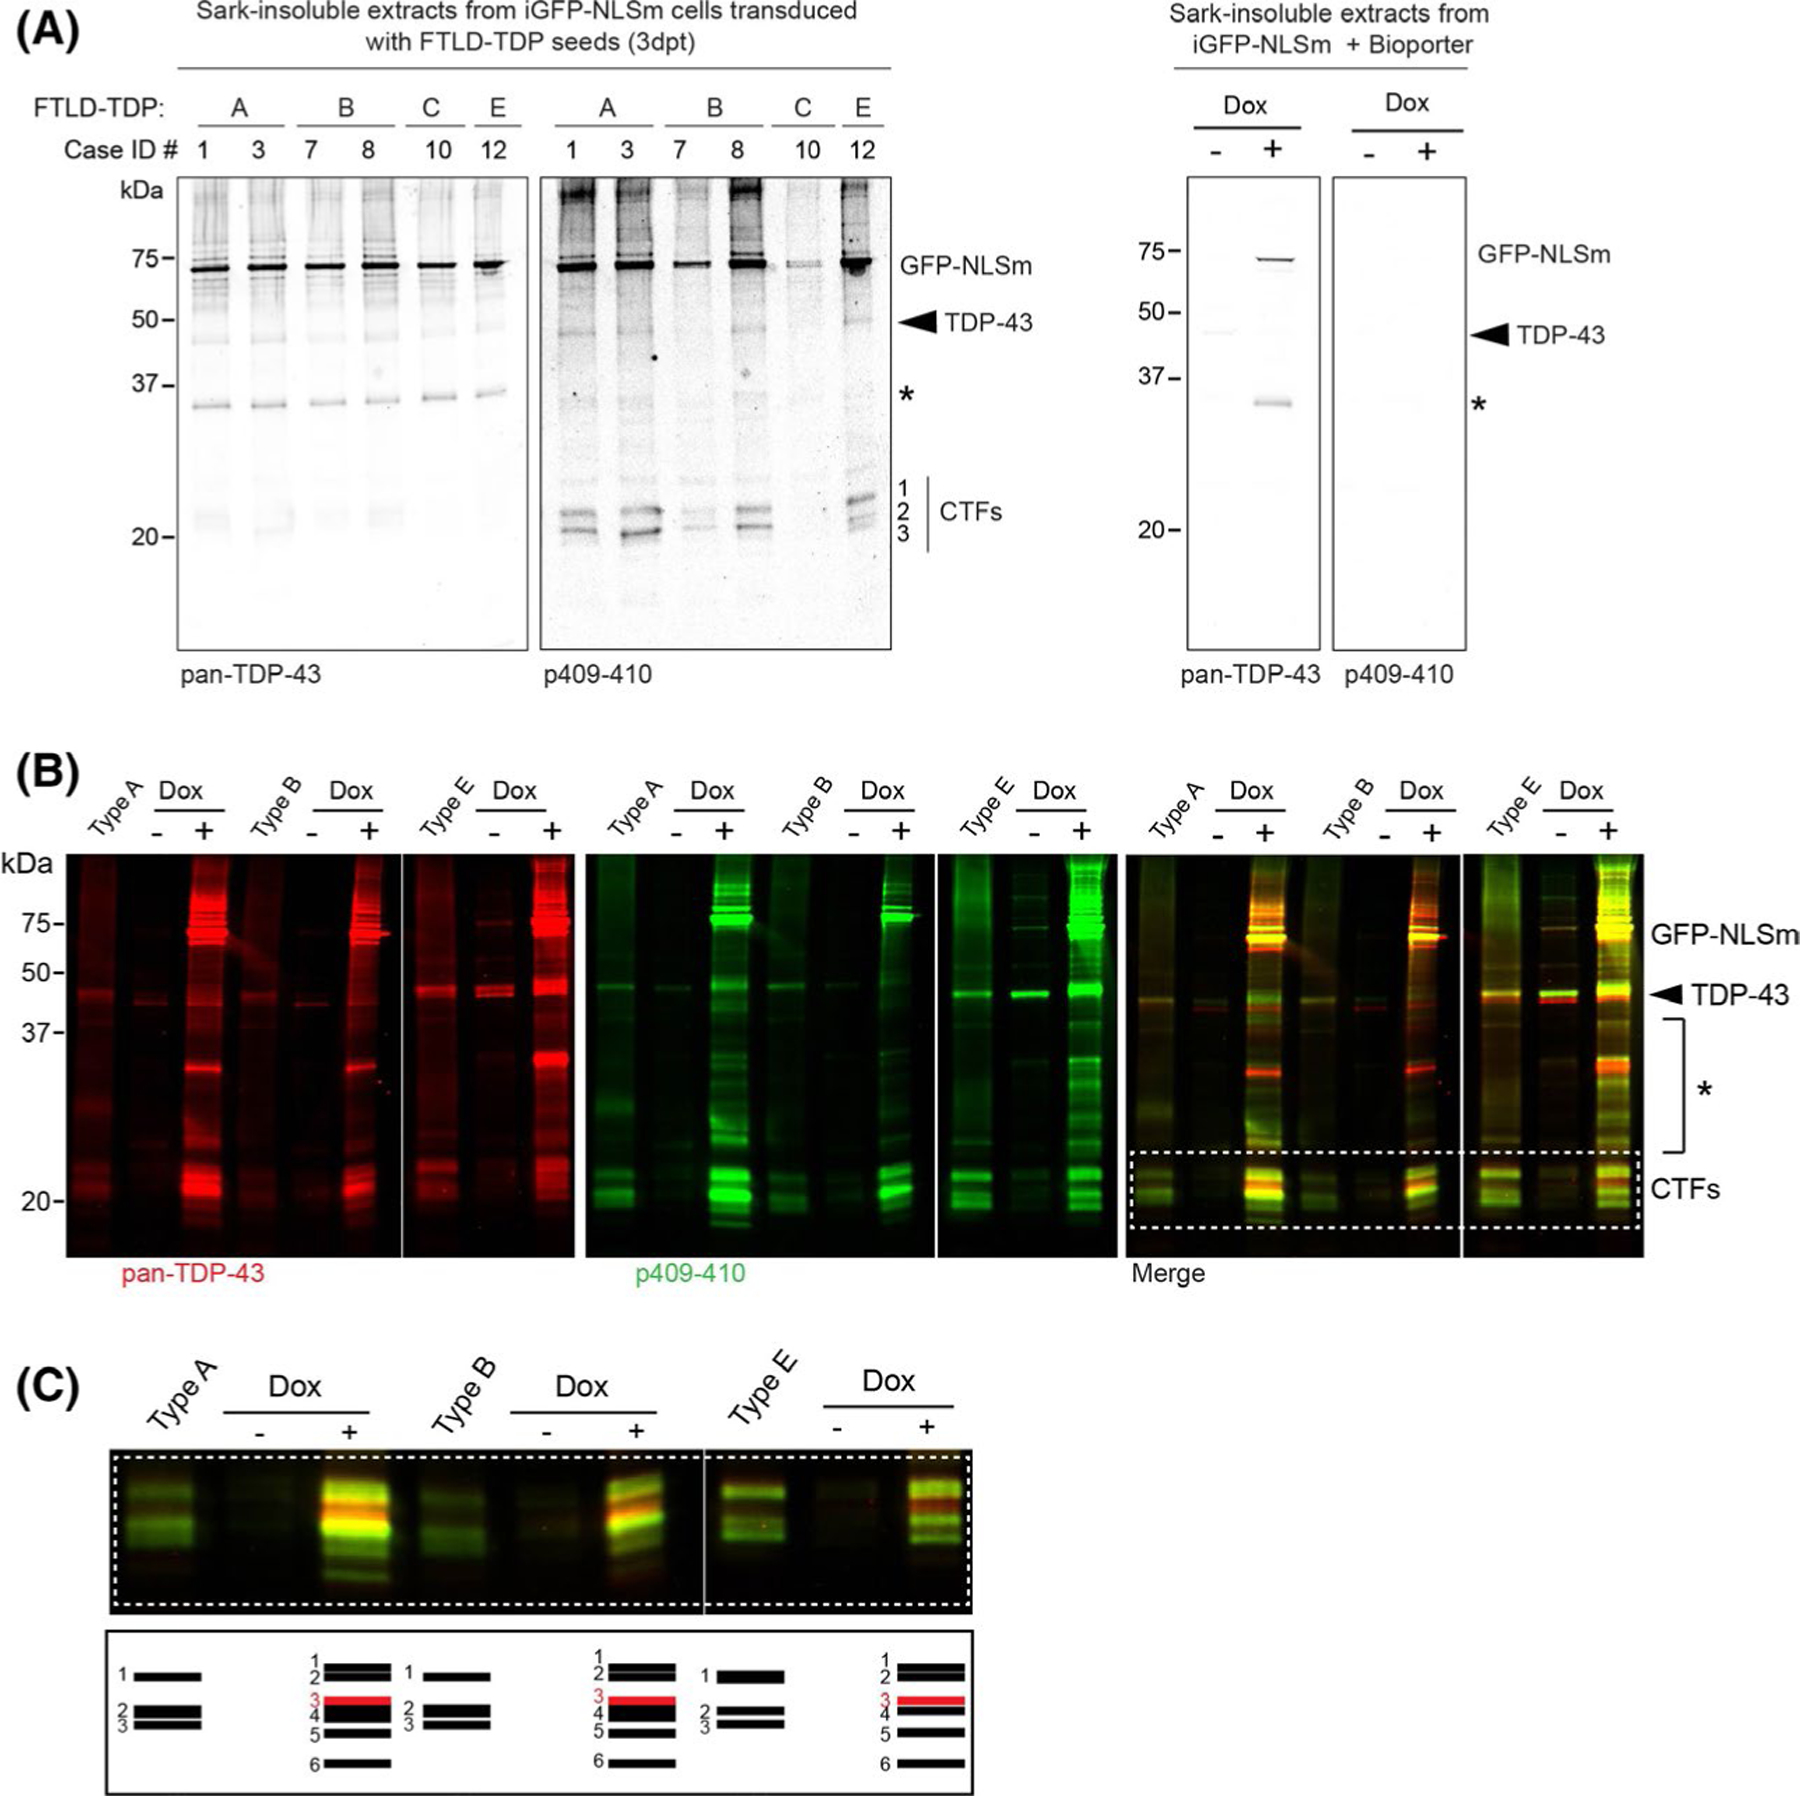
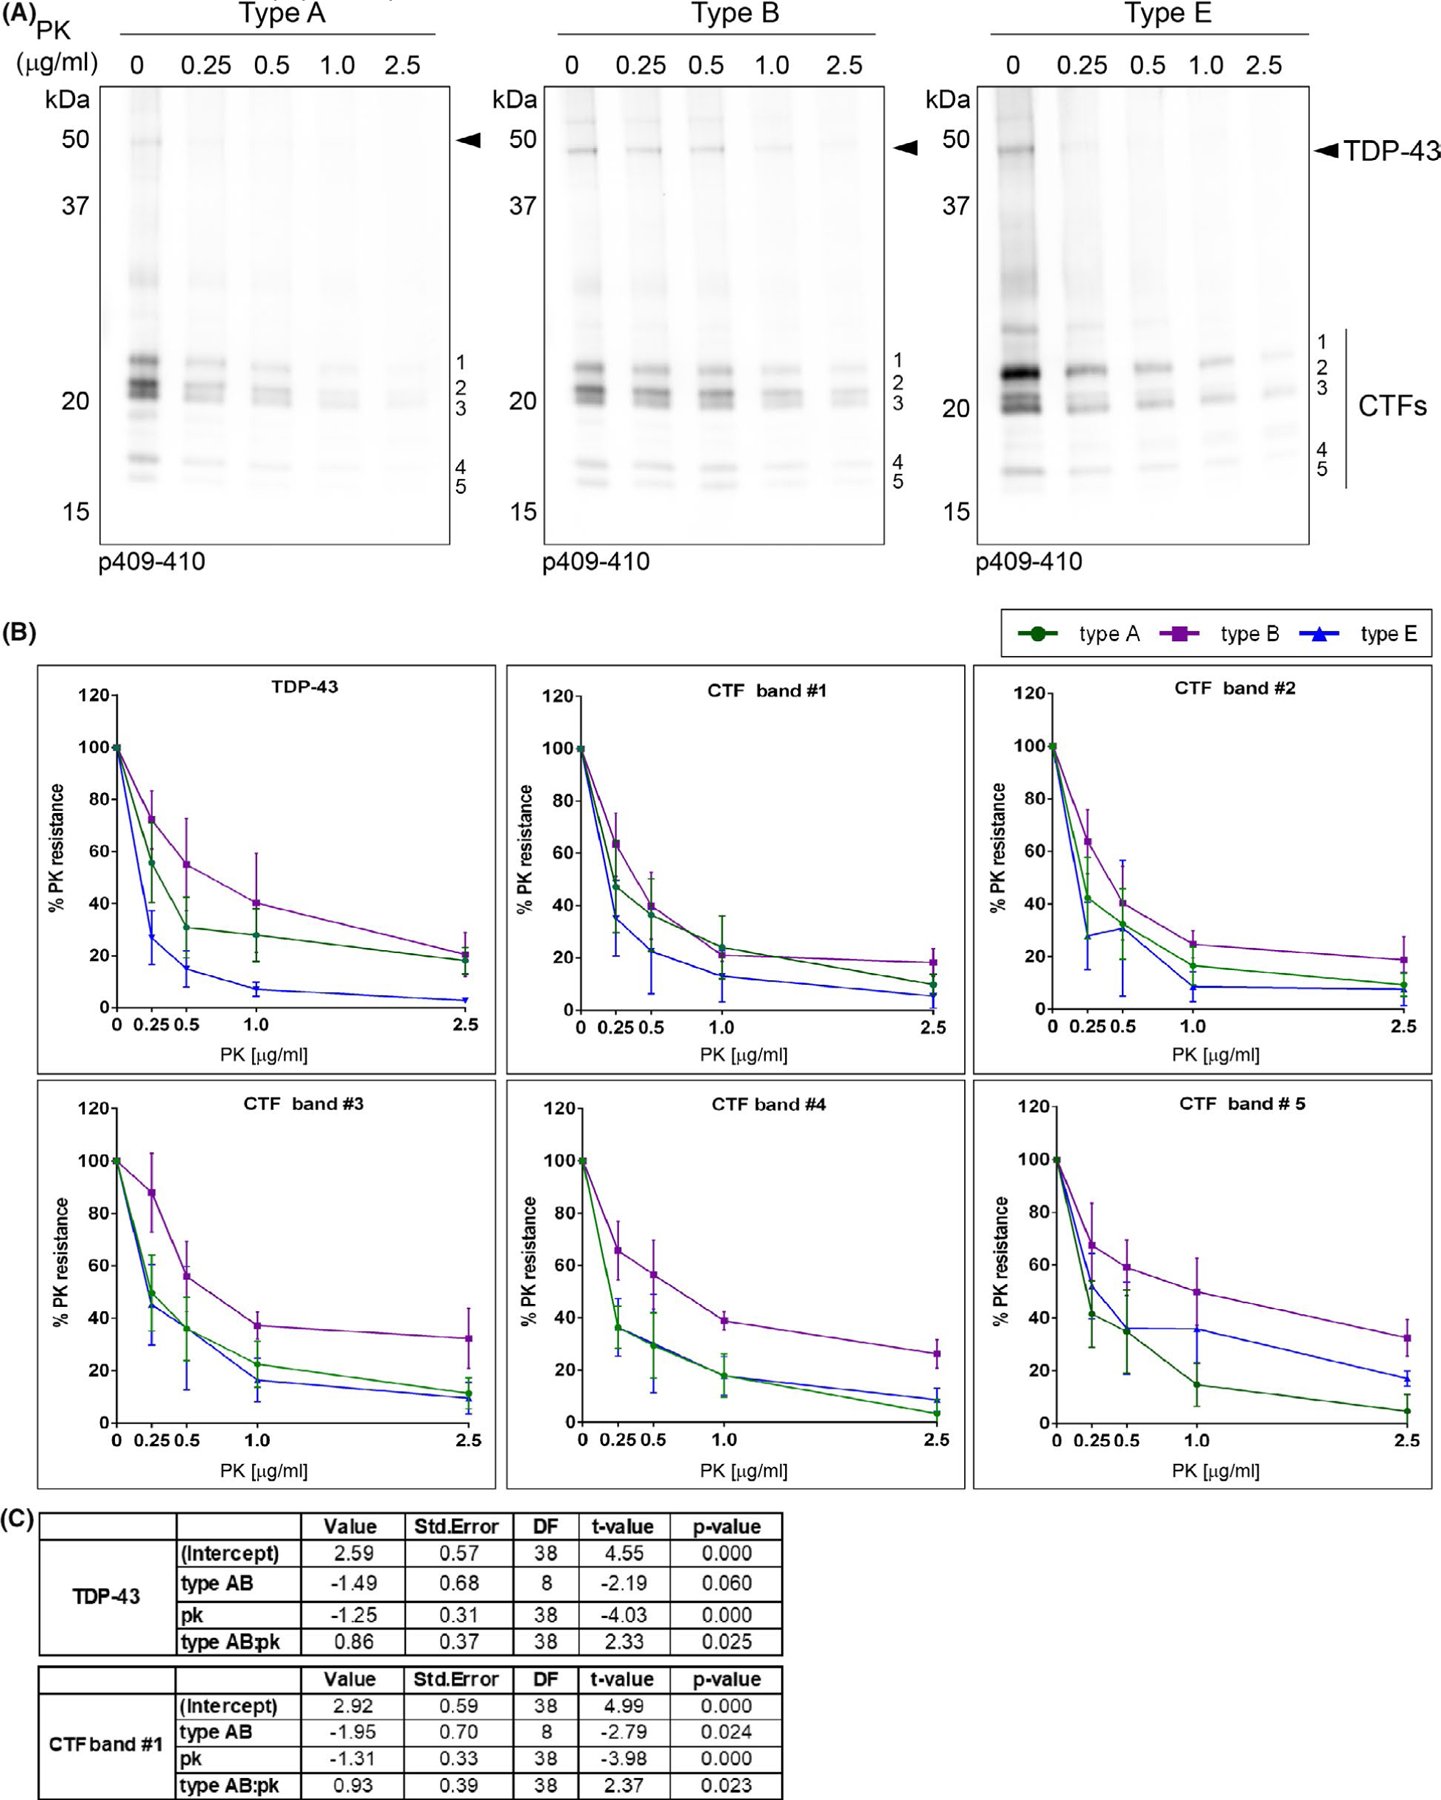
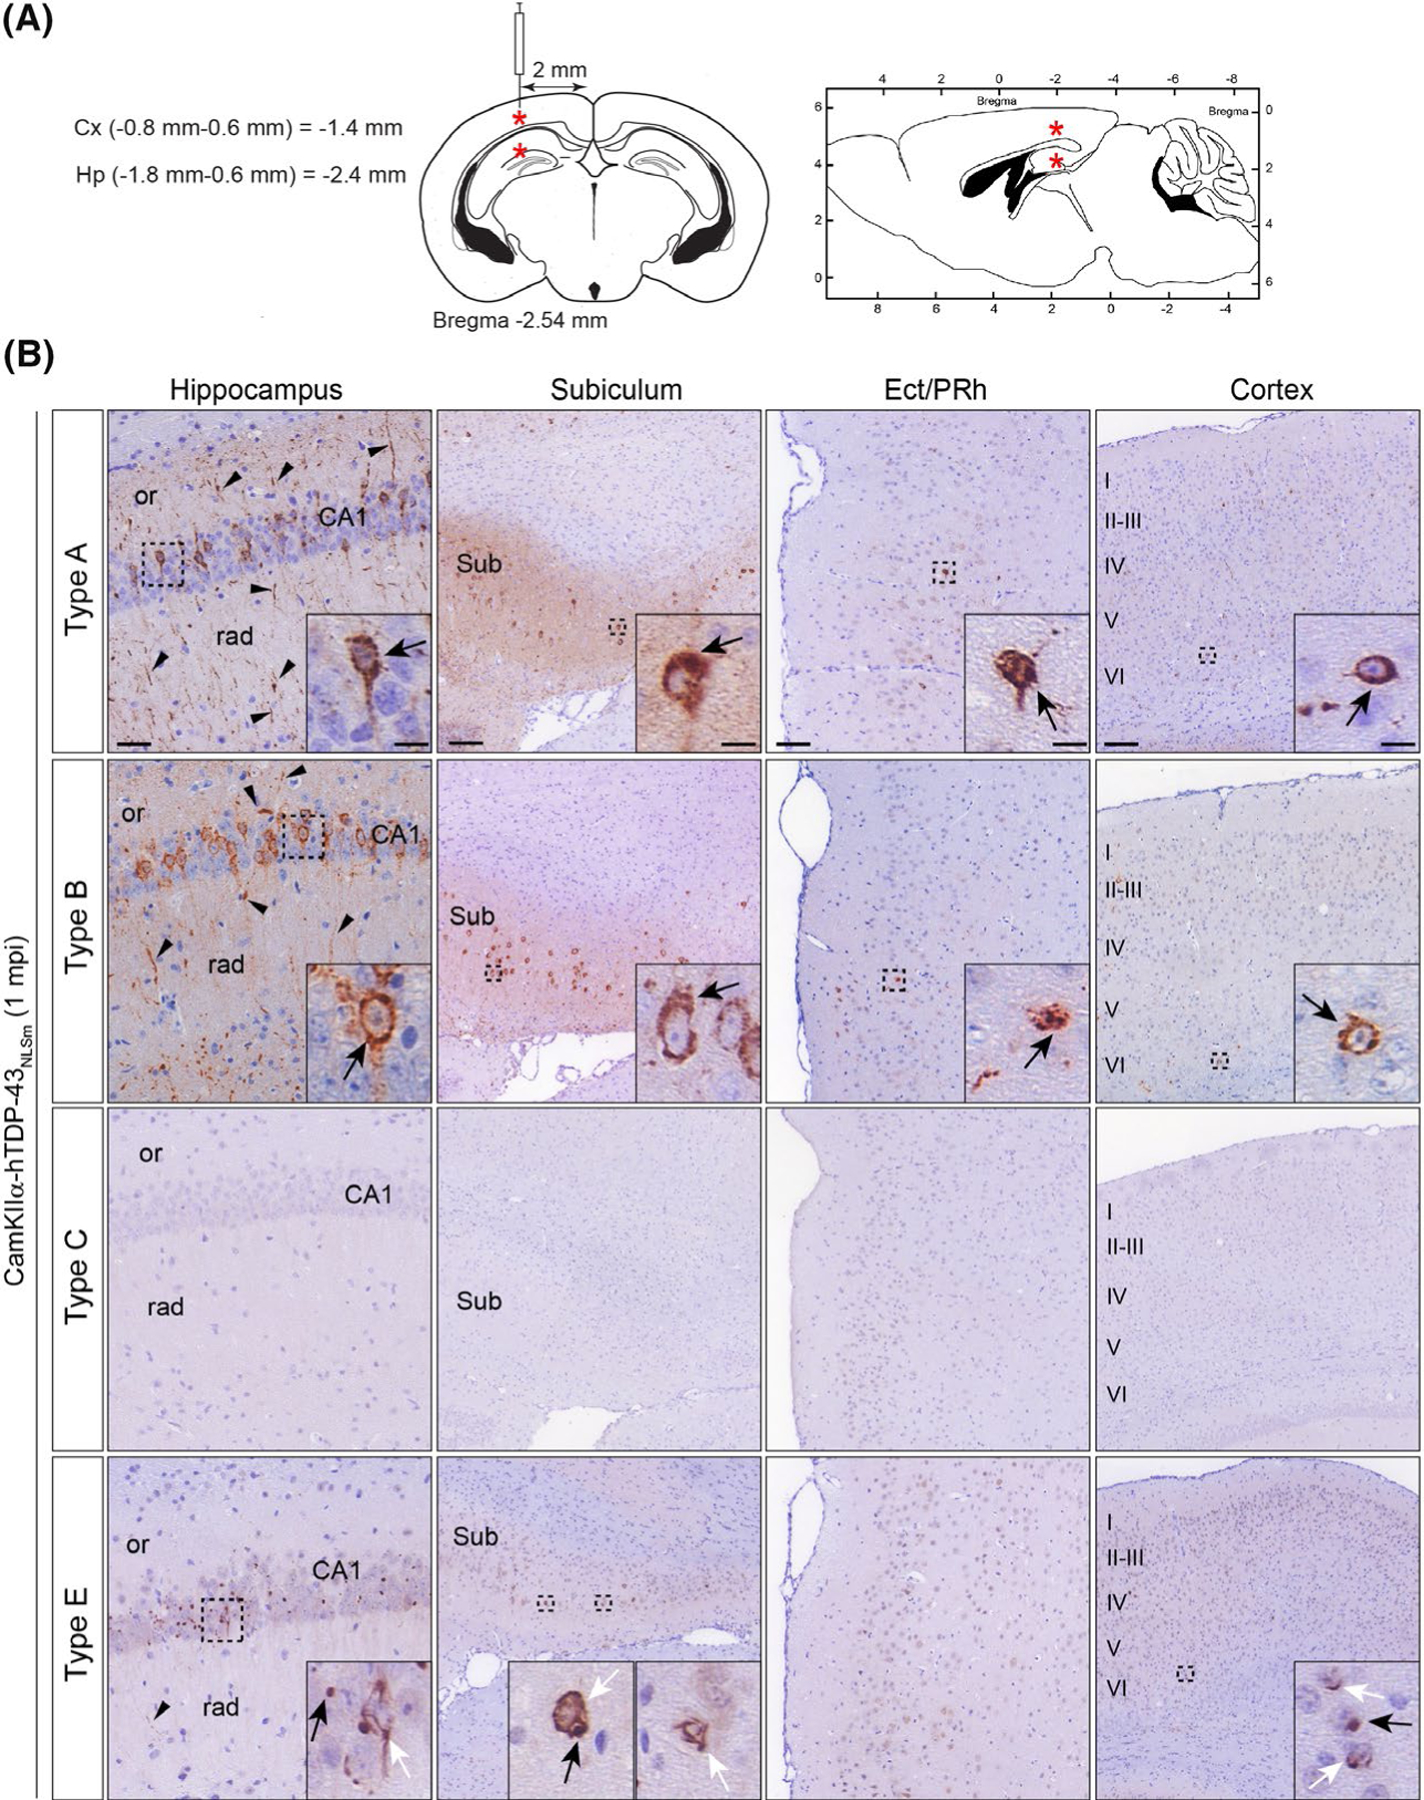
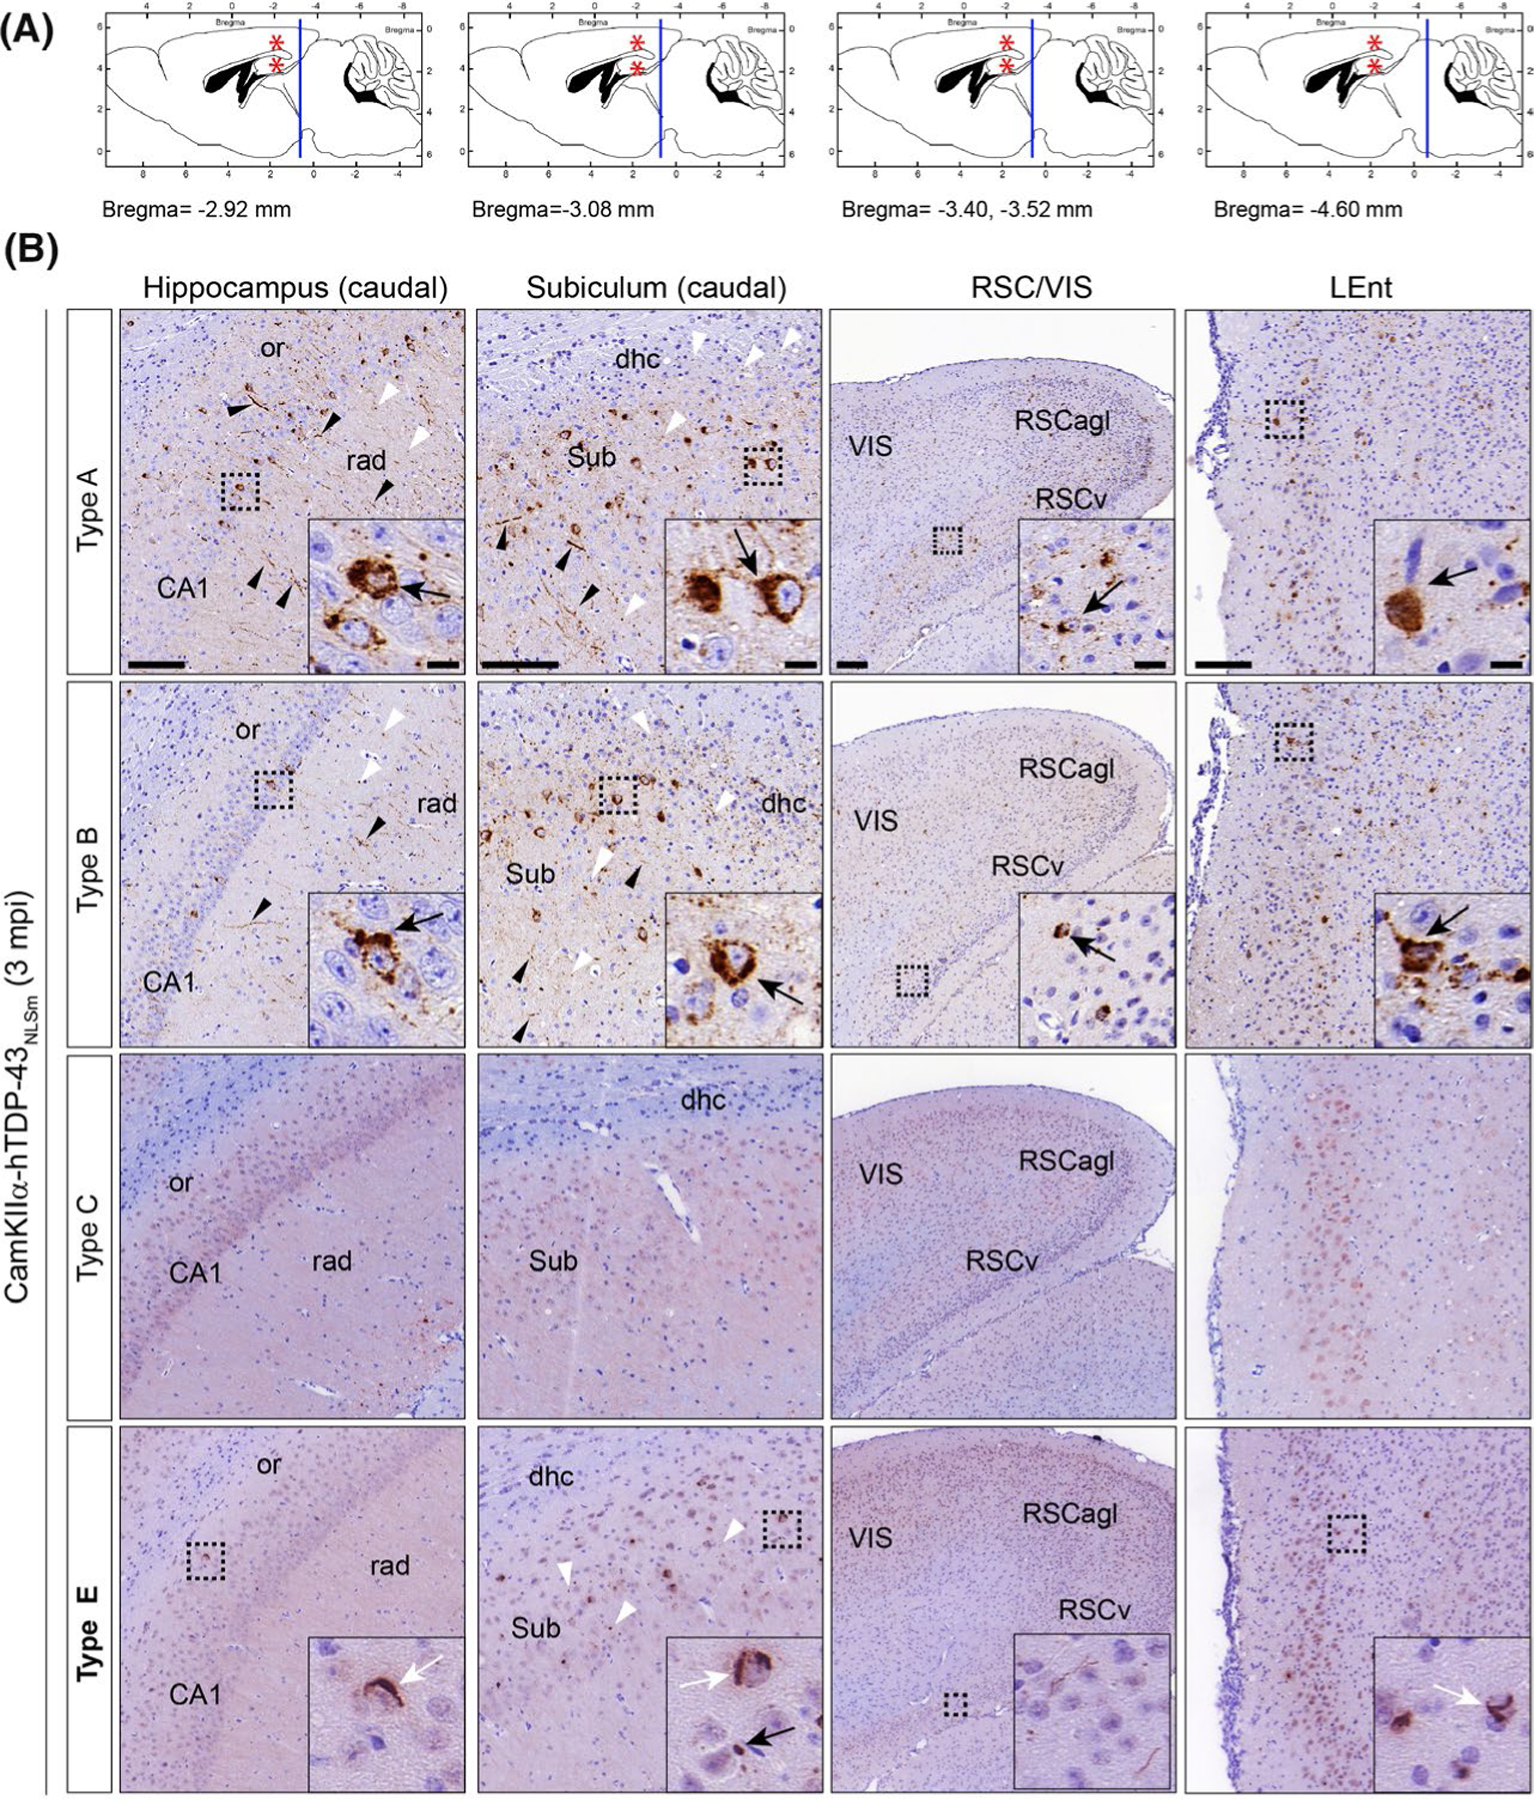
Methods and results: We used an inducible stable cell line expressing a mutant cytoplasmic TDP-43 (iGFP-NLSm) to evaluate the seeding properties of distinct pathological TDP-43 strains. Brain-derived TDP-43 protein extracts from FTLD-TDP types A (n = 6) and B (n = 3) cases induced the formation of round/spherical phosphorylated TDP-43 aggregates that morphologically differed from the linear and wavy wisps and bigger heterogeneous filamentous (skein-like) aggregates induced by type E (n = 3) cases. These morphological differences correlated with distinct biochemical banding patterns of sarkosyl-insoluble TDP-43 protein recovered from the transduced cells. Moreover, brain-derived TDP-43 extracts from type E cases showed higher susceptibility to PK digestion of full-length TDP-43 and the most abundant C-terminal fragments that characterise type E extracts. Finally, we showed that intracerebral injections of different TDP-43 strains induced a distinctive morphological and subcellular distribution of TDP-43 pathology and different spreading patterns in the brains of CamKIIa-hTDP-43NLSm Tg mice.

Conclusions: We show the existence of distinct TDP-43 strains in the brain of different FTLD-TDP subtypes with distinctive seeding and spreading properties in the brains of experimental animal models.

Keywords: TDP-43; frontotemporal lobar degeneration (FTLD); protein strains; seeding; spreading.


Conflict of interest statement

CONFLICT OF INTEREST

The authors declare no competing interests.

Figures

FIGURE 1
FIGURE 1
Morphological differences in TDP-43 aggregates in GFP-NLSm expressing cells seeded with brain-derived TDP-43 extracts from distinct FTLD-TDP subtypes. (A) Representative ICC images of GFP-NLSm expressing cells (green and merge) transduced with sark-insoluble brain extracts from different FTLD-TDP subtypes at 3 days post-transduction (dpt) showing 1% Ttriton-insoluble phospho-TDP-43-positive cytoplasmic aggregates (p409–410, magenta and merge). Cells were counterstained with DAPI to label the nuclei (blue). Insets show a magnification of spherical TDP-43 aggregates seeded by type A and type B extracts, and small linear, straight and wavy structures hence wisps seeded by type E extracts. Arrowhead points to heterogeneous filamentous structures hence skein-like aggregates seeded by type E extracts. Scale bar = 20 μm, insets bar = 10 μm. (B) Representative ICC images of a Z-stack maximum projection by confocal microscopy. Arrows point to characteristic p409–410-positive spherical aggregates (magenta) in GFP-NLSm expressing cells transduced with type A. Arrows and arrowheads point to p409–410-positive wisps and skein-like aggregates, respectively, in cells transduced with type E extracts (see also Movies 1 and 2). Cells were counterstained with DAPI to label the nuclei (blue). Scale bar = 10 μm. (C) Immunoelectron microscopy (EM) images show the ultrastructure of p409–410-positive spherical (arrows) and filamentous (arrowheads) aggregates in iGFP-NLSm cells transduced with type A and type E extracts respectively. Note the filaments are most evident where the immunolabelling is faint. Scale bar = 2 μm; insets bar = 1 μm. (D) Examples of immunofluorescent images (left panels, magenta) converted to digital binary images using ImageJ software (right panels) used to measure the roundness and circularity parameters of the silhouettes of p409–410-positive aggregates at 3dpt. Scale bar = 20 μm. Plots show percentages of the frequency distributions of roundness (left plot) and circularity (right plot) of p409–410-positive aggregates in GFP-NLSm expressing cells transduced with type A (black bars) vs. type E (white bars) extracts at 3 dpt. The calculated roundness and circularity distributions ranged from 0 to 1.0 values with 0.05 intervals. Statistically significant differences in the cumulative distribution of roundness and circularity between p409–410 aggregates in type A vs. type E seeded cells were found using the Kolmogorov–Smirnov unpaired t-test (p < 0.0001)
FIGURE 2
FIGURE 2
Time course characterisation for the formation of TDP-43 aggregates and their uniformity. (A) Representative ICC images show the formation of cytoplasmic p409–410-positive TDP-43 aggregates (magenta) in GFP-NLSm expressing cells (green) at 1, 2, and 3 dpt. Top panels show characteristic spherical aggregates induced when type A brain extracts are used as seeds (arrows) Bottom panels show characteristics wisps and skein-like aggregates induced by type E seeds (arrows and arrowheads respectively). Cells were counterstained with DAPI to label the nuclei (blue). Scale bar = 20 μm. (B) Plots show the percentages of GFP-NLSm expressing cells bearing p409–410-positive TDP-43 aggregates overtime that are categorised by different morphological features such as spherical (black bars), wisps/skein-like (grey bars) or both (white bars). Bar plots show the mean ± SEM. Each white dot represents a biological replicate (n = 3)
FIGURE 3
FIGURE 3
Distinct biochemical banding patterns of sark-insoluble TDP-43 proteins recovered from iGFP-NLSm cells transduced with pathogenic seeds from different FTLD-TDP subtypes. (A) Representative immunoblot analysis of the sark-insoluble fraction from GFP-NLSm expressing cells transduced with different FTLD-TDP subtypes (left panels, type A, B, C and E) and transduction reaction in presence or absence of dox (Dox− and Dox+, Bioporter, right panels). Cases are identified by numbers corresponding to those in Table S1 (Case ID #). A C-terminal TDP-43 antibody was used to detect pan-TDP-43 protein, and the phosphorylation-specific mAb Ser409/Ser410 (p409–410) was used to detect pathological TDP-43. Molecular weight markers in kDa are shown on the left and the position of the GFP-NLSm proteins, endogenous TDP-43 proteins (arrowhead), and three major bands corresponding to C-terminal fragments (CTFs, band #1, #2 and #3) and an N-terminal TDP-43 truncated fragment (asterisk) are shown on the right. (B) Immunoblot analysis of the sark-insoluble fractions from FTLD-TDP cases used as seeds (lanes type A, B and E) and the corresponding sark-insoluble fraction from the iGFP-NLSm cells transduced in the absence (lanes, Dox −) or presence of doxycycline (lanes Dox +) at 3 dpt. A C-terminal TDP-43 antibody (red and merged with green) was used to detect pan-TDP-43 protein and the p409–410 mAb was used to detect the pathological TDP-43 (green and merged with red). Molecular weight markers in kDa are shown on the left and the positions of the GFP-NLSm protein, endogenous TDP-43 protein (arrowhead, ~43 kDa), intermediate TDP-43 truncated fragments (asterisk), and three major bands corresponding to C-terminal fragments (CTFs) are shown on the right. White dashed box framing the CTF bands is shown for magnification standards in C (top panel). The schematic diagram in c (bottom panel) illustrates the distinct banding patterns of TDP-43 CTFs in the sark-insoluble extracts from the brains of patients with different FTLD-TDP subtypes (lanes type A, B and E) and the GFP-NLSm expressing cells (Dox+) transduced. The corresponding FTLD-TDP extracts also are shown here
FIGURE 4
FIGURE 4
Differences in PK resistance of insoluble TDP-43 protein between different FTLD-TDP subtypes. (A) Representative immunoblots show the digestion pattern of TDP-43 protein of sark-insoluble brain extracts (type A, type B and type E) treated with proteinase K (PK) using the p409–410 antibody. The different concentrations of PK (μg/ml) used in the assay are labelled in each lane. Molecular weight markers in kDa are shown on the left. Immunoblot show showed the presence of the full-length TDP-43 protein with a Mr of ~43 kDa (arrowhead) and the characteristic CTFs resulting from partial proteolysis including three major bands with a theoretical Mr ranging between ~20–26 kDa (bands #1, #2 and #3) and two minor bands at ~18–19 kDa (bands #4 and #5) on the right. (B) The signal of each p409–410-positive TDP and CTF band was quantified at each PK concentration as a percentage of the initial sample (PK = 0) and plotted as a percent of the PK resistance (%). Plots show the mean values (type A n = 4 cases, type B n = 3 cases, type E n = 3 cases) and whiskers SEM. (C) A linear mixed-effects model shows statistically significant differences in PK resistance of full-length TDP-43 proteins (TDP-43) and the C-terminal fragment with lower electrophoretic mobility (band #1) in type E extracts relative to type A and B extracts (TDP-43 p = 0.025, CTF band #1 p = 0.023)
FIGURE 5
FIGURE 5
Brain-derived TDP-43 strains from different FTLD-TDP subtypes have distinct seeding properties in vivo. (A) Schematic illustrations of coronal and sagittal brain sections (left and right respectively) with coordinates used for the stereotaxic injections into the brains of CamKIIa-hTDP-43NLSm mice. Red asterisks indicate the injection site in the hippocampus and overlying cortex. (B) Representative photomicrographs of p409–410 immunostaining of phospho-TDP-43 in coronal brain sections from CamKIIa-hTDP43NLSm mice stereotaxically injected with human brain-derived TDP-43 protein extracts from different FTLD-TDP subtypes; type A, type B, type C and type E at 1 mpi. Images show p409–410-positive staining in the ipsilateral hippocampus (cornu amonis (CA1 layer), stratum radiatum (rad), and oriens (or)), in the subiculum (Sub), in the ectorhinal/perirhinal cortex (Ect/PRh) and neocortex (cortex, layers I–VI). Black arrowheads point to p409–410-positive neuronal processes in the neuropil. Insets show higher magnifications of the black-dashed boxes. In type A and B injected mice, black arrows point to neurons with intensely stained cytoplasmic p409–410-positive aggregates. In type E injected mice, black arrows point to p409–410-positive dot-like inclusions and white arrows point to p409–410-positive skein-like aggregates
FIGURE 6
FIGURE 6
TDP-43 pathology induced in the brain of CamKIIa-hTDP-43NLSm mice injected with brain-derived TDP-43 from different FTLD-TDP subtypes exhibited distinctive spreading patterns over-time. (A) Panels illustrate sagittal brain views of the mouse brain. The red asterisks indicate the injection site in the hippocampus and overlying cortex. Blue lines indicate the localization of the coronal brain sections corresponding to images in B; hippocampus (caudal) (Bregma −2.92 mm), subiculum (caudal) (Bregma −3.08 mm), restrosplenial cortex and primary visual cortex (RSC/VIS) (Bregma −3.40 and −3.52 mm), and lateral entorhinal cortex (LEnt) (Bregma −4.60 mm). (B) Representative photomicrographs of mAb p409–410 immunostaining in coronal brain sections from CamKIIa-hTDP43NLSm mice stereotaxically injected with human brain-derived TDP-43 from different FTLD-TDP subtypes; type A, type B, type C, and type E at 3 mpi. Images show p409–410 positive staining in the ipsilateral side of the brain, in caudal areas distal from the injection site such as; hippocampus (cornu amonis (CA1 layer), stratum radiatum (rad), and oriens (or)), subiculum (sub) and including the dorsal hippocampal commissure (dhc), ventral and lateral agranular RSC (RSCv and RSCagl), VIS and LEnt. Black arrowheads point to p409–410 positive short and long neurites and white arrowheads to dotted staining in the neuropil. Insets show higher magnifications of the black-dashed boxes; in type A and B injected mice, black arrows point to neurons with widespread cytoplasmic p409–410 positive aggregates whereas in type E injected mice, black arrows point to dot-like inclusions and white arrows skein-like aggregates. Scale bar = 100 μm, and 10 μm (insets)

Similar articles

Cited by

References

    1. Neumann M, Sampathu DM, Kwong LK, et al. Ubiquitinated TDP-43 in frontotemporal lobar degeneration and amyotrophic lateral sclerosis. Science. 2006;314(5796):130–133. - PubMed
    1. Cairns NJ, Neumann M, Bigio EH, et al. TDP-43 in familial and sporadic frontotemporal lobar degeneration with ubiquitin inclusions. Am J Pathol. 2007;171(1):227–240. - PMC - PubMed
    1. Forman MS, Mackenzie IR, Cairns NJ, et al. Novel ubiquitin neuropathology in frontotemporal dementia with valosin-containing protein gene mutations. J Neuropathol Exp Neurol. 2006;65(6):571–581. - PubMed
    1. Geser F, Martinez-Lage M, Robinson J, et al. Clinical and pathological continuum of multisystem TDP-43 proteinopathies. Arch Neurol. 2009;66(2):180–189. - PMC - PubMed
    1. Josephs KA, Stroh A, Dugger B, Dickson DW. Evaluation of subcortical pathology and clinical correlations in FTLD-U subtypes. Acta Neuropathol. 2009;118(3):349–358. - PMC - PubMed

Publication types