

How mobility restrictions policy and atmospheric conditions impacted air quality in the State of São Paulo during the COVID-19 outbreak
- PMID: 33971134
- PMCID: PMC8547779
- DOI: 10.1016/j.envres.2021.111255
How mobility restrictions policy and atmospheric conditions impacted air quality in the State of São Paulo during the COVID-19 outbreak
Abstract
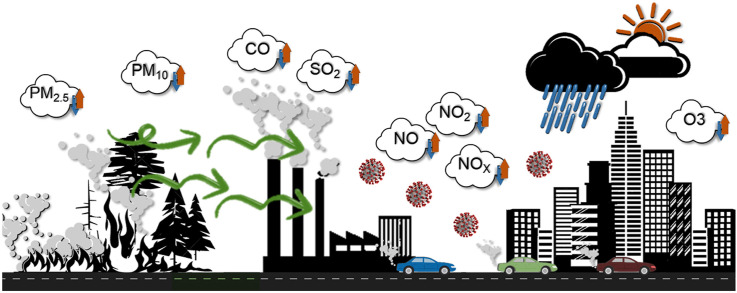
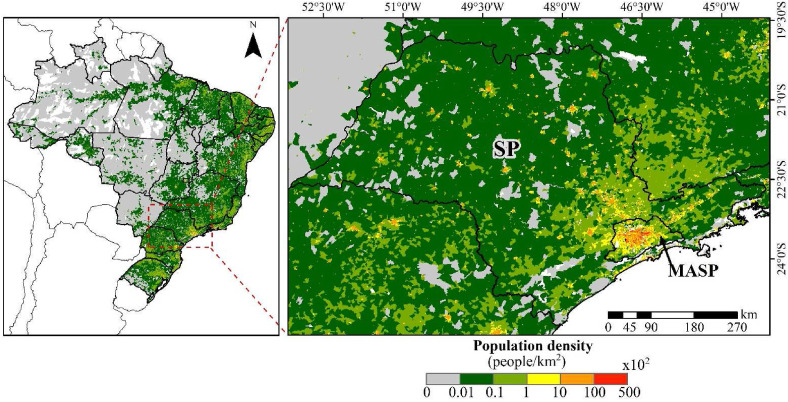
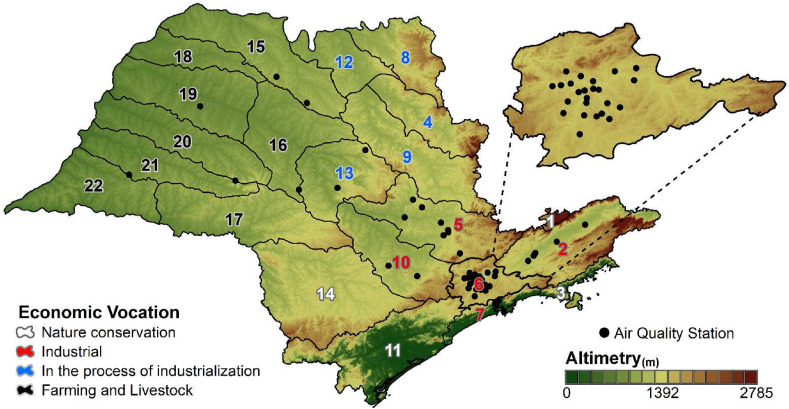
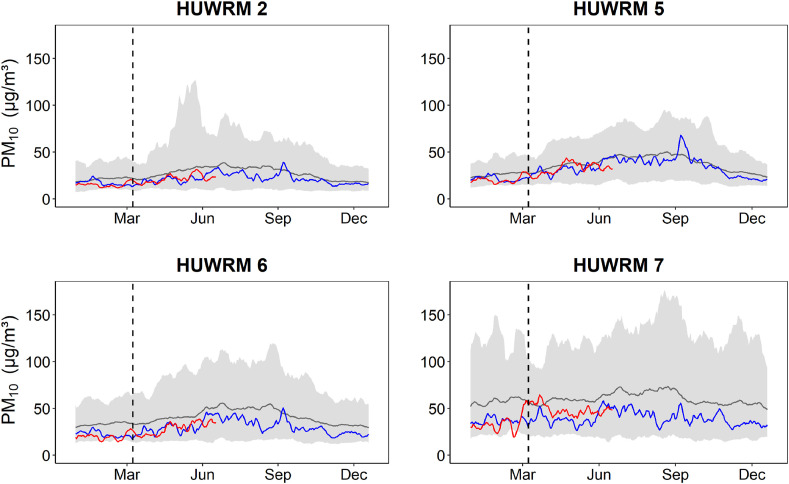
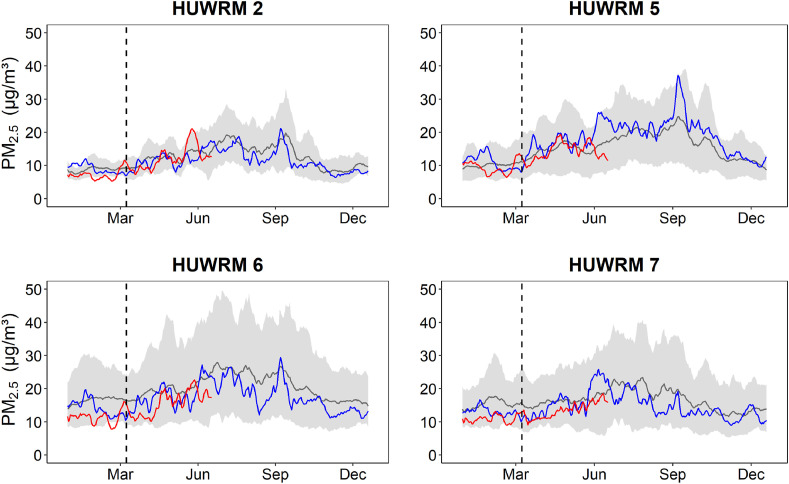
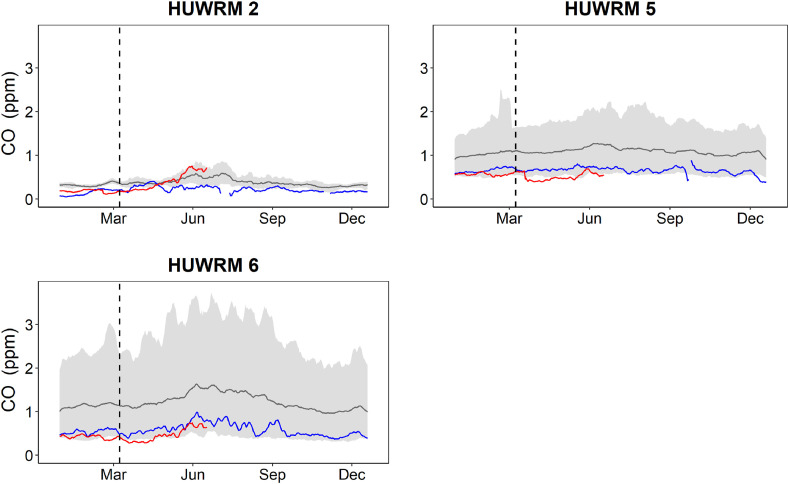
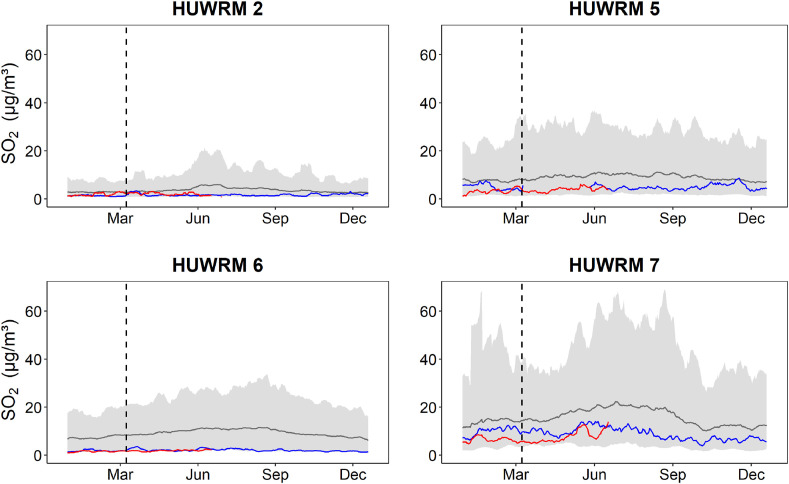
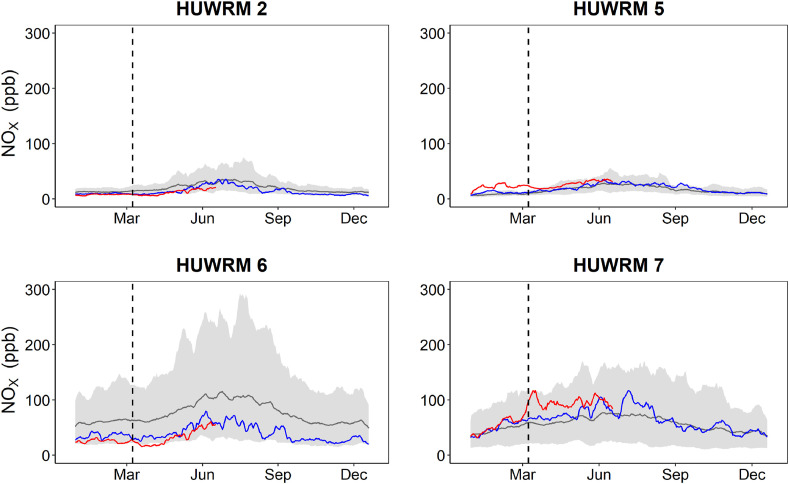
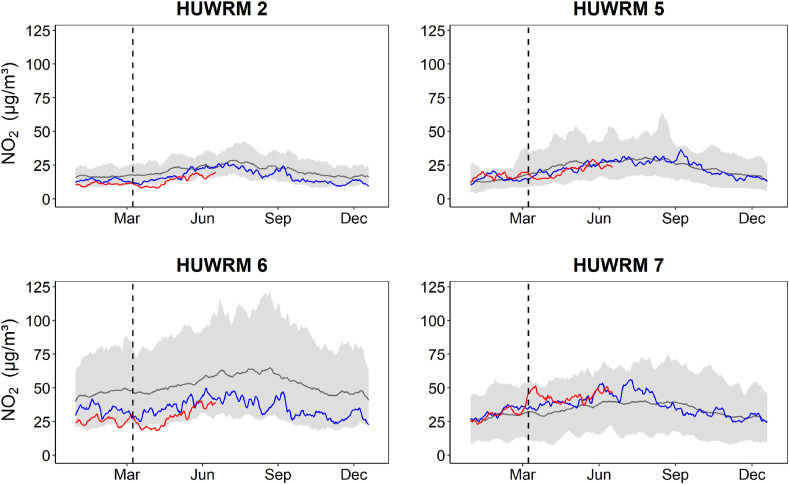
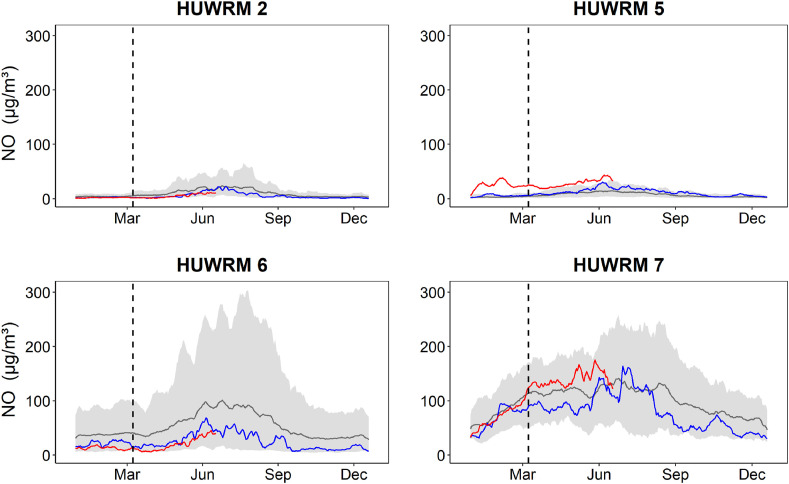
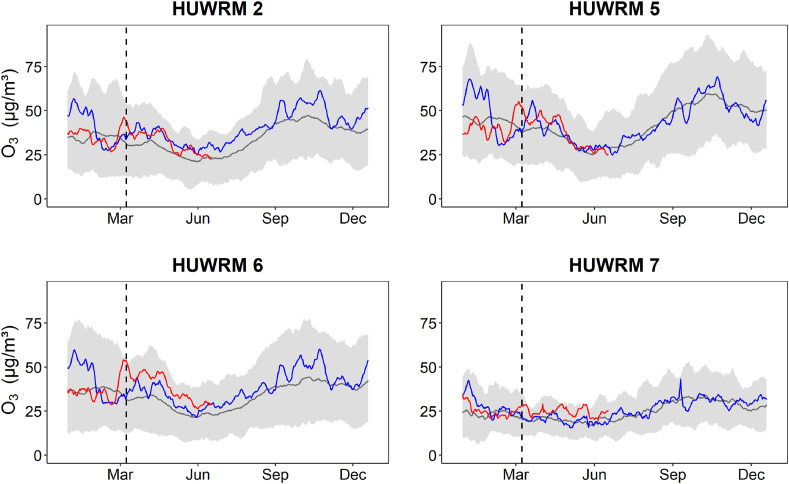
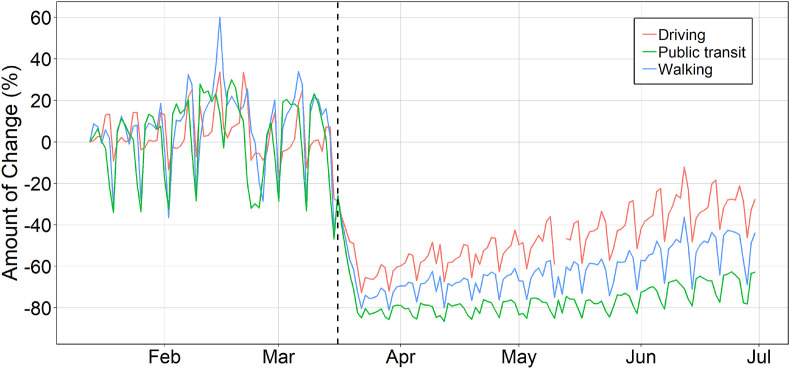
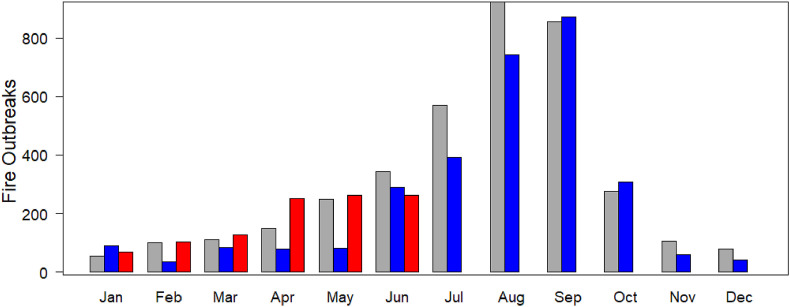
Mobility restrictions are among actions to prevent the spread of the COVID-19 pandemic and have been pointed as reasons for improving air quality, especially in large cities. However, it is crucial to assess the impact of atmospheric conditions on air quality and air pollutant dispersion in the face of the potential variability of all sources. In this study, the impact of mobility restrictions on the air quality was analyzed for the most populous Brazilian State, São Paulo, severely impacted by COVID-19. Ground-based air quality data (PM10, PM2.5, CO, SO2, NOx, NO2, NO, and O3) were used from 50 automatic air quality monitoring stations to evaluate the changes in concentrations before (January 01 - March 25) and during the partial quarantine (March 16 - June 30). Rainfall, fires, and daily cell phone mobility data were also used as supplementary information to the analyses. The Mann-Whitney U test was used to assess the heterogeneity of the air quality data during and before mobility restrictions. In general, the results demonstrated no substantial improvements in air quality for most of the pollutants when comparing before and during restrictions periods. Besides, when the analyzed period of 2020 is compared with the year 2019, there is no significant air quality improvement in the São Paulo State. However, special attention should be given to the Metropolitan Area of São Paulo (MASP), due to the vast population residing in this area and exposed to air pollution. The region reached an average decrease of 29% in CO, 28% in NOx, 40% in NO, 19% in SO2, 15% in PM2.5, and 8% in PM10 concentrations during the mobility restrictions period compared to the same period in 2019. The only pollutant that showed an increase in concentration was ozone, with a 20% increase compared to 2019 during the mobility restrictions period. Before the mobility restrictions period, the region reached an average decrease of 30% in CO, 39% in NOx, 63% in NO, 12% in SO2, 23% in PM2.5, 18% in PM10, and 16% in O3 concentrations when compared to the same period in 2019. On the other hand, Cubatão, a highly industrialized area, showed statistically significant increases above 20% for most monitored pollutants in both periods of 2020 compared to 2019. This study reinforces that the main driving force of pollutant concentration variability is the dynamics of the atmosphere at its various time scales. An abnormal rainy season, with above average rainfall before the restrictions and below average after it, generated a scenario in which the probable significant reductions in emissions did not substantially affect the concentration of pollutants.
Keywords: Air pollutants; Air quality; Coronavirus disease; Mobility restriction.
Copyright © 2021 Elsevier Inc. All rights reserved.
Conflict of interest statement
The authors declare that they have no known competing financial interests or personal relationships that could have appeared to influence the work reported in this paper.
Figures
Similar articles
-
A global observational analysis to understand changes in air quality during exceptionally low anthropogenic emission conditions.Environ Int. 2021 Dec;157:106818. doi: 10.1016/j.envint.2021.106818. Epub 2021 Aug 20. Environ Int. 2021. PMID: 34425482
-
Heterogeneous impacts of mobility restrictions on air quality in the State of Sao Paulo during the COVID-19 pandemic.Environ Pollut. 2022 May 1;300:118984. doi: 10.1016/j.envpol.2022.118984. Epub 2022 Feb 10. Environ Pollut. 2022. PMID: 35151813
-
Multicity study of air pollution and mortality in Latin America (the ESCALA study).Res Rep Health Eff Inst. 2012 Oct;(171):5-86. Res Rep Health Eff Inst. 2012. PMID: 23311234
-
Effect of COVID-19 pandemic on air quality: a study based on Air Quality Index.Environ Sci Pollut Res Int. 2021 Jul;28(27):35564-35583. doi: 10.1007/s11356-021-14462-9. Epub 2021 May 25. Environ Sci Pollut Res Int. 2021. PMID: 34036496 Free PMC article. Review.
-
In-depth analysis of ambient air pollution changes due to the COVID-19 pandemic in the Asian Monsoon region.Sci Total Environ. 2024 Sep 1;941:173145. doi: 10.1016/j.scitotenv.2024.173145. Epub 2024 May 18. Sci Total Environ. 2024. PMID: 38768732 Review.
Cited by
-
Empirical evidence shows that air quality changes during COVID-19 pandemic lockdown in Jakarta, Indonesia are due to seasonal variation, not restricted movements.Environ Res. 2022 May 15;208:112391. doi: 10.1016/j.envres.2021.112391. Epub 2021 Nov 17. Environ Res. 2022. PMID: 34800535 Free PMC article.
-
The Apple Mobility Trends Data in Human Mobility Patterns during Restrictions and Prediction of COVID-19: A Systematic Review and Meta-Analysis.Healthcare (Basel). 2022 Nov 30;10(12):2425. doi: 10.3390/healthcare10122425. Healthcare (Basel). 2022. PMID: 36553949 Free PMC article. Review.
-
Evaluating TROPOMI and MODIS performance to capture the dynamic of air pollution in São Paulo state: A case study during the COVID-19 outbreak.Remote Sens Environ. 2023 May 1;289:113514. doi: 10.1016/j.rse.2023.113514. Epub 2023 Feb 21. Remote Sens Environ. 2023. PMID: 36846486 Free PMC article.
-
Spatial analysis of socio-economic factors and their relationship with the cases of COVID-19 in Pernambuco, Brazil.Trop Med Int Health. 2022 Apr;27(4):397-407. doi: 10.1111/tmi.13731. Epub 2022 Feb 11. Trop Med Int Health. 2022. PMID: 35128767 Free PMC article.
References
-
- Alvares C.A., Stape J.L., Sentelhas P.C., Gonçalves J.L. de M., Sparovek G., Gerd S. Köppen’s climate classification map for Brazil. Meteorol. Z. 2013;22:711–728. doi: 10.1127/0941-2948/2013/0507. - DOI
-
- Alvim D.S., Gatti L.V., Corrêa S.M., Chiquetto J.B., Santos G.M., de Souza Rossatti C., Pretto A., Rozante J.R., Figueroa S.N., Pendharkar J., Nobre P. Determining VOCs reactivity for ozone forming potential in the megacity of São Paulo. Aerosol Air Qual. Res. 2018;18:2460–2474. doi: 10.4209/aaqr.2017.10.0361. - DOI
-
- Andersson C., Langner J., Bergstroumm R. Interannual variation and trends in air pollution over Europe due to climate variability during 1958–2001 simulated with a regional CTM coupled to the ERA40 reanalysis. Tellus B. 2007;59:77–98. doi: 10.1111/j.1600-0889.2006.00231.x. - DOI
Publication types
MeSH terms
Substances
LinkOut - more resources
Full Text Sources
Other Literature Sources
Medical
