. 2021 Jul 1:192:108601.
doi: 10.1016/j.neuropharm.2021.108601. Epub 2021 May 7.

Oxytocin excites BNST interneurons and inhibits BNST output neurons to the central amygdala

Affiliations

Oxytocin excites BNST interneurons and inhibits BNST output neurons to the central amygdala

Walter Francesconi et al. Neuropharmacology. .

Abstract

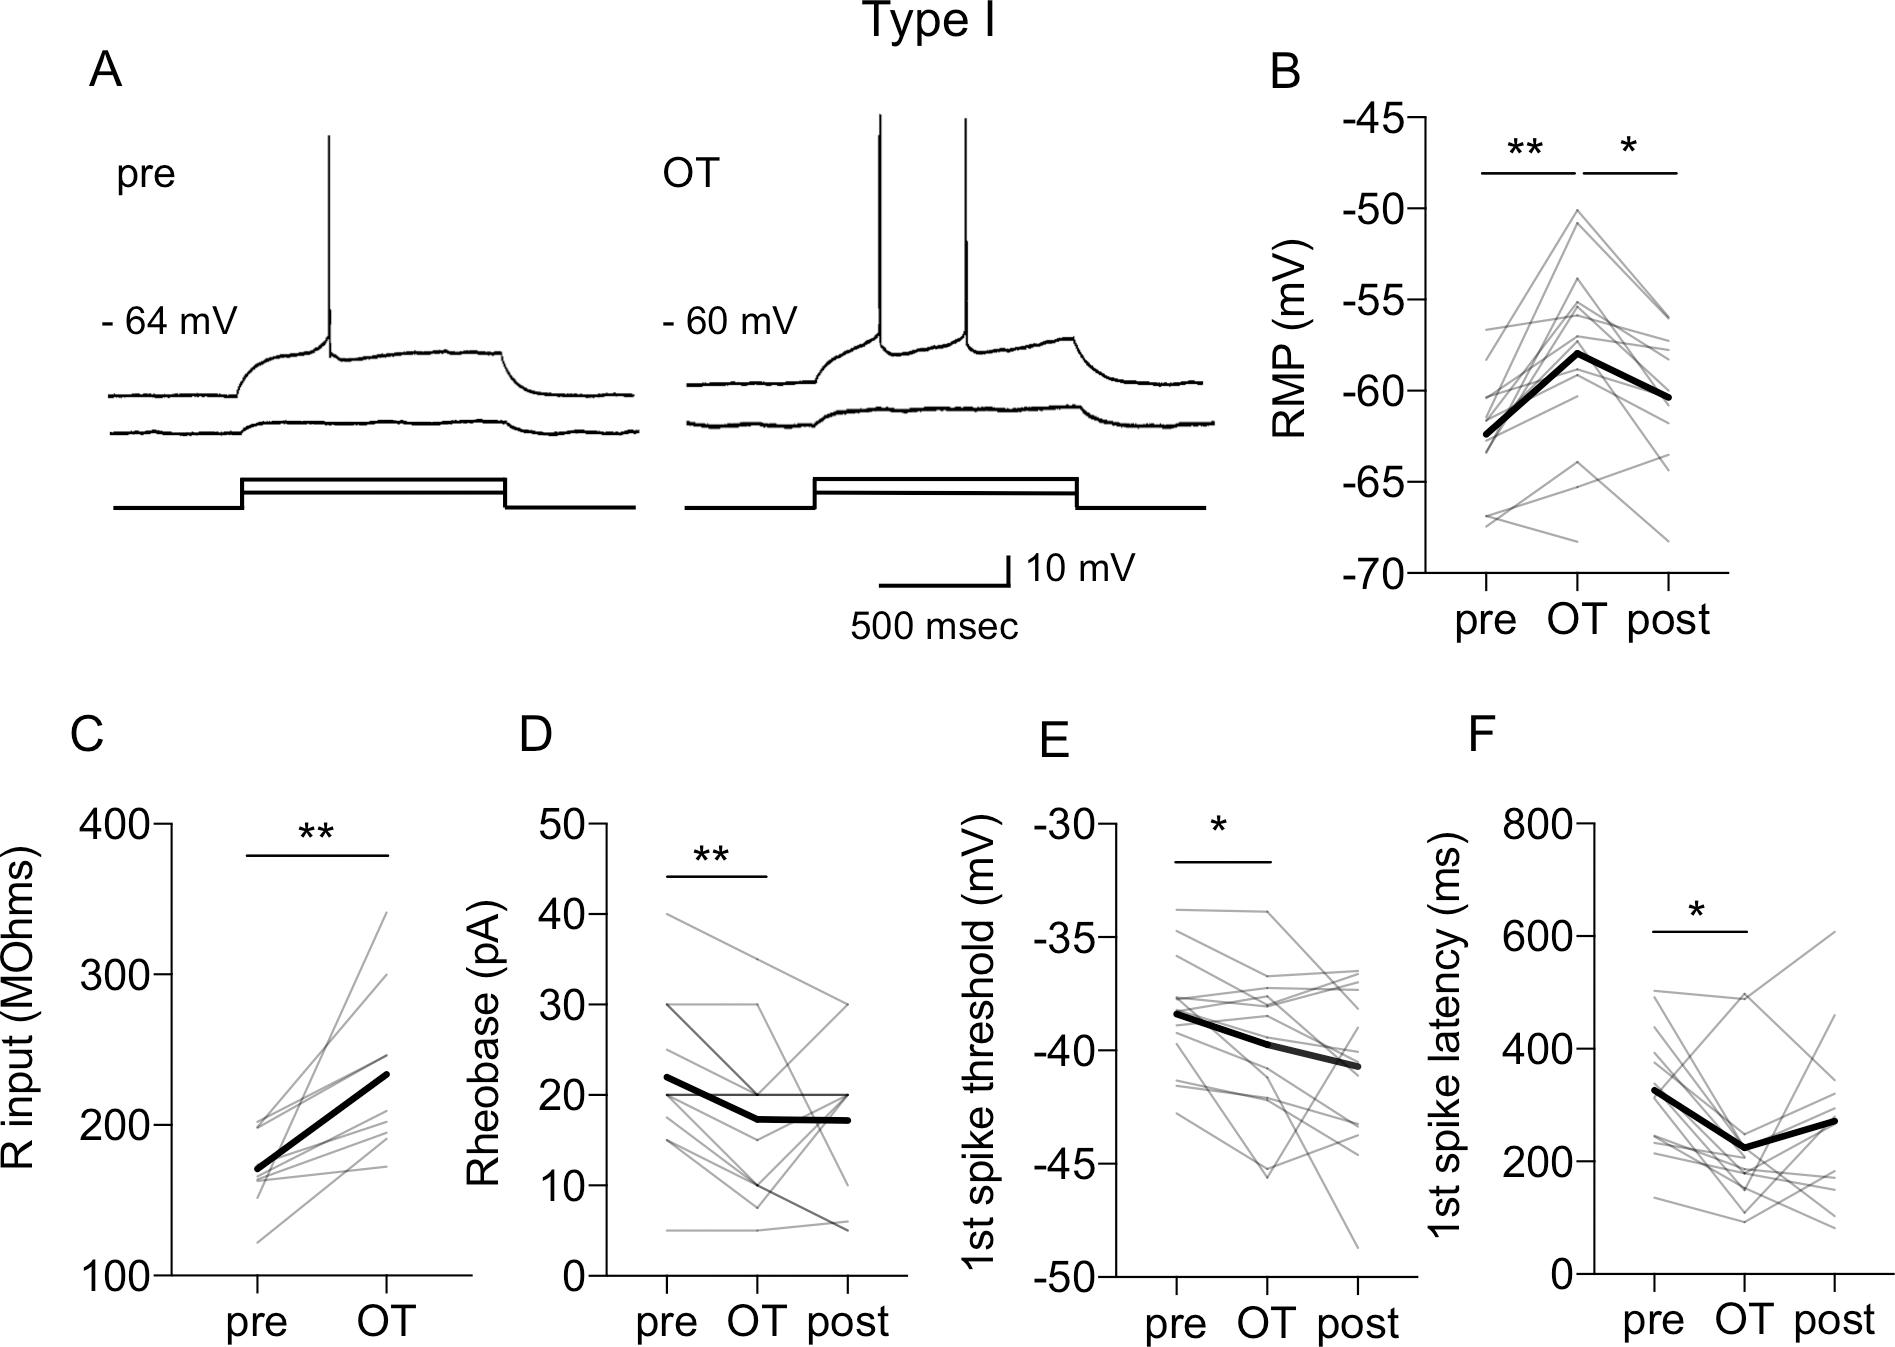
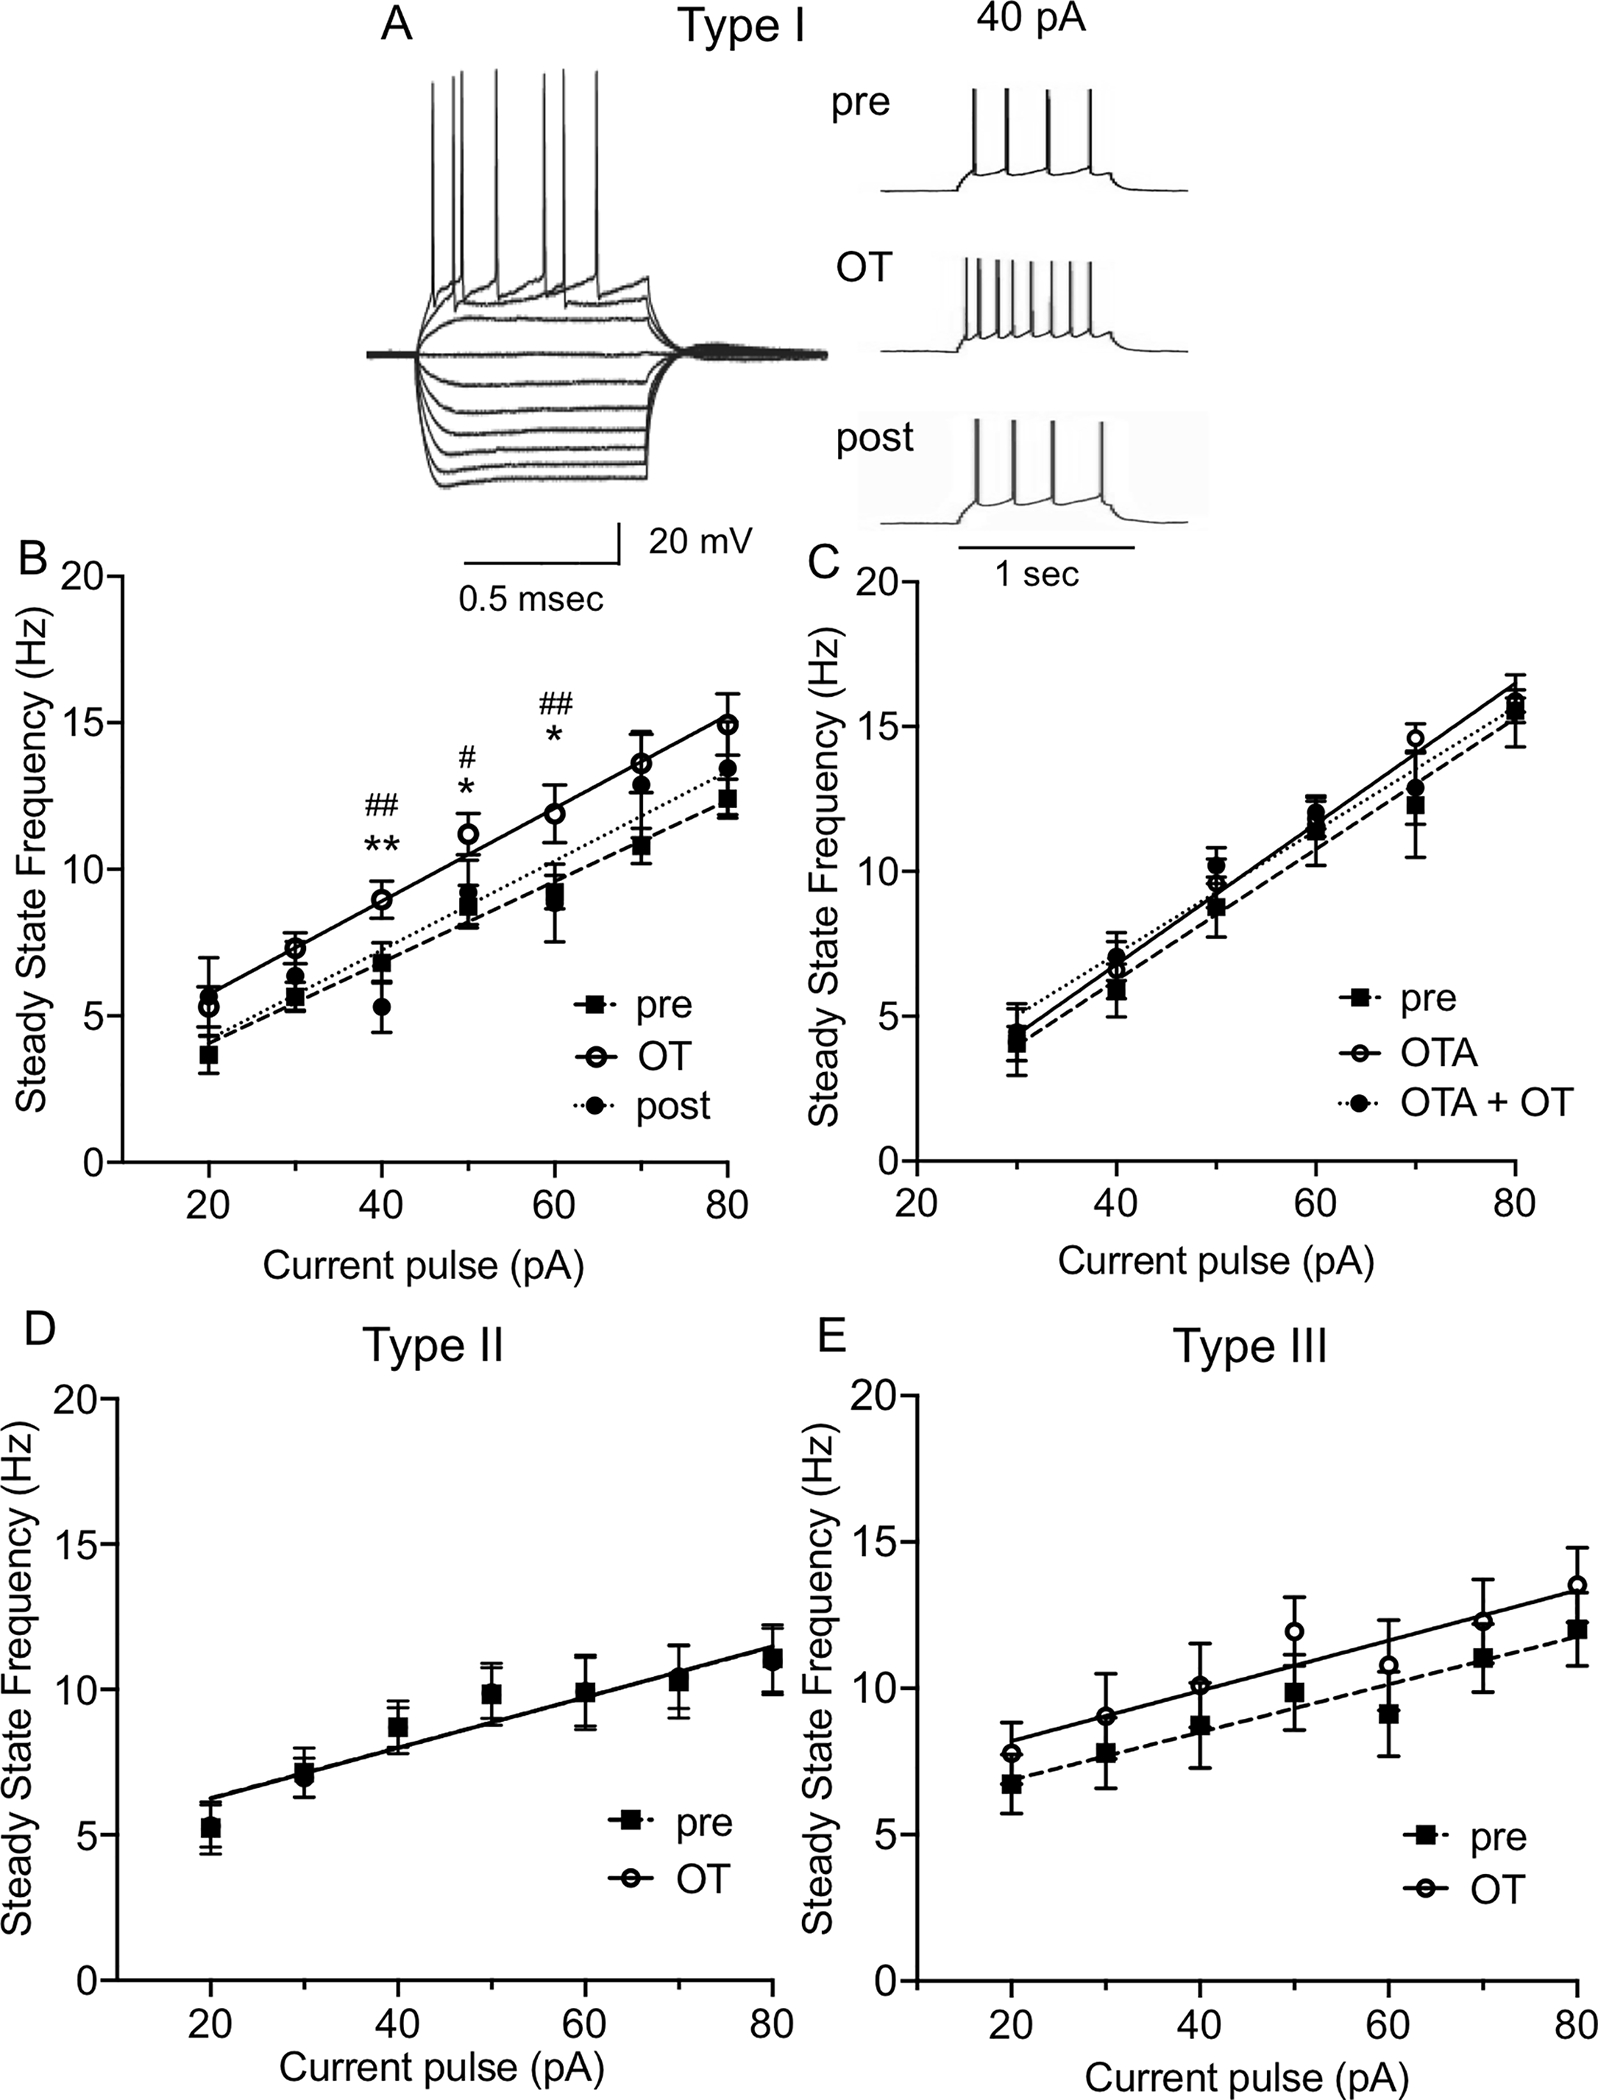
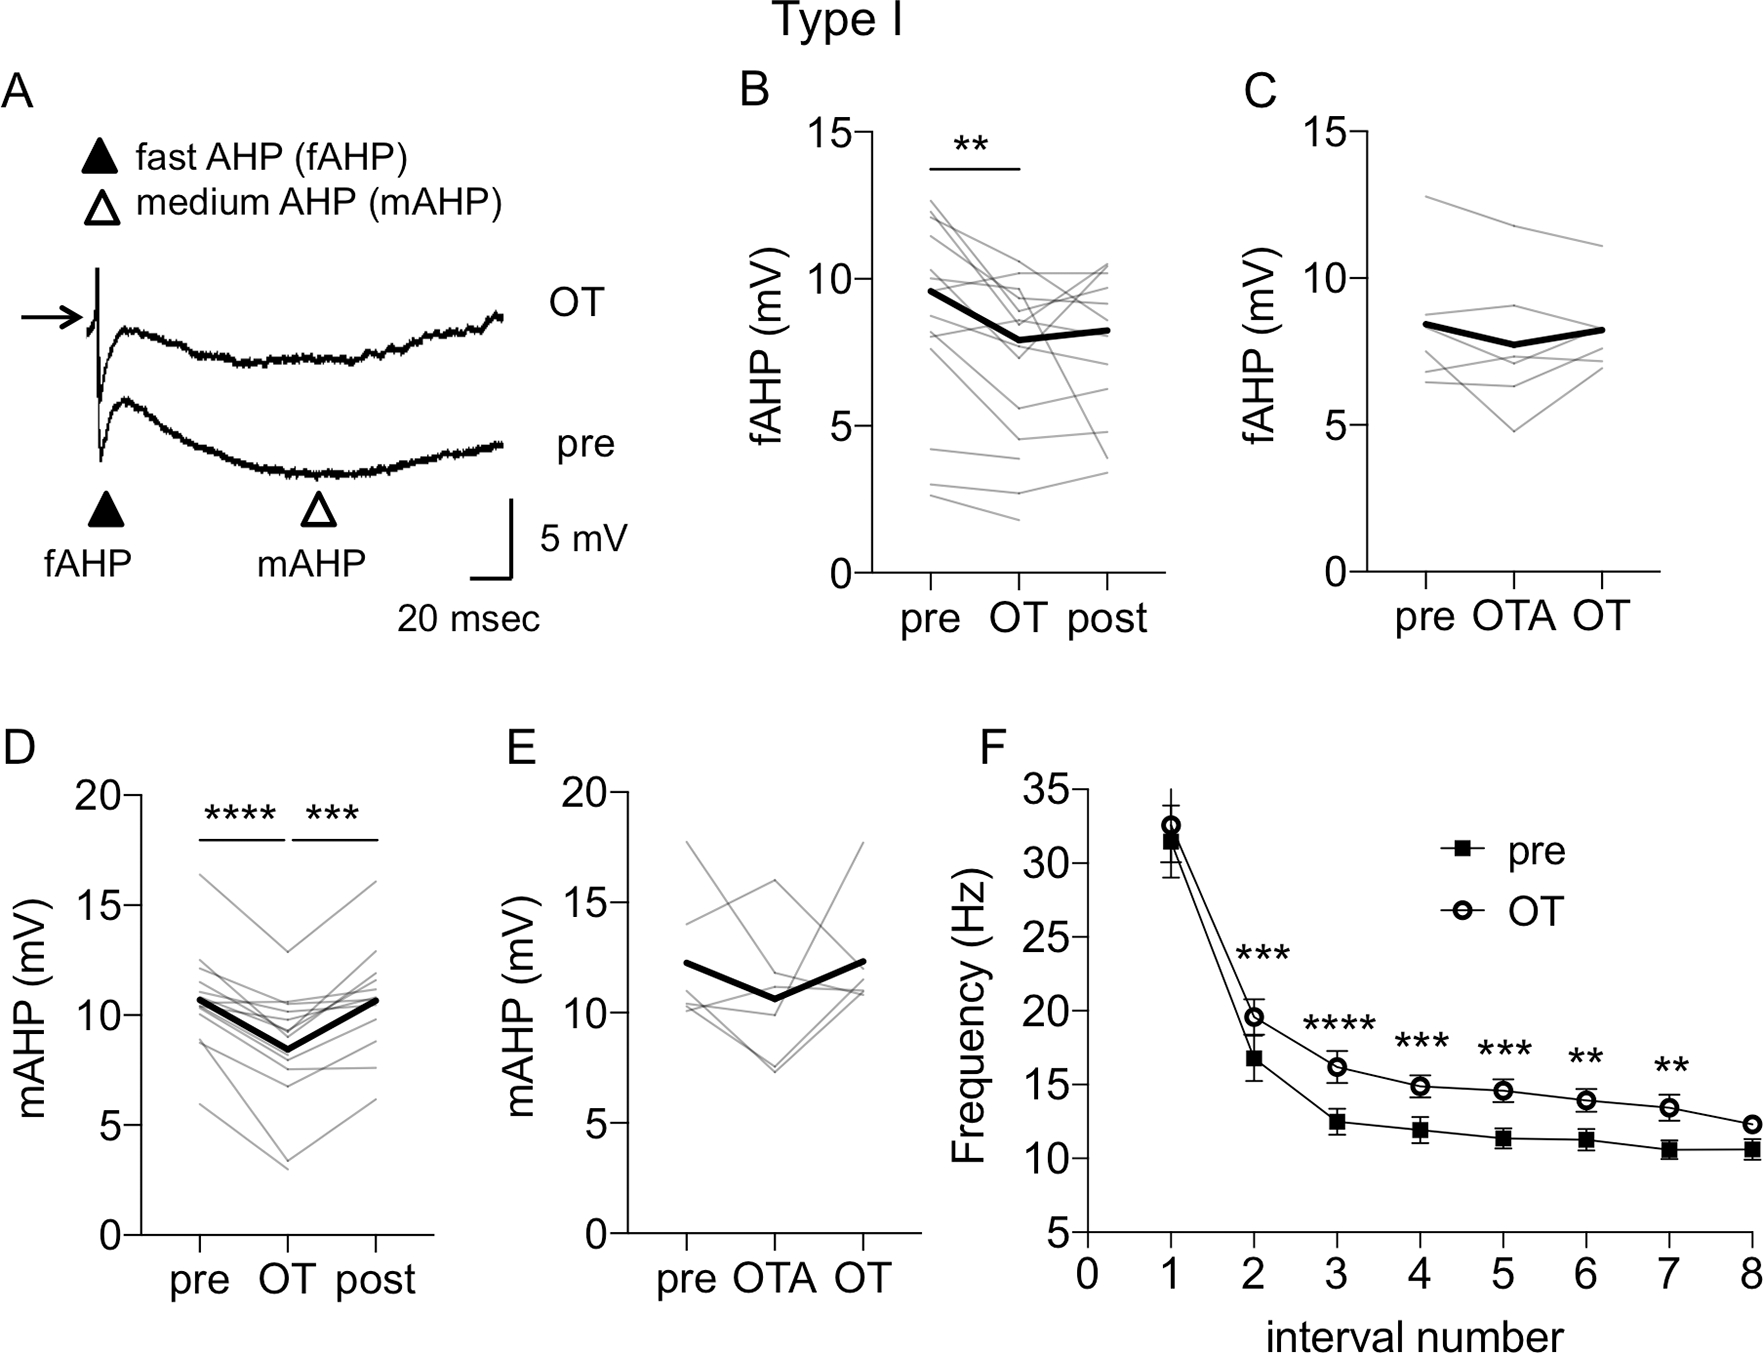
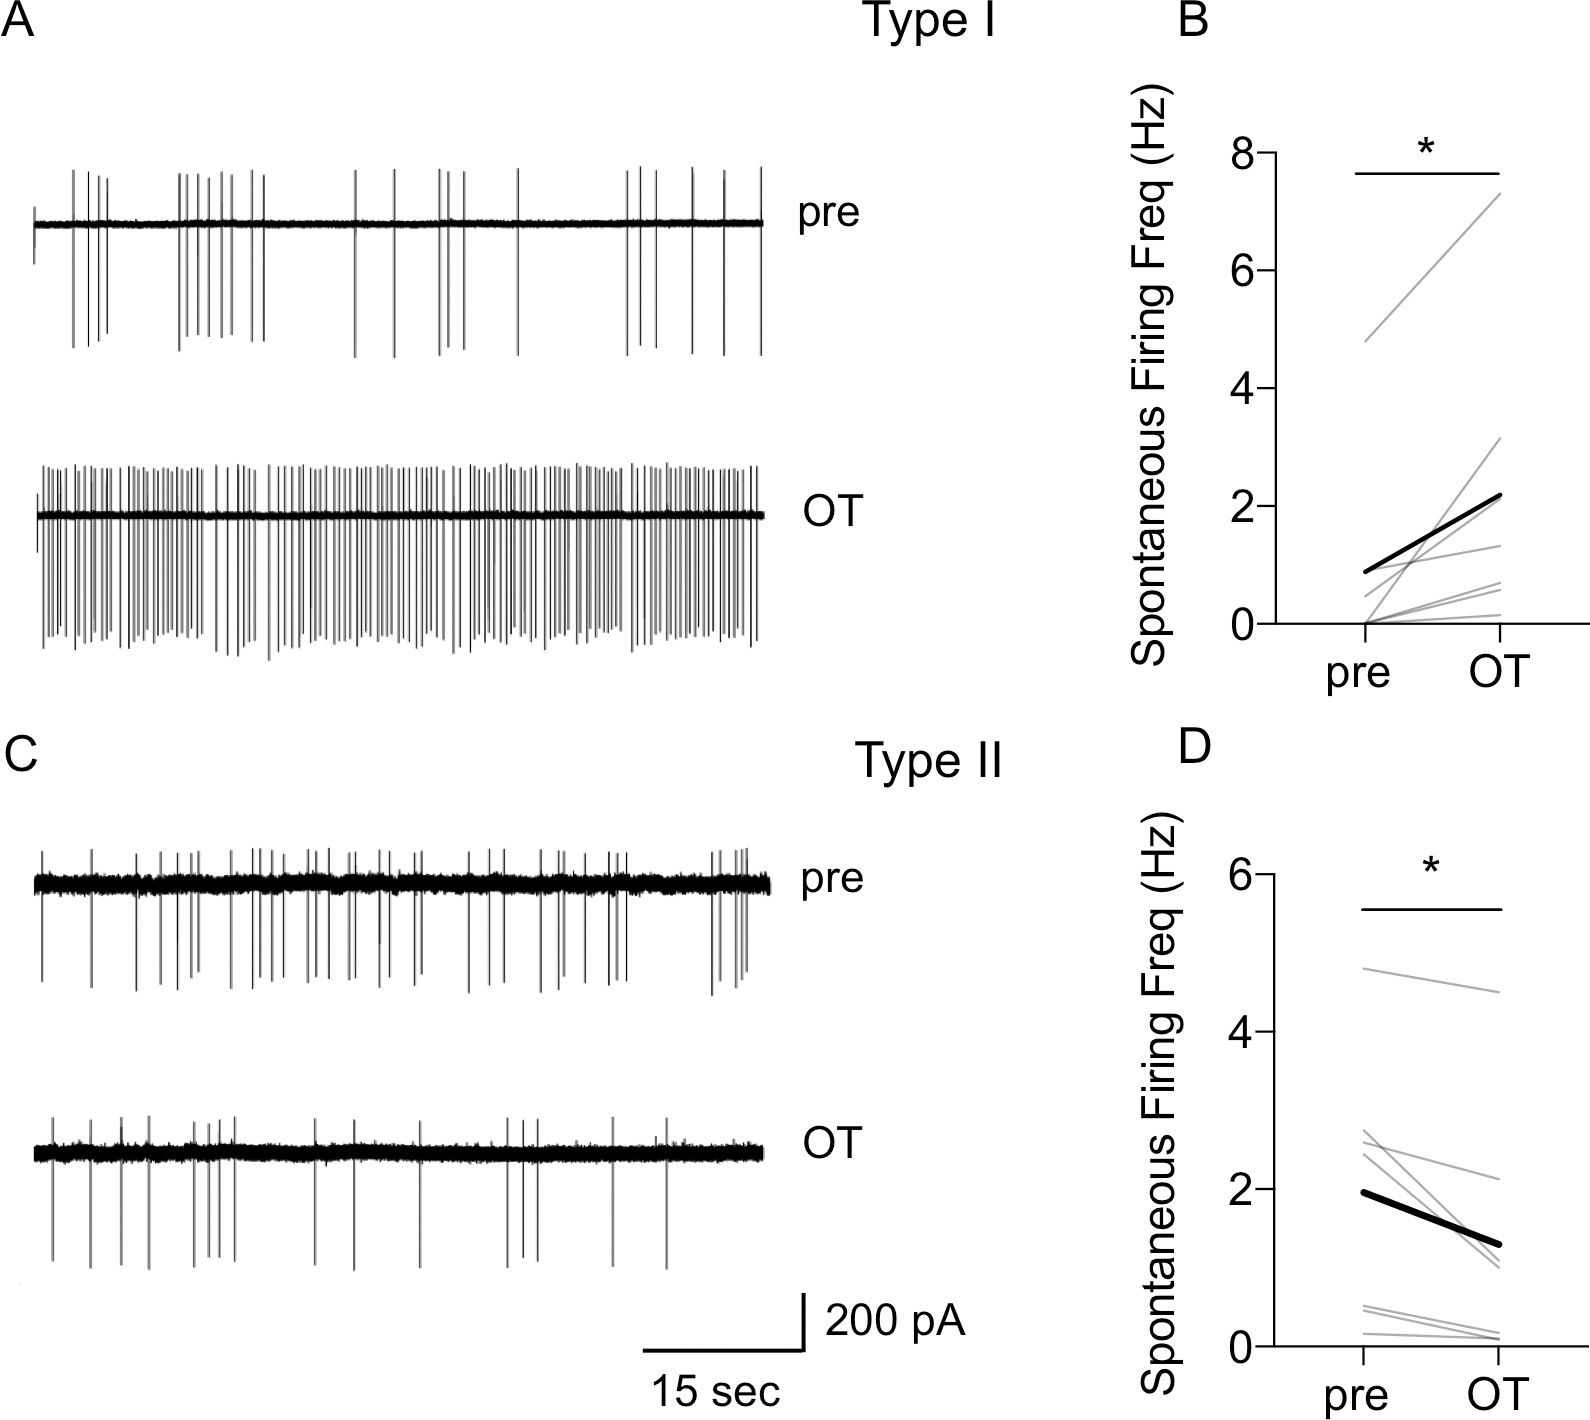
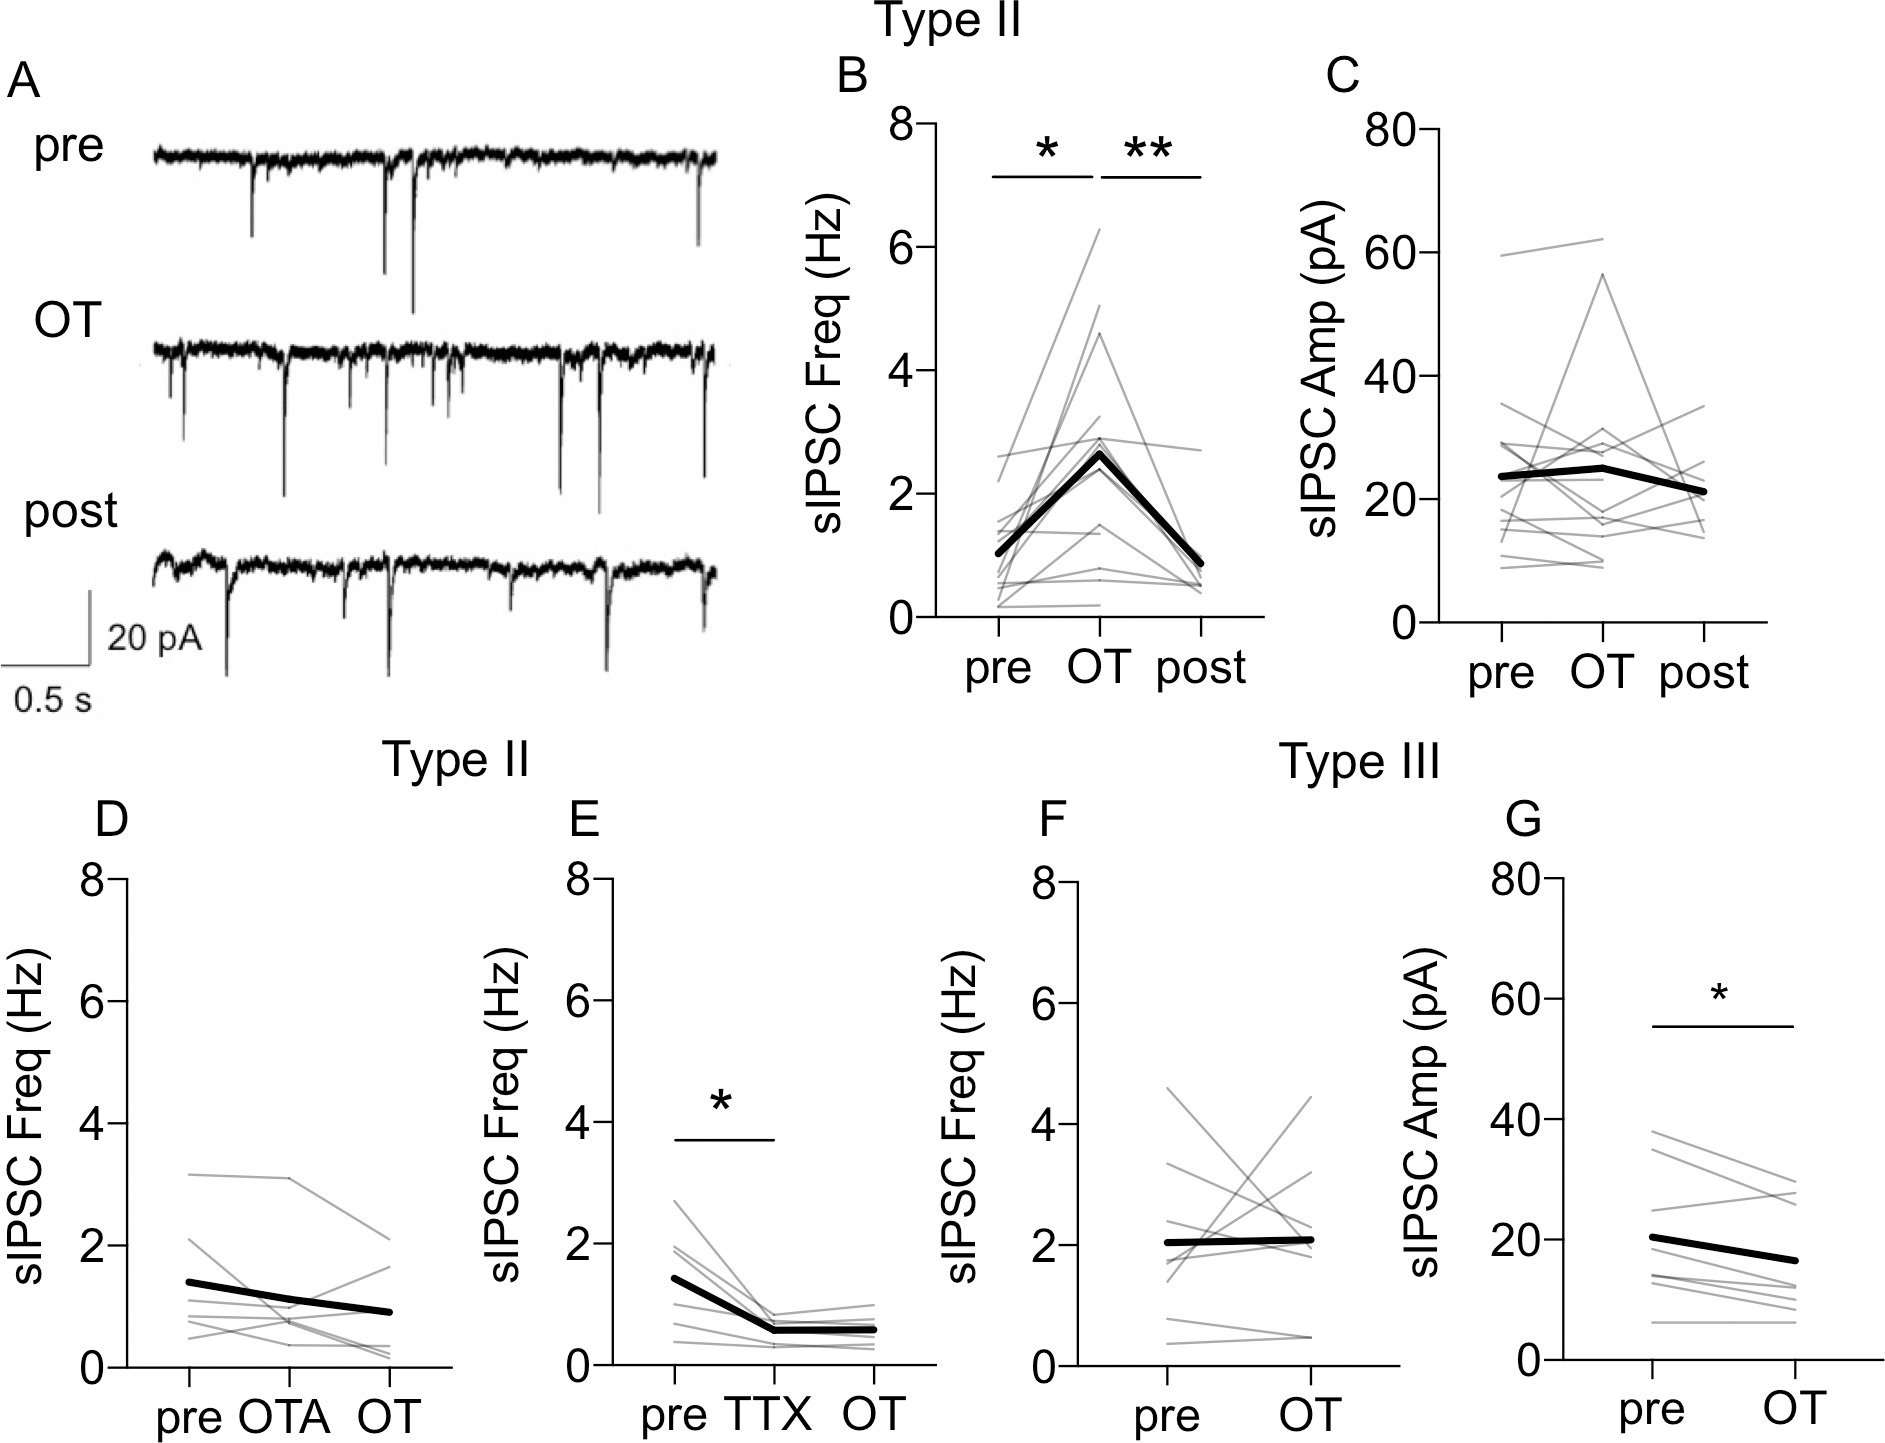
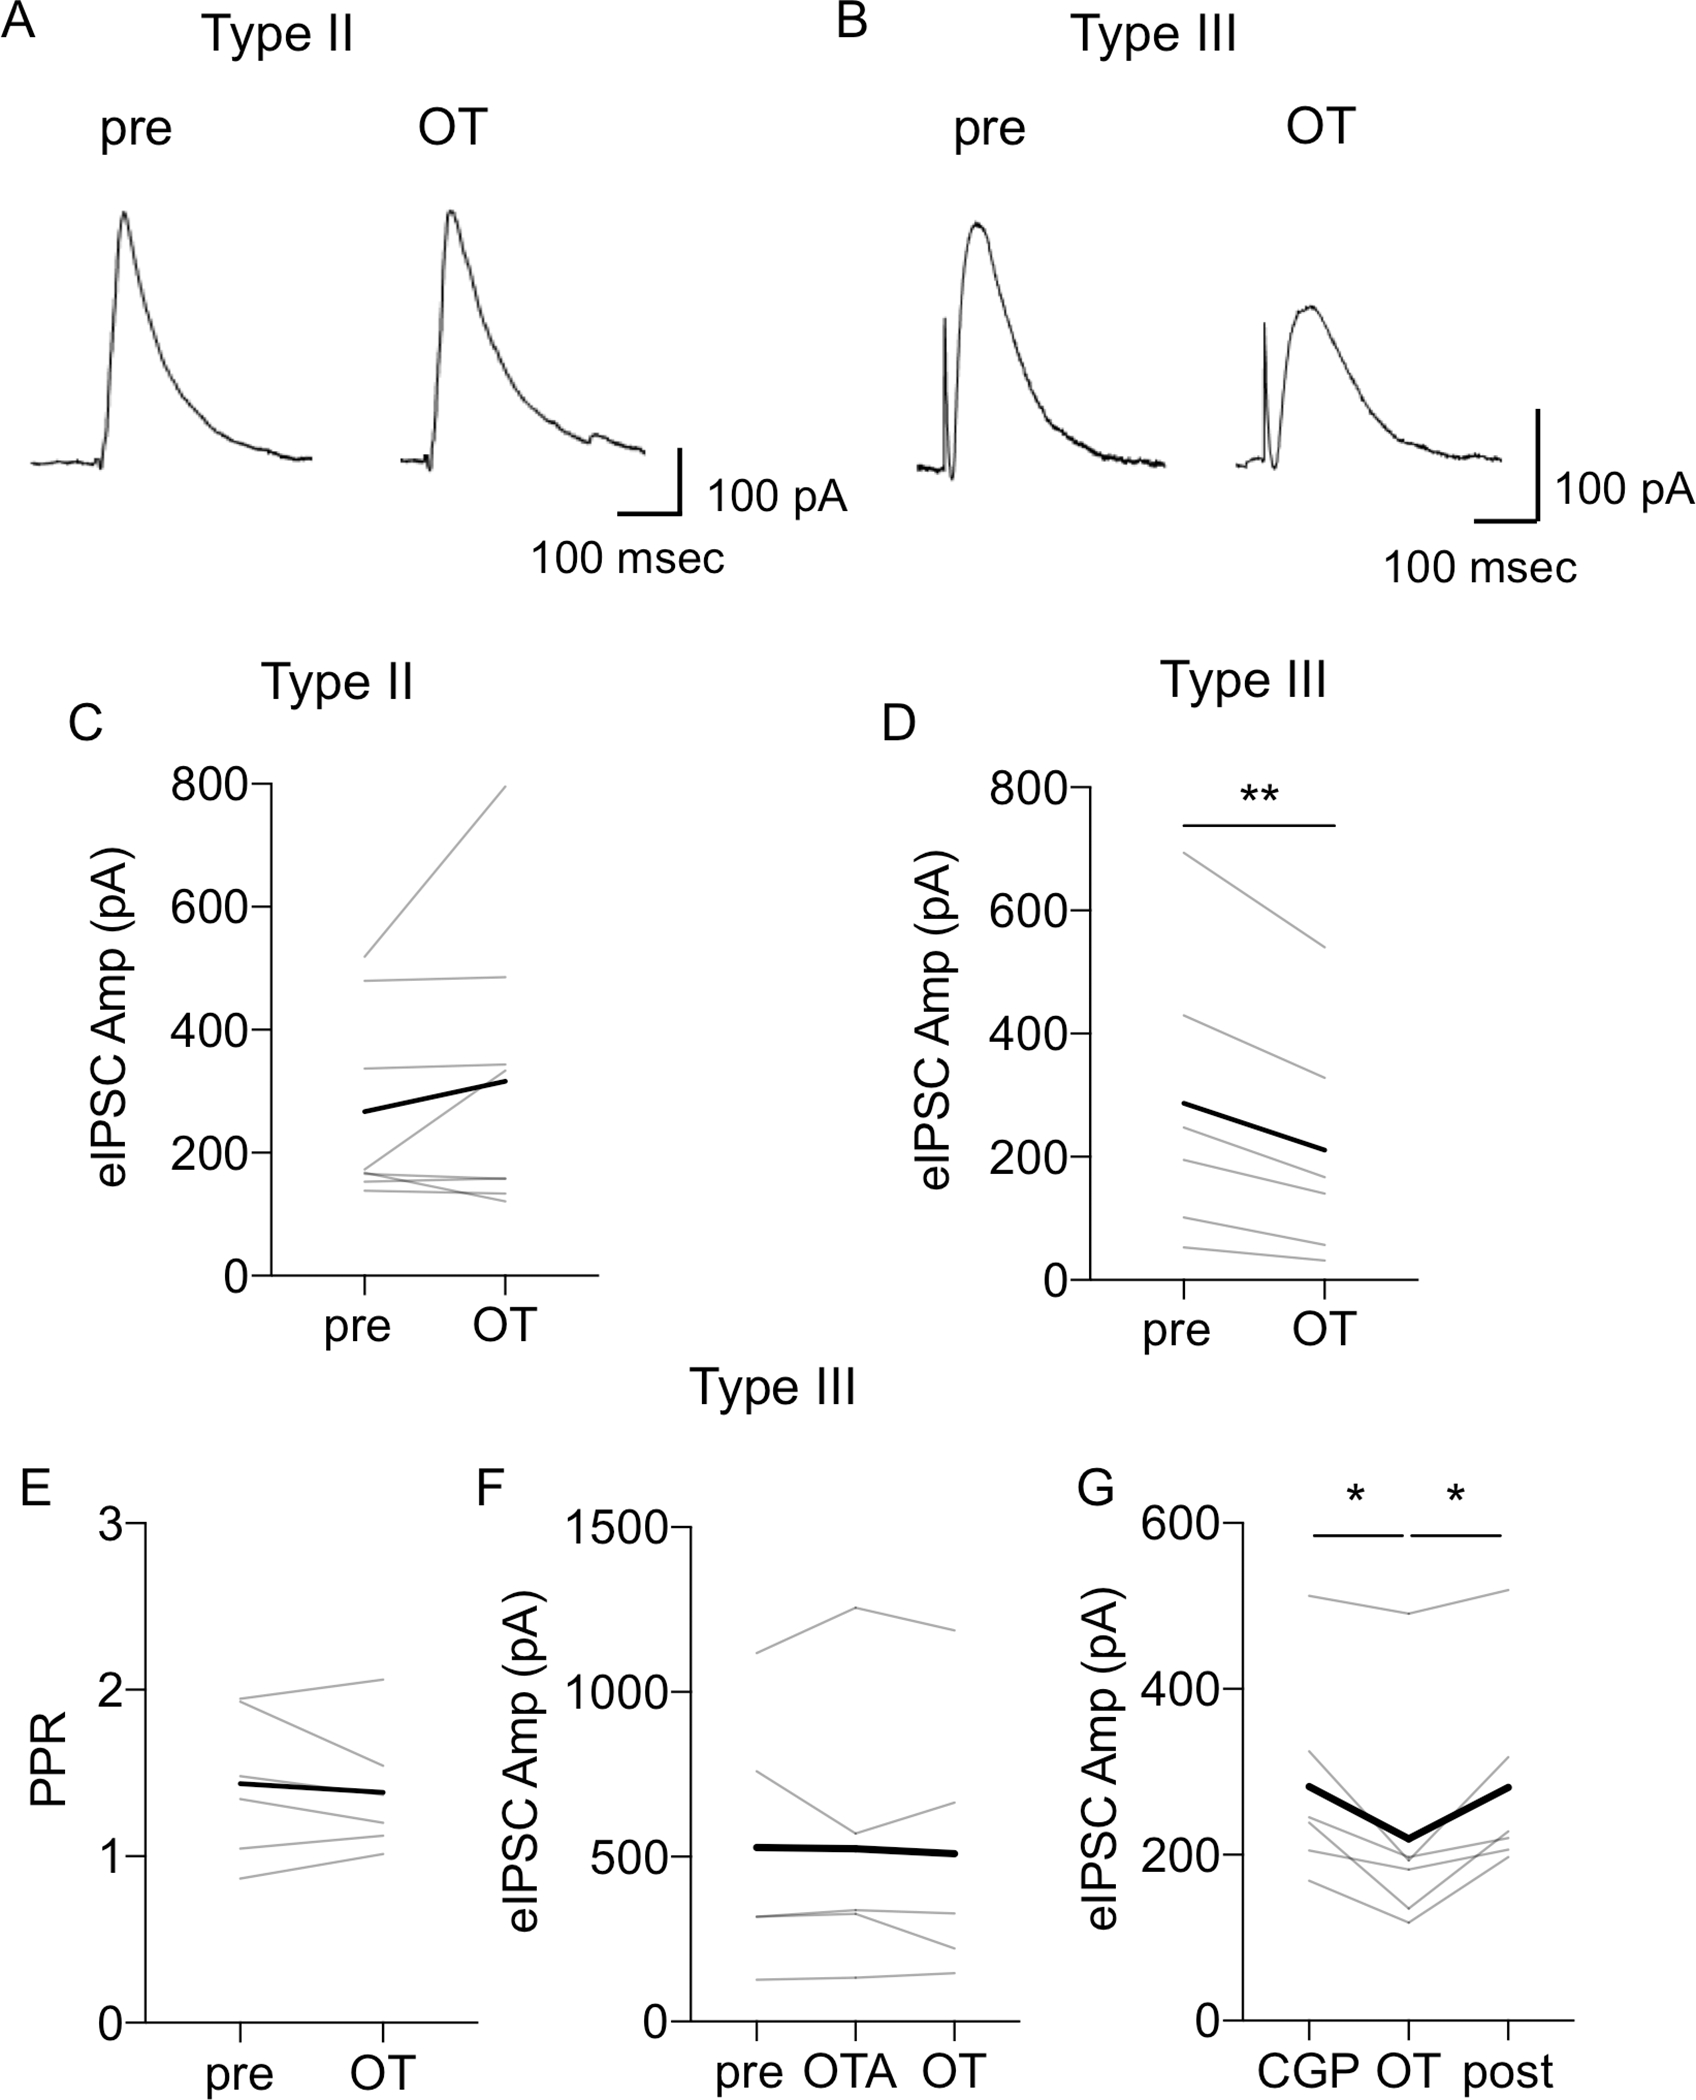
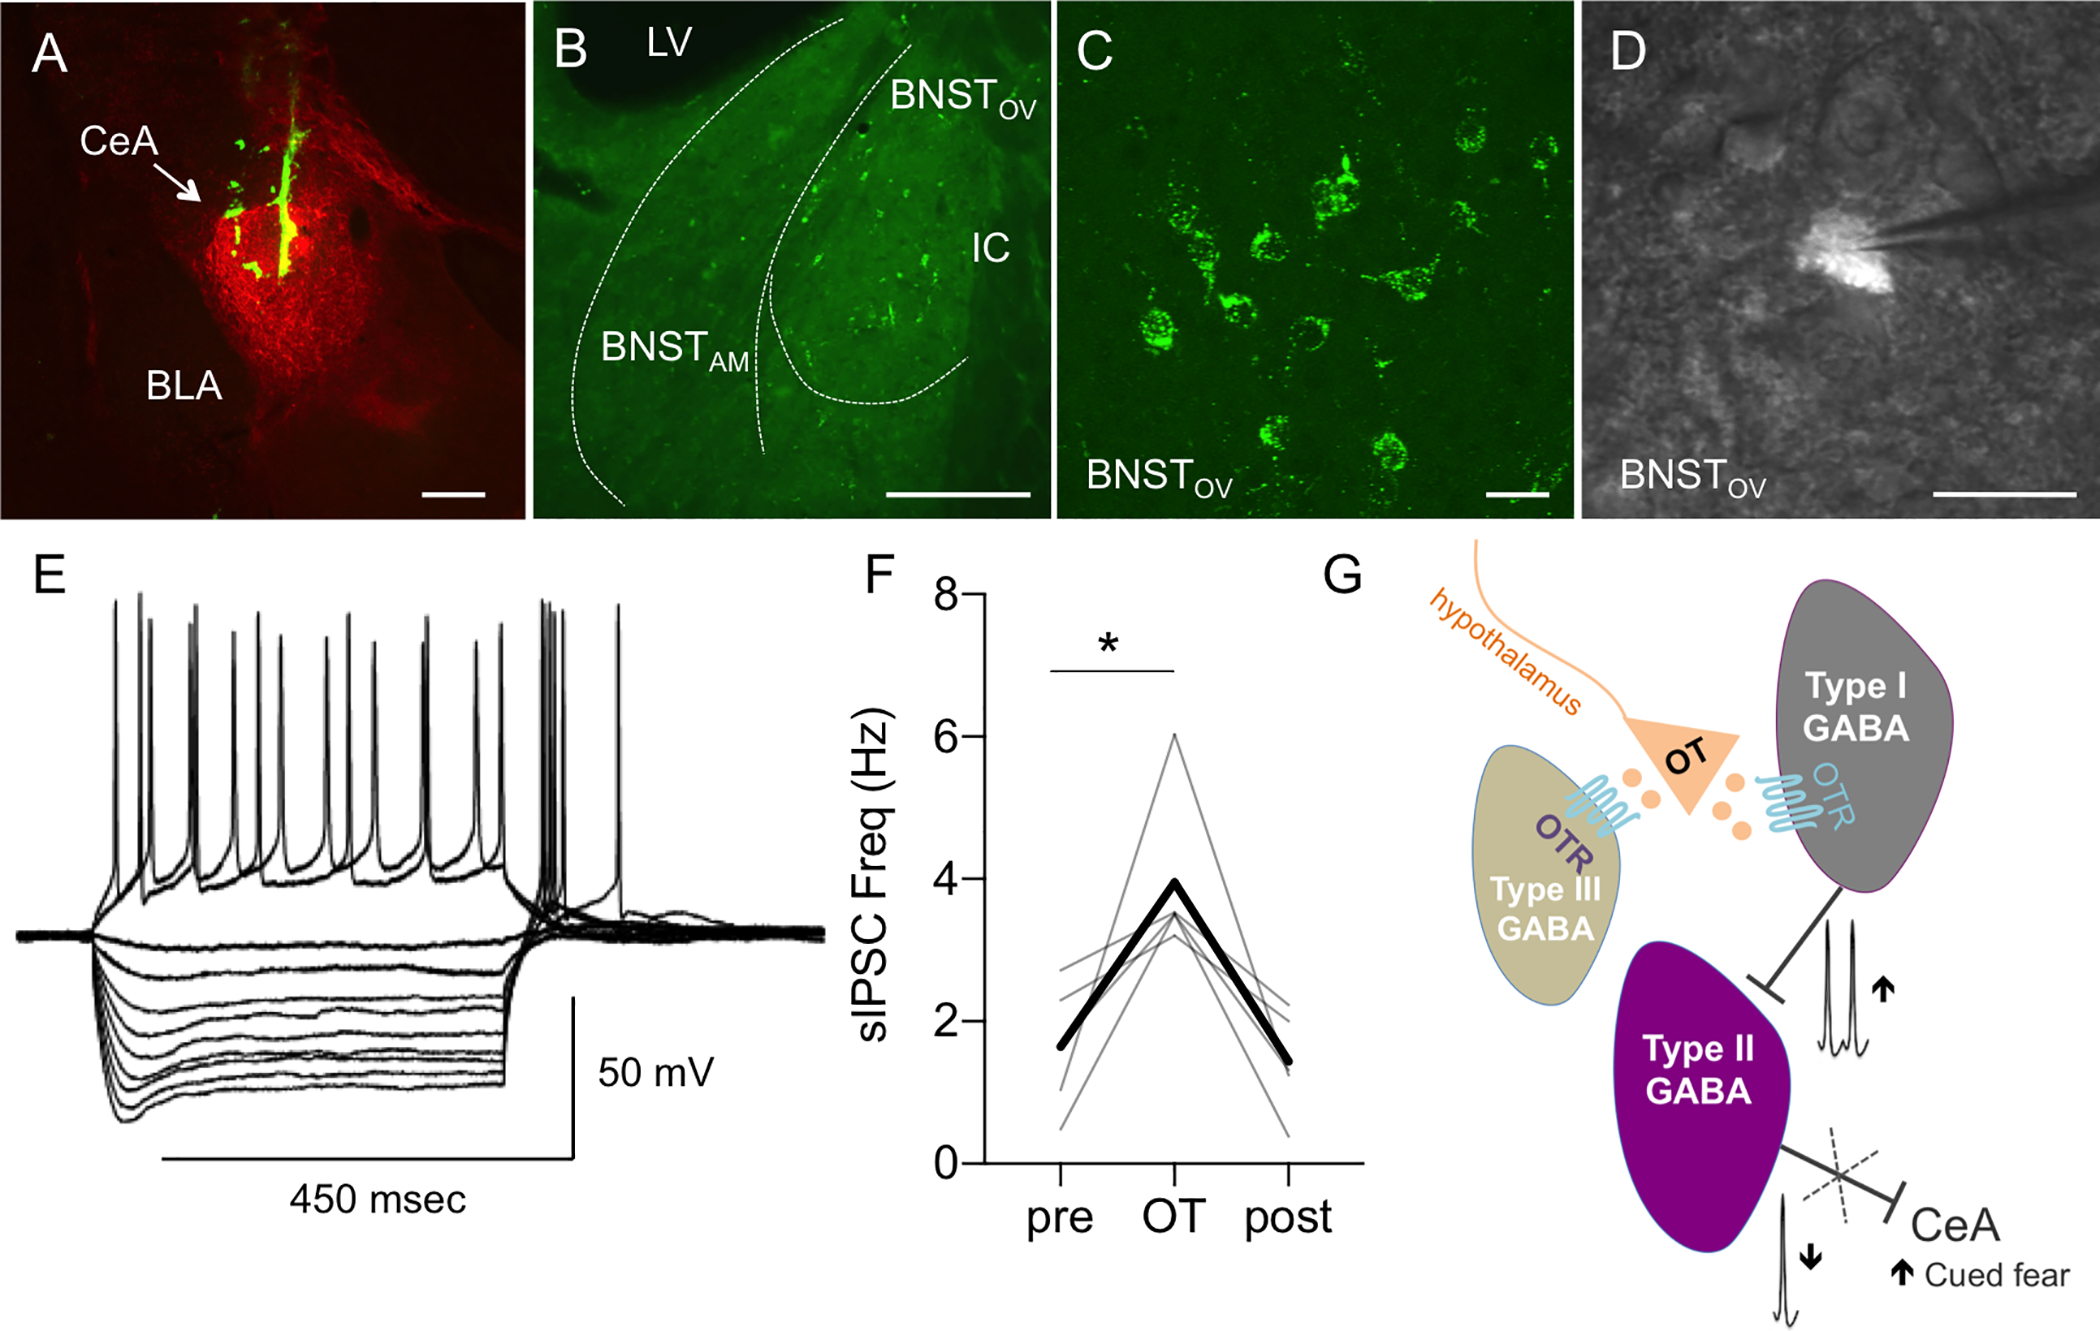
The dorsolateral bed nucleus of the stria terminalis (BNSTDL) has high expression of oxytocin (OT) receptors (OTR), which were shown to facilitate cued fear. However, the role of OTR in the modulation of BNSTDL activity remains elusive. BNSTDL contains GABA-ergic neurons classified based on intrinsic membrane properties into three types. Using in vitro patch-clamp recordings in male rats, we demonstrate that OT selectively excites and increases spontaneous firing rate of Type I BNSTDL neurons. As a consequence, OT increases the frequency, but not amplitude, of spontaneous inhibitory post-synaptic currents (sIPSCs) selectively in Type II neurons, an effect abolished by OTR antagonist or tetrodotoxin, and reduces spontaneous firing rate in these neurons. These results suggest an indirect effect of OT in Type II neurons, which is mediated via OT-induced increase in firing of Type I interneurons. As Type II BNSTDL neurons were shown projecting to the central amygdala (CeA), we also recorded from retrogradely labeled BNST→CeA neurons and we show that OT increases the frequency of sIPSC in these Type II BNST→CeA output neurons. In contrast, in Type III neurons, OT reduces the amplitude, but not frequency, of both sIPSCs and evoked IPSCs via a postsynaptic mechanism without changing their intrinsic excitability. We present a model of fine-tuned modulation of BNSTDL activity by OT, which selectively excites BNSTDL interneurons and inhibits Type II BNST→CeA output neurons. These results suggest that OTR in the BNST might facilitate cued fear by inhibiting the BNST→CeA neurons.

Keywords: BNST; Cell-attached; Central amygdala; Electrophysiology; Oxytocin; Patch-clamp.


Conflict of interest statement

Financial Disclosures

The authors declare no conflict of interest and have no financial interests to disclose. Dr. Joanna Dabrowska reports submission of a provisional patent application entitled: Method and System for Testing for Stress-related Mental Disorders, Susceptibility, Disease Progression, Disease Modulation and Treatment Efficacy (# 62/673447).

Figures

Figure 1.
Figure 1.. Oxytocin affects intrinsic membrane properties of Type I BNSTDL neurons.
A: Representative traces showing that oxytocin (OT, 0.2 μM) shortens the latency to the 1st spike at rheobase current (Rh) and depolarizes resting membrane potential (RMP, from −64 mV to −60 mV). This is associated with an increased input resistance (Rin), measured with a depolarizing current step below the Rh. OT also reduces Rh from 30 pA (pre) to 20 pA (OT) B-F: Line graphs with individual neurons responses (thin gray) and average responses for all neurons recorded (thick black) showing that OT significantly increases the RMP (B, P = 0.0002, F (1.593, 19.12) = 15.76, n = 14, mixed-effect analysis), increases Rin (C, P = 0.0085, n = 9, paired t-test), reduces the Rh (D, P = 0.0457, F (1.341, 16.09) = 4.226, n = 14, mixed-effect analysis), reduces the 1st spike threshold (E, P = 0.0164, F (1.472, 20.61) = 5.749, and reduces the 1st spike latency (F, P = 0.0185, F (1.971, 23.66) = 4.775, n = 14, mixed-effect analysis). Gray lines represent individual neurons’ responses to OT application. Thick black lines show average responses for all Type I neurons recorded, **P < 0.01, *P < 0.05 in comparison to pre or post-OT.
Figure 2.
Figure 2.. Oxytocin increases intrinsic excitability of Type I, but not Type II or Type III, BNSTDL neurons.
A: Representative traces showing voltage deflections in response to hyperpolarizing and depolarizing current injections characteristic of Type I neuron (left) and the increase in firing frequency of Type I neuron in the presence of OT respective to baseline (pre) (right). B: OT causes a leftward shift of input/output (I-O) relationship in Type I neurons. The steady state frequency (SSF) was determined as an average of an inverse of the inter-spike intervals (ISI) from all action potentials starting from the second action potential. In Type I neurons, OT shows a significant increment effect on SSF at 40 pA (P = 0.0024, F (1.667, 15.01) = 10.11), at 50 pA (P = 0.0271, F (1.863, 16.76) = 4.628), and at 60 pA (P = 0.0271, F (1.688, 11.82) = 5.267, mixed-effects analysis). C: Application of OTR antagonist, OTA (0.4 μM), prevents the leftward shift of the I-O relationship induced by OT application (40 pA, P = 0.3365, 50 pA, P = 0.4299, 60 pA, P = 0.6312, n = 5, RM ANOVA). D-E: OT application does not modify the I-O relationship in Type II (D) or Type III BNSTDL neurons (E). Each data point represents the mean ± SEM, **P < 0.01, *P < 0.05 in comparison to pre-OT, ## P < 0.01, # P < 0.05 in comparison to post-OT.
Figure 3.
Figure 3.. Oxytocin reduces fast and medium afterhyperpolarizations and modifies early and late spike frequency adaptation in Type I BNSTDL neurons.
A: Representative traces from Type I neuron showing a reduction of fast AHP (fAHP) and medium AHP (mAHP) after OT application respective to baseline (pre). The amplitudes of the fAHP and mAHP following the first action potential evoked at Rh were calculated as the difference from the action potential threshold to the membrane voltage measured after 2–5 msec and 50–100 msec, respectively. The lAHP was measured at 2000 msec after the end of the depolarizing pulse, following generation of five action potentials. B: Line graphs showing individual neurons’ responses (gray) and reduction of the fAHP during OT application (P = 0.0124, F (1.473, 17.68 = 6.493, mixed-effects analysis, n = 14). C: OTR antagonist, OTA (0.4 μM), prevents the OT-induced reduction of fAHP (P = 0.2220, n = 7, RM RM ANOVA). D: Line graph showing reduction of mAHP after OT application (P <0.0001, F (1.844, 22.13) = 23.25, mixed effect analysis, n = 14). E: OT-induced reduction of mAHP is blocked by OTR antagonist, OTA (P = 0.3968, n = 7, RM ANOVA). Thick black lines show average responses for all Type I neurons recorded. F: OT modifies early and late spike frequency adaptation. The early and late spike frequency adaptation was investigated using a depolarizing pulse of 1 sec and measuring the instantaneous frequency for every action potential interval. The ISI number is the inter-stimulus interval between two consecutive action potentials. OT significantly increased the instantaneous frequency of ISI (P < 0.0001, F (1, 13) = 82.69, mixed effects model), B-E: Gray lines represent individual neurons’ responses to OT application. Thick black lines show average responses for all Type I neurons recorded. F: Each data point represents the MEAN ± SEM, ****P < 0.0001, ***P < 0.001, **P < 0.01.
Figure 4.
Figure 4.. Oxytocin increases spontaneous firing rate of Type I neurons and reduces spontaneous firing rate of Type II BNSTDL neurons in cell-attached recordings.
A: Representative traces of Type I neuron showing an increase in spontaneous firing rate after OT application. B: Line graph showing that OT increased spontaneous firing rate in all spontaneously firing Type I neurons (P = 0.0242, paired t-test, n = 7). C: Representative traces of Type II neuron showing a reduction in spontaneous firing rate after OT application. D: Line graph showing that OT significantly reduced spontaneous firing rate in spontaneously firing Type II neurons in cell-attached mode (P = 0.0304, paired t-test, n = 7), gray lines represent individual neurons’ responses, thick black line represents average response, *P < 0.05.
Figure 5.
Figure 5.. Oxytocin modulates inhibitory synaptic transmission in BNSTDL neurons.
A: Representative recordings from Type II neuron showing an increase in the frequency of spontaneous inhibitory postsynaptic currents (sIPSCs) after OT application respective to baseline (pre). B-C: Line graphs (gray) showing that 12 out of 14 recorded Type II neurons showed an increase in sIPSCs frequency (B, P = 0.0022, F (1.058, 12.17) = 14.41, n = 14, mixed-effect analysis) but not amplitude (C, P = 0.5855, F (1.563, 17.19) = 0.4718, n = 14, mixed-effect analysis) after OT application. D: OT does not affect sIPSCs frequency in a presence of OTR antagonist, OTA (0.4 μM) (P = 0.1788, F (1.469, 8.814) = 2.135, n = 6, RM ANOVA). E: When spike-driven IPSCs were blocked with TTX (P = 0.0151, F (1.030, 6.179) = 10.98, n = 6, RM ANOVA), OT does not affect the sIPSCs frequency. F-G: OT does not affect frequency (F, P = 0.9362) but reduces amplitude of sIPSCs in Type III neurons (G, P = 0.0160, paired t-test. Gray lines represent individual neurons’ responses to OT application. Thick black lines show average responses for all Type I neurons recorded, **P < 0.01, *P < 0.05 in comparison to pre- or post-OT.
Figure 6.
Figure 6.. Oxytocin reduces the amplitude of evoked IPSCs in Type III, but not Type II neurons.
A-B: Representative traces of eIPSCs in response to electrical stimulation of the stria terminalis in Type II (A) and Type III (B) neurons. C: Line graph showing that OT does not change the mean amplitude of eIPSC in Type II neurons (P = 0.2459, paired t-test, n = 5). Thick black line shows averaged responses for all Type II neurons recorded. D-G: Line graphs showing responses of individual Type III neurons to OT application and the reduction of eIPSC amplitude (D, P = 0.0105, paired t-test, n = 6), without any significant change in the PPR (E, P = 0.5672). This effect of OT on eIPSCs amplitude was blocked by OTR antagonist, OTA (F, F (1.421, 7.105) = 0.1722, P = 0.7739, RM ANOVA, n = 6), but not by GABA-B receptor antagonist, CGP 55845 (G, F (1.258, 6.291) = 11.16, P = 0.0122, RM ANOVA, n = 6). Line graphs (gray lines) represent individual neurons’ responses to treatment. Thick black lines show average responses for all neurons recorded.
Figure 7.
Figure 7.. Oxytocin inhibits Type II BNST➔CeA output neurons.
A-B: Microphotographs showing a representative injection site of green retrobeads in the central amygdala (CeA, here visualized with enkephalin immunofluorescence in red, A, scale bar 100 μm) and neurons expressing green fluorescent microbeads in the BNSTDL (B, bar 100 μm). BNST neurons projecting to the CeA (BNST➔CeA neurons) are found in the dorsolateral BNST, primarily the oval nucleus (BNSTOV), and to a lesser extent in the anteromedial BNST (BNSTAM) (BLA – basolateral nucleus of the amygdala, IC – Internal capsule, LV – Lateral ventricle). C: High magnification (60x) microphotographs obtained from a confocal microscope showing green fluorescent beads present in membranes and processes of the BNST➔CeA neurons (scale bar 10 μm). D-E: Electrophysiological characterization of the BNST➔CeA neurons using visually guided patching (D, 40x, scale bar 10 μm). Representative recording of the BNST➔CeA fluorescent neuron showing the electrophysiological properties of a Type II neuron such as the presence of a sag during the hyperpolarized current pulses and the spike rebound at the end of the 450 msec current pulse injection (E). F: OT increases the frequency of sIPSCs (F (1.004, 4.016) = 10.99, P = 0.0293, RM ANOVA, n = 5) in the fluorescent Type II BNST➔CeA neurons. Gray lines represent individual neurons’ responses to treatment. Thick black lines show average responses for all Type II neurons recorded. G: Diagram showing that OT regulates the intrinsic inhibitory network of the BNSTDL. By directly increasing spontaneous firing of Type I regular spiking interneurons, OT reduces firing of Type II BNSTDL neurons, which send projections to the central amygdala (BNST➔CeA neurons). OT also reduces the evoked GABA-ergic inhibition in Type III BNSTDL neurons, via a direct postsynaptic mechanism.

Similar articles

Cited by

References

    1. al-Shamma HA, De Vries GJ, 1996. Neurogenesis of the sexually dimorphic vasopressin cells of the bed nucleus of the stria terminalis and amygdala of rats. J. Neurobiol. 29, 91–98. 10.1002/(SICI)1097-4695(199601)29:1&lt;91::AID-NEU7&gt;3.0.CO;2-2 - DOI - PubMed
    1. Alger BE, Nicoll RA, 1980. Epileptiform burst afterhyperolarization: calcium-dependent potassium potential in hippocampal CA1 pyramidal cells. Science 210, 1122–1124. 10.1126/science.7444438 - DOI - PubMed
    1. Alheid GF, 2003. Extended amygdala and basal forebrain. Ann. N. Y. Acad. Sci. 985, 185–205. - PubMed
    1. Beyeler A, Dabrowska J, 2020. Neuronal diversity of the amygdala and the bed nucleus of the stria terminalis. Handb Behav Neurosci 26, 63–100. 10.1016/b978-0-12-815134-1.00003-9 - DOI - PMC - PubMed
    1. Bosch OJ, Young LJ, 2018. Oxytocin and Social Relationships: From Attachment to Bond Disruption. Curr Top Behav Neurosci 35, 97–117. 10.1007/7854_2017_10 - DOI - PMC - PubMed

Publication types

MeSH terms