. 2021;12(3):1037-1060.
doi: 10.1016/j.jcmgh.2021.05.001. Epub 2021 May 7.

PGI2 Inhibits Intestinal Epithelial Permeability and Apoptosis to Alleviate Colitis

Affiliations

PGI2 Inhibits Intestinal Epithelial Permeability and Apoptosis to Alleviate Colitis

Camille Pochard et al. Cell Mol Gastroenterol Hepatol. 2021.

Abstract

Background & aims: Inflammatory bowel diseases (IBDs) that encompass both ulcerative colitis and Crohn's disease are a major public health problem with an etiology that has not been fully elucidated. There is a need to improve disease outcomes and preventive measures by developing new effective and lasting treatments. Although polyunsaturated fatty acid metabolites play an important role in the pathogenesis of several disorders, their contribution to IBD is yet to be understood.

Methods: Polyunsaturated fatty acids metabolite profiles were established from biopsy samples obtained from Crohn's disease, ulcerative colitis, or control patients. The impact of a prostaglandin I2 (PGI2) analog on intestinal epithelial permeability was tested in vitro using Caco-2 cells and ex vivo using human or mouse explants. In addition, mice were treated with PGI2 to observe dextran sulfate sodium (DSS)-induced colitis. Tight junction protein expression, subcellular location, and apoptosis were measured in the different models by immunohistochemistry and Western blotting.

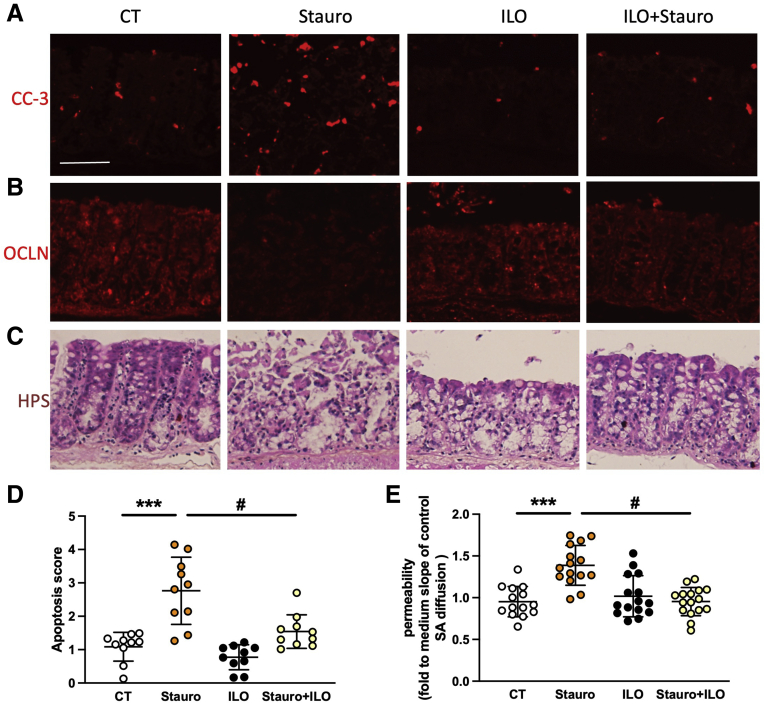
Results: A significant reduction of PGI2 in IBD patient biopsies was identified. PGI2 treatment reduced colonic inflammation, increased occludin expression, decreased caspase-3 cleavage and intestinal permeability, and prevented colitis development in DSS-induced mice. Using colonic explants from mouse and human control subjects, the staurosporine-induced increase in paracellular permeability was prevented by PGI2. PGI2 also induced the membrane location of occludin and reduced the permeability observed in colonic biopsies from IBD patients.

Conclusions: The present study identified a PGI2 defect in the intestinal mucosa of IBD patients and demonstrated its protective role during colitis.

Keywords: Caspase-3; Human Mucosa; IBD; Lipidomic; Occludin; Omega-6 (n-6); PGI(2).


Figures

None
Graphical abstract
Figure 1
Figure 1
n-6/n-3 PUFA-derived metabolite profiling in biopsy supernatants from control and IBD patients. (A) Heatmap of mean concentrations of liquid chromatography-tandem mass spectrometry–identified PUFA metabolites in biopsy supernatants from control patients and HA and UHA of CD and UC patients. Color of each section is proportional to the fold-change of lipids (red, up-regulated; blue, down-regulated). Rows: metabolites; columns: patient groups. c1, c2, c3 indicate the 3 main clusters identified. (B) Correlation analysis of the differential metabolites (red, positive correlation factor; blue, negative correlation factor). (C–E) ANOVA analysis of 6-ketoPGF (C, stable hydrolyzed product of unstable PGI2), 11β-PGF (D), and PGE2 (E) levels in biopsy supernatants from control and HA and UHA of CD and UC patients. ∗P ≤ .05 versus control; #P ≤ .05 UHA versus HA.
Figure 2
Figure 2
n-6/n-3 PUFA-derived metabolite profiling in biopsy supernatants from control and IBD patients. (A) Heatmap of individual concentrations of liquid chromatography-tandem mass spectrometry–identified PUFA metabolites in biopsy supernatants from control patients (Control) and HA and UHA of CD patients. (B) Heatmap of individual concentrations of liquid chromatography-tandem mass spectrometry–identified PUFA metabolites in biopsy supernatants from control patients (Control) and HA and UHA of UC patients. Color of each section is proportional to the fold-change of lipids (red, up-regulated; blue, down-regulated). Rows: metabolites; columns: patient identification numbers followed by group identification (2A = CD HA, 2B = CD UHA, 5A = UC HA, 5B = UC UHA, 6B = Control). Arrows highlight the metabolites of cluster c1 identified by analysis of the pool of CD and UC data (Figure 1).
Figure 3
Figure 3
n-6/n-3 PUFA-derived metabolite profiling in biopsy supernatants from IBD patients according to treatments. (A) Heatmap of individual concentrations of liquid chromatography-tandem mass spectrometry–identified PUFA metabolites in biopsy supernatants from HA of CD and UC patients according to their treatments: no treatment (none), anti-tumor necrosis factor (TNF)-α treatment (T), other treatments (o, anti-inflammatory or immunosuppressive drugs), and anti-TNF-α combined with other treatments (To). Color of each section is proportional to the fold-change of lipids (red, up-regulated; blue, down-regulated). Rows: metabolites; columns: patient identification numbers followed by group identification (2A = CD HA, 5A = UC HA). (B) ANOVA analysis of 6-ketoPGF (C, stable hydrolyzed product of unstable PGI2) concentrations in biopsy supernatants from control untreated patients (CONT none) and CD and UC patients without treatment (none), treated with anti-TNF-α, anti-inflammatory, or immunosuppressive drugs (others), and anti-TNF-α combined with other treatments (anti-TNF-α and others).
Figure 4
Figure 4
PGI2 analog iloprost increases resistance, reduces permeability, increases occludin, and decreases ZO-1 and claudin-2 expression in vitro. (A and B) PGI2 impact on TEER (A) and permeability (B) was measured in vitro on Caco-2 monolayer after 1 day with or without (CT) 10 μmol/L iloprost in the basolateral compartment. Data represent means ± SEM of 13–16 Caco-2 filters per condition. ∗∗∗P < .001 Mann-Whitney test. (C–I) Western blot analyses of tight junction protein expression from Caco-2 lysates. Representative Western blot (C), ZO-1 (D), claudin-2 (E), occludin (F), junctional adhesion molecule-A (G), cingulin (H), and phosphorylated MLC20 (I) expression quantification related to β-actin expression from Western blot analysis. In (D–I), data represent means ± SEM of 7–12 Caco-2 filters per condition. ∗P ≤ .05 nonparametric Mann-Whitney test. (J) Sulfonic acid permeability was measured on Caco-2 monolayer after 1 day of 10 μmol/L iloprost (ILO) treatment in basolateral (Baso) or apical (Api) compartments or without it (Cont). (K) TEER was measured on Caco-2 monolayer after 1 day of 10 μmol/L 6-ketoPGF (6 keto) treatment in the basolateral compartment or without it (Cont). (L) Paracellular permeability was measured by sulfonic acid (SA) flux through the same Caco-2 monolayer. Data represent means ± SEM of 3–6 independent experiments. ∗P > .05 by nonparametric Mann-Whitney test.
Figure 5
Figure 5
Synthetic PGI2 epoprostenol prevents DSS-induced colon atrophy, animal weight loss, and mucosal destruction and increases permeability in vivo. (A–E) PGI2 impact on colitis induced by DSS in vivo was measured at end of the protocol in control (CT) or DSS-induced mice (DSS) that received PBS (NT) or epoprostenol (EPO) during the 4 days of the protocol. Experimental design (A), animal weight (B), DAI (C), transcellular permeability (D), and paracellular permeability (E) (evaluated by measurement of HRP and sulfonic acid in animal plasma 4 hours after mouse gavage), cecal remodeling (F; scale bar: 1 cm), and colon length (G). (H–L) Tissue remodeling was analyzed in the 4 groups of mice. Hematein Phloxin Safran coloration of distal colon sections of control (CT), DSS-induced (DSS), epoprostenol-treated (EPO), or epoprostenol-treated DSS-induced (EPO+DSS) mice (I; scale bar: 100 μm). Histologic scores were evaluated from Hematein Phloxin Safran staining by quantifying the destruction of mucosal architecture (H), muscle thickening (J), loss of goblet cells (K), and cellular infiltration (L). Data represent mean ± SEM of 4–12 mice per group. Two-way ANOVA followed by Bonferroni post hoc tests. ∗P ≤ .05, ∗∗P ≤ .01 and ∗∗∗P ≤ .001 (DSS factor effects) or #P ≤ .001 and ###P ≤ .001 (EPO factor effects).
Figure 6
Figure 6
Synthetic PGI2 epoprostenol partially prevents inflammation observed during colitis development. (A–F) mRNA expression of tumor necrosis factor (Tnf)-α (A), IL-1β (C), IL-6 (C), IFN-γ (D), IL-17A (E), and IL-22 (F) was measured at end of 4-day treatment in colon fragments of control (CT) or DSS-induced mice (DSS) that received PBS (NT) or epoprostenol (EPO) every day. Data represent means ± SEM of 12 mice per group. Two-way ANOVA followed by Bonferroni post hoc tests. ∗P ≤ .05, ∗∗P ≤ .01, and ∗∗∗P ≤ .001 (DSS factor effects).
Figure 7
Figure 7
Synthetic PGI2 epoprostenol inhibits decreased occludin expression and apoptosis induced by DSS in vivo. (A and C) PGI2 impact on occludin expression. Representative occludin immunostaining of distal colon sections of control (CT), DSS-induced (DSS), epoprostenol-treated (EPO), or epoprostenol-treated and DSS-induced (EPO+DSS) mice at end of 4-day treatment (A; scale bar: 100 μm). Occludin mucosa staining was quantified in the 4 groups of mice (C). (B and D) PGI2 impact on apoptosis. Representative cleaved caspase-3 immunostaining of distal colon sections of control (CT), DSS-induced (DSS), epoprostenol-treated (EPO), or epoprostenol-treated and DSS-induced (EPO+DSS) mice at end of 4-day treatment (B). Quantification of cleaved caspase-3 staining relative to mucosal area in the 4 groups of mice (D). Data represent means ± SEM of 4 mice per group. Two-way ANOVA followed by Bonferroni post hoc tests. ∗P < .05 (DSS factor effects) or #P < .05 (EPO factor effects). (E–G) Western blot analyses of PCNA, phospho-Akt (P-Akt), and Akt were performed on the distal colon of control (CT), DSS-induced (DSS) epoprostenol-treated (EPO), or epoprostenol-treated and DSS-induced (EPO+DSS) mice at end of 4-day treatment. Representative Western blot analysis of PCNA and P-Akt/Akt expression (E). Quantification of PCNA expression (F). Quantification of P-Akt/Akt expression derived from acquisition of the same gels (G). Data represent means ± SEM of 12 mice per group. Two-way ANOVA followed by Bonferroni post hoc tests. ∗P ≤ .05 (DSS factor effects) or #P ≤ .05 (EPO factor effects).
Figure 8
Figure 8
PGI2 analog iloprost prevents mouse IEB breakdown ex vivo. (A–D) Potential of PGI2 to block IEB breakdown induced by apoptosis was assessed on mouse colon explants treated without (CT) or with staurosporine (Stauro, 1 μmol/L) for 20 hours, without or with 4-hour pretreatment with 10 μmol/L iloprost pretreatment (ILO). Representative cleaved caspase-3 (CC3, A), occludin (OCLN, B), or Hematein Phloxin Safran staining (HPS, C) of explants from proximal colon of mice after the mentioned treatments (scale bar: 50 μm). Apoptosis score evaluated from cleaved caspase-3 staining (D). Paracellular permeability measured in Ussing chambers by sulfonic acid flux through mouse tissues after the mentioned treatments (E). Data represent means ± SEM of 16 explants per group. Two-way ANOVA followed by Bonferroni post hoc tests. ∗∗∗P ≤ .001 (for DSS factor effects) or #P ≤ .05 (for ILO factor effects).
Figure 9
Figure 9
Dose response of PGI2 analog iloprost on mice colon explant permeability and occludin membrane location. (A–C) Potential of PGI2 to regulate occludin and reduce IEB permeability induced by apoptosis was assessed on mouse colon explants treated for 16 hours with staurosporine (ST, 1 μmol/L), without or with 4-hour pretreatment with 1, 10, or 100 μmol/L iloprost (ILO). Paracellular permeability measured in Ussing chambers by sulfonic acid flux through mouse tissues after the mentioned treatments (A). Occludin membrane (mb), cytosolic (cyto), and total (tot) expression were assessed by Western blot after cell fractionation (B) and quantified (C). Data represent means ± SEM of 3–9 explants per group. Nonparametric Mann-Whitney test, ∗∗P < .005 or ∗P < .05.
Figure 10
Figure 10
PGI2 analog iloprost prevents human IEB breakdown ex vivo, and mucosa from IBD patients present increased apoptosis and reduced occludin expression. (A and B) Potential of PGI2 to block IEB breakdown induced by apoptosis was assessed on human colon explants treated without (CT) with staurosporine (Stauro, 1μmol/L) for 20 hours (A) and the indicated time (B), without or with 4-hour 10 μmol/L iloprost pretreatment (ILO). Paracellular permeability measured in Ussing chambers by sulfonic acid flux through human mucosal colonic samples from control patients after the mentioned treatment (A). Data represent means ± SEM of 6 explants per condition and per patient with 4 different patients. Quantification of cleaved caspase-3 staining relative to mucosal area was quantified in 5 explants per group (B). Two-way ANOVA followed by Bonferroni post hoc tests. ∗∗∗P < .001 (for Stauro factor effects), ∗∗P < .05 (for Stauro factor effects), or #P < .05 (for ILO factor effects). (C–F) Epithelial apoptosis was evaluated in mucosa from control (CT), CD, or UC patients by Western blot analysis, immunostaining, or qPCR. Representative immunostaining of cleaved caspase-3 or cytodeath M30 from CT, CD, and UC patients (C; scale bar: 200 μm). Quantification of cleaved caspase-3 normalized to β-actin expression observed by Western blot (D). Measurement of BAX (E), BCL2 (F), and PTGIR (G) mRNA. Data represent means ± SEM of mucosa lysates from CT (n = 20), CD (n = 20), and UC (n = 16) patients. Nonparametric Mann-Whitney test, ∗P < .05. (G and H) Quantification of ZO-1 (H) and occludin (I) expression normalized to β-actin expression observed by Western blot of biopsies from control, quiescent CD, and active CD HA and UHA. Data represent means ± SEM of mucosa lysates from CT (n = 12), active CD (n = 16), and quiescent CD (n = 9) patients. Nonparametric Mann-Whitney test, ∗P < .05.
Figure 11
Figure 11
PGI2 analog iloprost reduces permeability and induces occludin membrane location of biopsies from IBD patients. (A) Paracellular permeability of biopsies from IBD patients measured by sulfonic acid (SA) flux in Ussing chambers after 1-hour pretreatment with 10 μmol/L iloprost (PGI2) or without (CT). IBD patient (n = 9) data represent the mean SA flux of 2 biopsies per condition per patient. ∗P < .05 paired t test. (B) Quantification of ZO-1 and occludin expression normalized to villin expression observed by Western blot of biopsies from IBD patients with or without ILO treatment. (C) Occludin membrane (mb) and cytosolic (cyto) expressions were assessed by Western blot after cell fractionation (C) and quantified (D). Data represent means ± SEM of 4 pools of 2 biopsies per group. Nonparametric Mann-Whitney test, ∗P < .05. (E) Representative occludin (OCLN) or DAPI staining of human biopsies with or without ILO treatment (scale bar: 50 μm).

References

    1. Molodecky N.A., Soon I.S., Rabi D.M., Ghali W.A., Ferris M., Chernoff G., Benchimol E.I., Panaccione R., Ghosh S., Barkema H.W., Kaplan G.G. Increasing incidence and prevalence of the inflammatory bowel diseases with time, based on systematic review. Gastroenterology. 2012;142:46–54 e42. quiz e30. - PubMed
    1. Ananthakrishnan A.N. Epidemiology and risk factors for IBD. Nature Reviews Gastroenterology Hepatology. 2015;12:205–217. - PubMed
    1. Gu Y.B., Zhong J. Endoscopic management of stricturing Crohn’s disease. J Dig Dis. 2020;21:351–354. - PubMed
    1. Spinelli A., Armuzzi A., Ciccocioppo R., Danese S., Gionchetti P., Luglio G., Orlando A., Rispo A., Rizzello F., Sofo L., Solina G., Poggioli G. Management of patients with complex perianal fistulas in Crohn’s disease: optimal patient flow in the Italian clinical reality. Dig Liver Dis. 2020;52:506–515. - PubMed
    1. Xavier R.J., Podolsky D.K. Unravelling the pathogenesis of inflammatory bowel disease. Nature. 2007;448:427–434. - PubMed

Publication types

MeSH terms