

How much leeway is there to relax COVID-19 control measures?
- PMID: 33971429
- PMCID: PMC7970422
- DOI: 10.1016/j.epidem.2021.100453
How much leeway is there to relax COVID-19 control measures?
Abstract
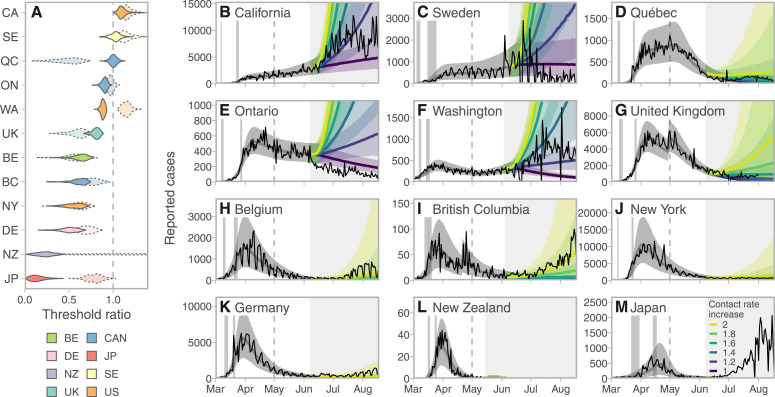
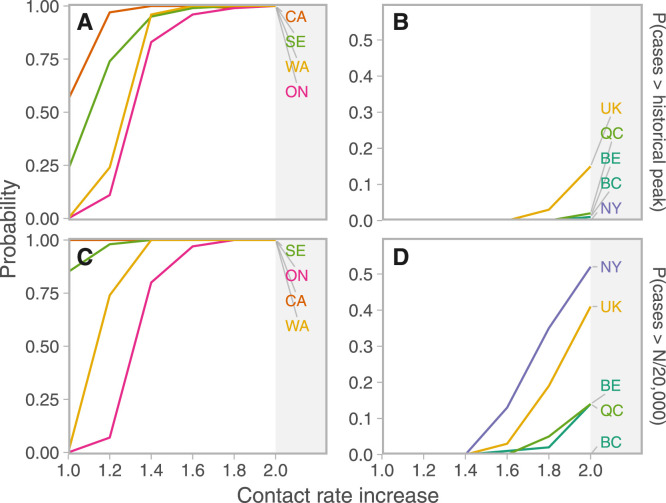
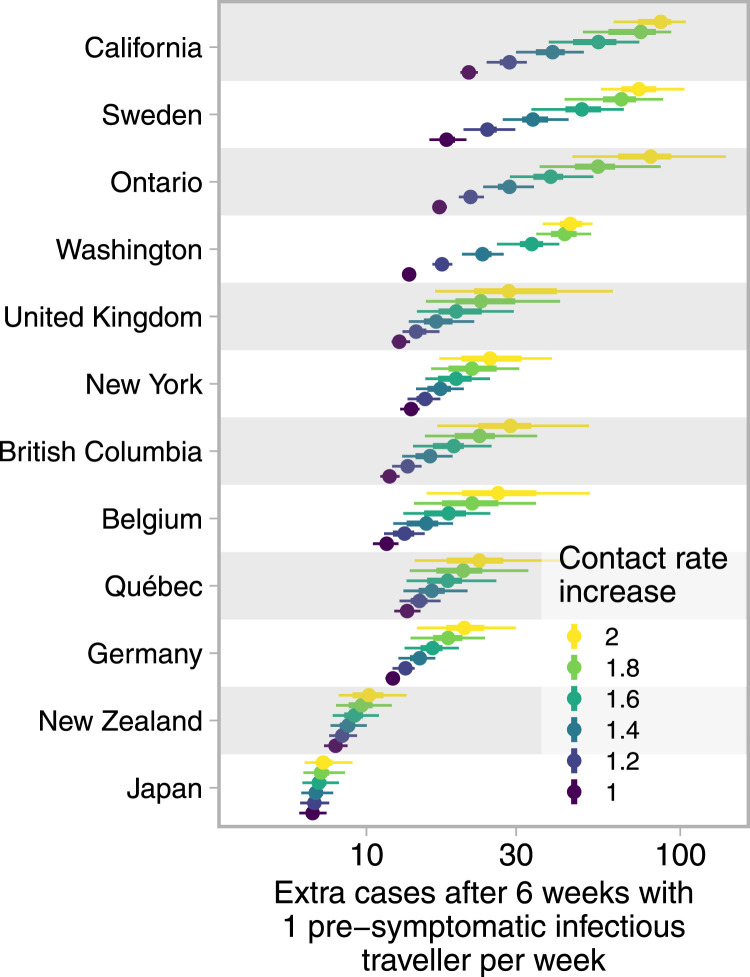
Following successful non-pharmaceutical interventions (NPI) aiming to control COVID-19, many jurisdictions reopened their economies and borders. As little immunity had developed in most populations, re-establishing higher contact carried substantial risks, and therefore many locations began to see resurgence in COVID-19 cases. We present a Bayesian method to estimate the leeway to reopen, or alternatively the strength of change required to re-establish COVID-19 control, in a range of jurisdictions experiencing different COVID-19 epidemics. We estimated the timing and strength of initial control measures such as widespread distancing and compared the leeway jurisdictions had to reopen immediately after NPI measures to later estimates of leeway. Finally, we quantified risks associated with reopening and the likely burden of new cases due to introductions from other jurisdictions. We found widely varying leeway to reopen. After initial NPI measures took effect, some jurisdictions had substantial leeway (e.g., Japan, New Zealand, Germany) with > 0.99 probability that contact rates were below 80% of the threshold for epidemic growth. Others had little leeway (e.g., the United Kingdom, Washington State) and some had none (e.g., Sweden, California). For most such regions, increases in contact rate of 1.5-2 fold would have had high (> 0.7) probability of exceeding past peak sizes. Most jurisdictions experienced June-August trajectories consistent with our projections of contact rate increases of 1-2-fold. Under such relaxation scenarios for some regions, we projected up to ∼100 additional cases if just one case were imported per week over six weeks, even between jurisdictions with comparable COVID-19 risk. We provide an R package covidseir to enable jurisdictions to estimate leeway and forecast cases under different future contact patterns. Estimates of leeway can establish a quantitative basis for decisions about reopening. We recommend a cautious approach to reopening economies and borders, coupled with strong monitoring for changes in transmission.
Keywords: Bayesian; COVID-19; Non-pharmaceutical interventions; SARS-CoV-2; SEIR.
Crown Copyright © 2021. Published by Elsevier B.V. All rights reserved.
Conflict of interest statement
The authors declare that they have no known competing financial interests or personal relationships that could have appeared to influence the work reported in this paper.
Figures
References
-
- Al Hasan Syed Mahfuz, Saulam Jennifer, Kanda Kanae, Ngatu Nlandu Roger, Hirao Tomohiro. Trends in COVID-19 outbreak in Tokyo and Osaka from January 25 to May 6, 2020: a joinpoint regression analysis of the outbreak data. Jpn. J. Infect. Dis. 2021;74(1):73–75. doi: 10.7883/yoken.JJID.2020.332. - DOI - PubMed
-
- Anderson S.C., Edwards A.M., Yerlanov M., Mulberry N., Stockdale J.E., Iyaniwura S.A., Falcao R.C., Otterstatter M.C., Irvine M.A., Janjua N.Z., Coombs D., Colijn C. 2020. Covidseir: Bayesian SEIR model to estimate physical-distancing effects. https://github.com/seananderson/covidseir. - PMC - PubMed
-
- Anderson Sean C, Edwards Andrew M, Yerlanov Madi, Mulberry Nicola, Stockdale Jessica, Iyaniwura Sarafa A, Falcao Rebeca C, Otterstatter Michael C, Irvine Michael A, Janjua Naveed Z, Coombs Daniel, Colijn Caroline. Quantifying the impact of COVID-19 control measures using a Bayesian model of physical distancing. PLOS Comput. Biol. 2020;16(12):e1008274. doi: 10.1371/journal.pcbi.1008274. - DOI - PMC - PubMed
-
- B.C. Centre for Disease Control . 2020. COVID-19 case counts and press statements. http://www.bccdc.ca/health-info/diseases-conditions/covid-19/case-counts..., Accessed: 2020-4.
MeSH terms
LinkOut - more resources
Full Text Sources
Other Literature Sources
Medical
Research Materials
Miscellaneous
