. 2021 Jun 15:40:116129.
doi: 10.1016/j.bmc.2021.116129. Epub 2021 Apr 19.

Exploiting the HSP60/10 chaperonin system as a chemotherapeutic target for colorectal cancer

Affiliations

Exploiting the HSP60/10 chaperonin system as a chemotherapeutic target for colorectal cancer

Anne-Marie Ray et al. Bioorg Med Chem. .

Abstract

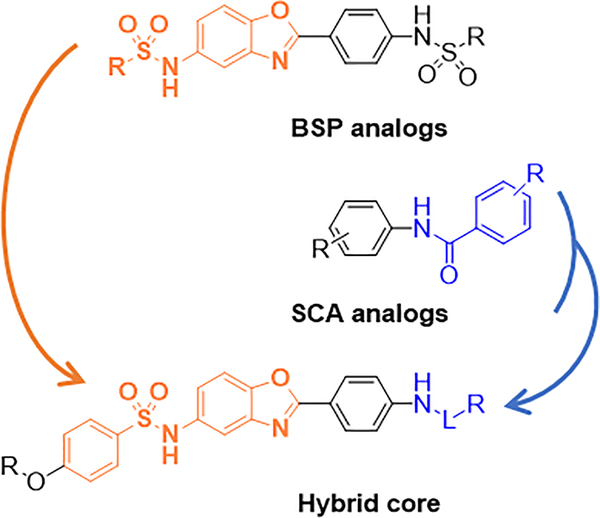
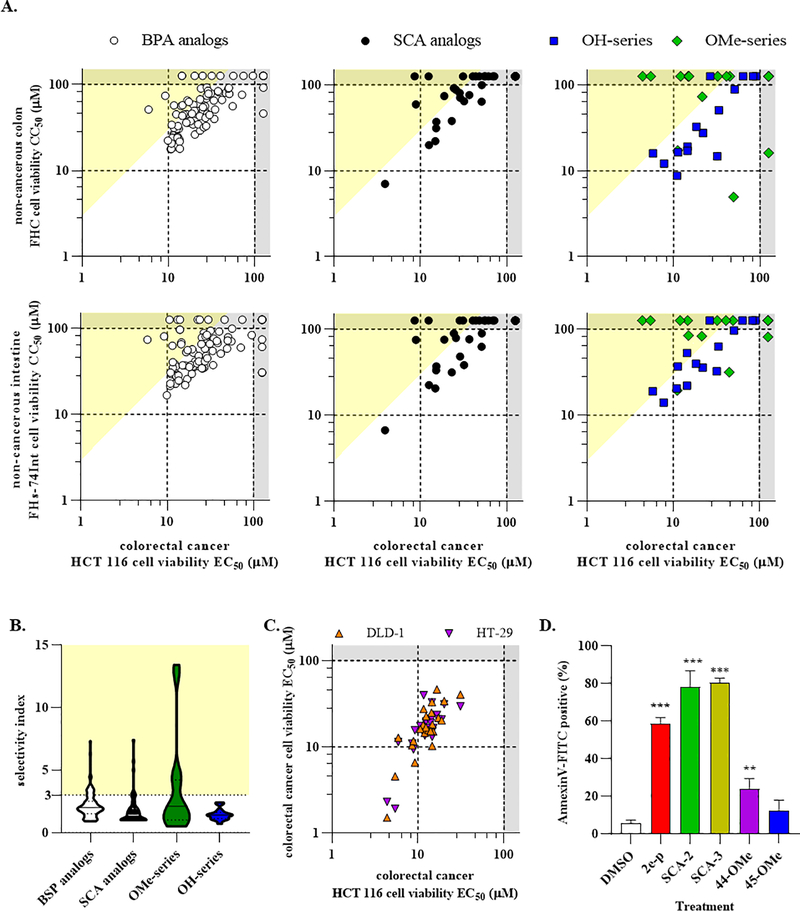
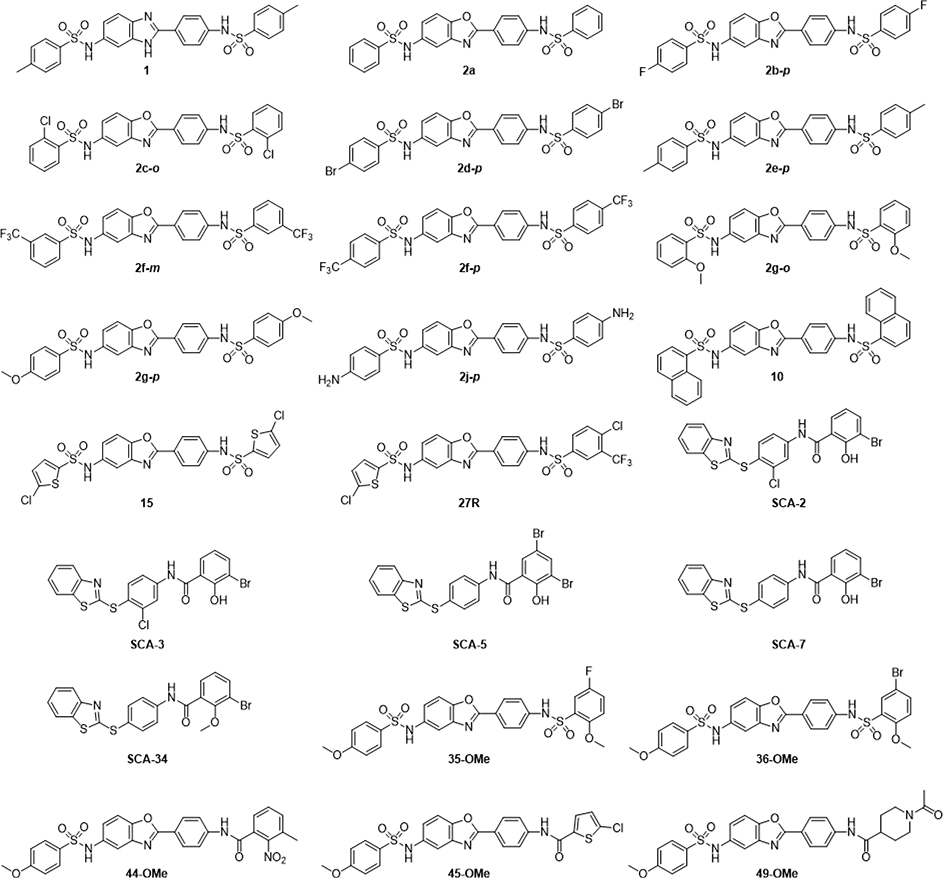
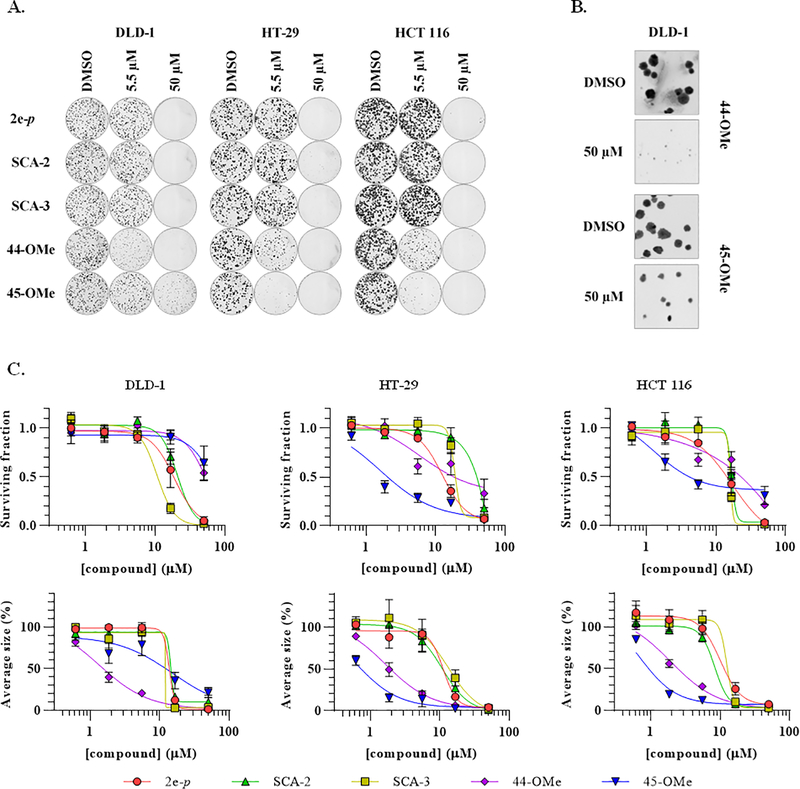
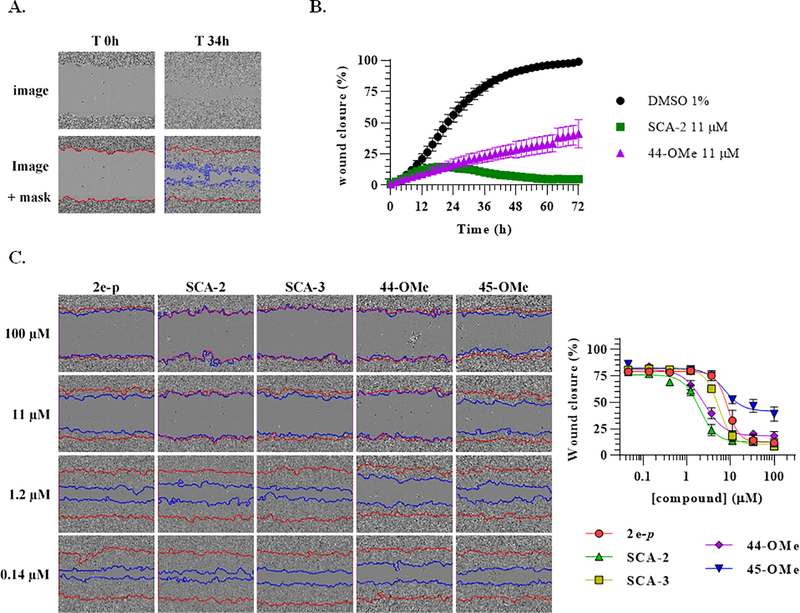
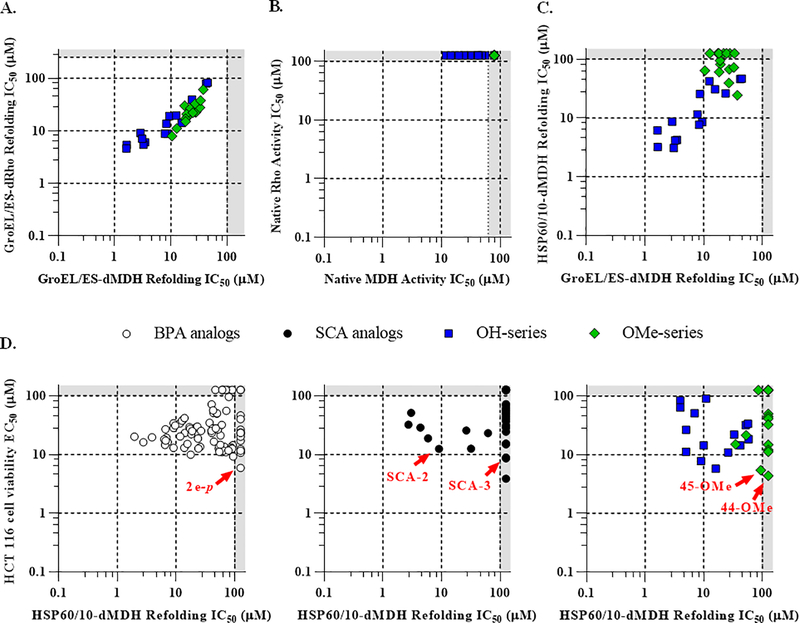
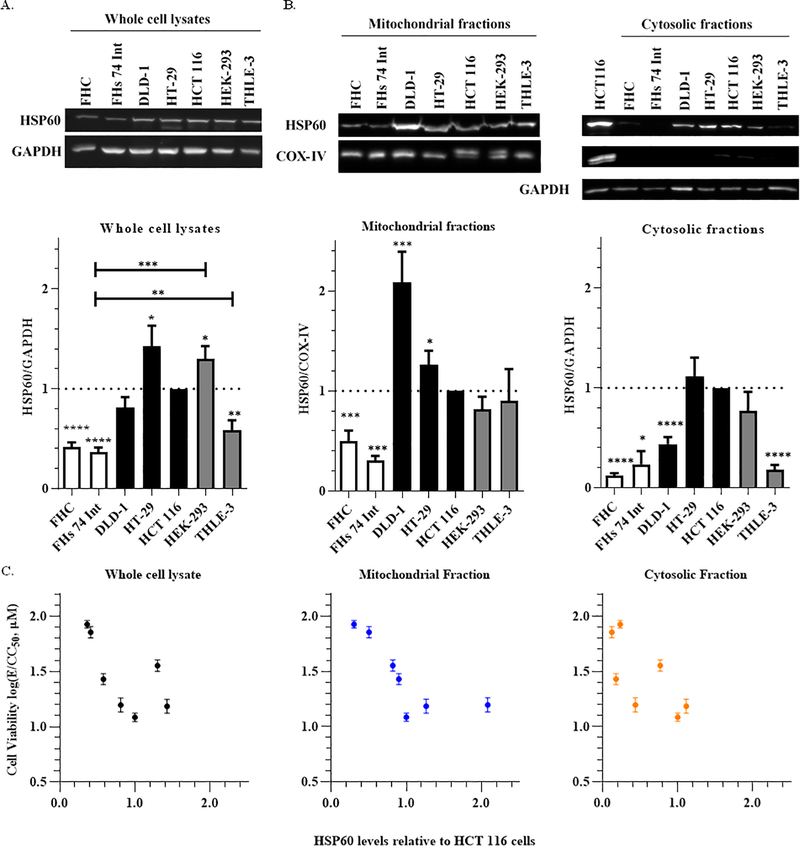
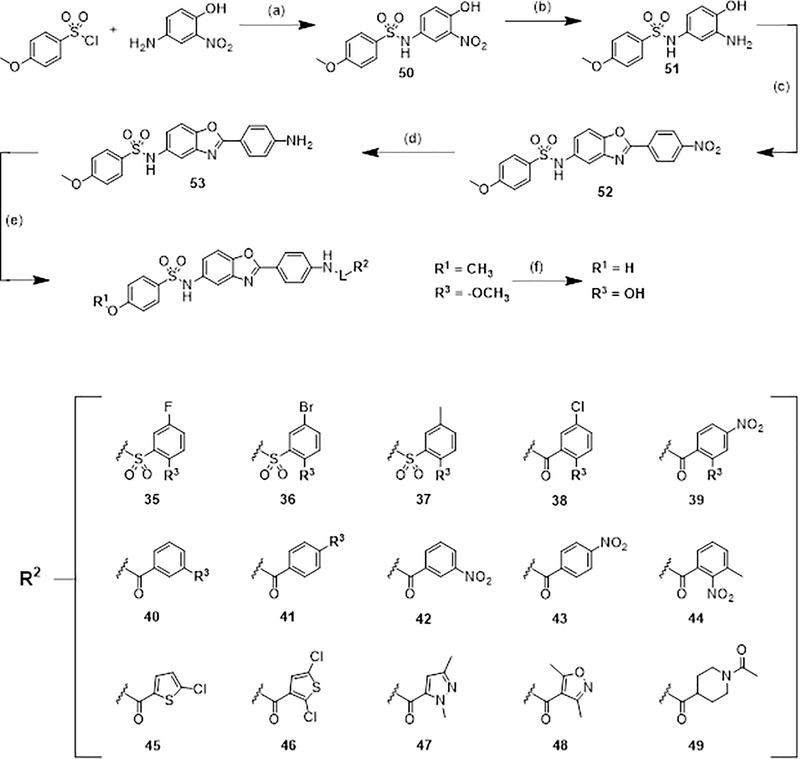
Over the past few decades, an increasing variety of molecular chaperones have been investigated for their role in tumorigenesis and as potential chemotherapeutic targets; however, the 60 kDa Heat Shock Protein (HSP60), along with its HSP10 co-chaperone, have received little attention in this regard. In the present study, we investigated two series of our previously developed inhibitors of the bacterial homolog of HSP60/10, called GroEL/ES, for their selective cytotoxicity to cancerous over non-cancerous colorectal cells. We further developed a third "hybrid" series of analogs to identify new candidates with superior properties than the two parent scaffolds. Using a series of well-established HSP60/10 biochemical screens and cell-viability assays, we identified 24 inhibitors (14%) that exhibited > 3-fold selectivity for targeting colorectal cancer over non-cancerous cells. Notably, cell viability EC50 results correlated with the relative expression of HSP60 in the mitochondria, suggesting a potential for this HSP60-targeting chemotherapeutic strategy as emerging evidence indicates that HSP60 is up-regulated in colorectal cancer tumors. Further examination of five lead candidates indicated their ability to inhibit the clonogenicity and migration of colorectal cancer cells. These promising results are the most thorough analysis and first reported instance of HSP60/10 inhibitors being able to selectively target colorectal cancer cells and highlight the potential of the HSP60/10 chaperonin system as a viable chemotherapeutic target.

Keywords: Chaperonin; Chemotherapeutic; Colorectal cancer; GroEL; GroES; HSP10; HSP60; Molecular chaperone; Proteostasis; Small molecule inhibitors.


Conflict of interest statement

Declaration of Competing Interest

The authors declare the following competing financial interest(s): S.M.J. and E.C. are co-founders of BioEL Inc, which was formed to commercialize GroEL/ES inhibitors, stemming from research conducted in their laboratories, for antibacterial applications.

Declaration of interests

The authors declare the following financial interests/personal relationships which may be considered as potential competing interests:

Figures

Figure 1.
Figure 1.
A new series of hybrid analogs was developed based on the scaffolds of previously investigated bis-sulfonamido-2-phenylbenzoxazole (BSP) and salicylanilide (SCA) HSP60/10 inhibitors.
Figure 2.
Figure 2.. Cell cytotoxicity result analyses.
A. Correlation plots of inhibitor CC50 values against non-cancerous FHC colon (top panels) and FHs 74 Int intestine cells (bottom panels) compared to EC50 values against HCT 116 colorectal cancer cells: BSP analogs are shown in the left column (white circles), SCA analogs in the center column (black circles), and the hybrid analogs the right column (green diamonds for OMe-series and blue squares for OH-series). B. Violin plots of inhibitor selectivity indices (SI), which were calculated for each compound as the averages of the CC50 / EC50 ratios of the four non-cancerous cells compared to the HCT 116 cells. C. Correlation plot of EC50 values for inhibitors with SI >3, comparing the cytotoxicity of compounds to the DLD-1 (orange triangle) and HT-29 (purple triangle) compared to the HCT 116 colorectal cancer cells (Pearson correlation coefficient is 0.743 for DLD-1 and 0.642 for HT-29 cells, with p<0.0001 and 0.0007, respectively). Data points within the grey zones of the correlation plots indicate EC50 or CC50 were greater than the maximum concentrations tested (i.e. >100 μM). D. Quantitative analysis of apoptosis and death of HCT 116 cells (Annexin V-positive) induced by 48 h treatment of DMSO vehicle control or 100 μM of the indicated lead inhibitors. Results represent the mean and SD of four biological replicates: p ≤ 0.01 (**) and p ≤ 0.001 (***) compared to DMSO control treatment.
Figure 3.
Figure 3.
Structures of lead analogs with a selectivity index (SI) >3.
Figure 4.
Figure 4.. Examining the effects of lead analogs on colorectal cancer cell clonogenicity.
A. Representative images of colonies formed by colorectal cancer cells (DLD-1, HT-29, and HCT 116) treated with DMSO, 2e-p, SCA-2, SCA-3, 44-OMe and 45-OMe at two of the 5 concentrations tested. B. Magnification of representative images of colonies formed by DLD-1 cells treated with DMSO, 44-OMe, or 45-OMe at 50 μM. C. Dose-response analyses of the surviving fractions (top panel) and the size of formed colonies (bottom panel) for DLD-1, HT-29, and HCT 116 cells treated with DMSO, 2e-p, SCA-2, SCA-3, 44-OMe or 45-OMe. Data are presented as mean ± SEM of 4–5 independent experiments.
Figure 5.
Figure 5.. Examining the effects of lead analogs on colorectal cancer cell migration.
A. Representative phase contrast unaltered images (top) and masked images (bottom) of wound closure at 0 h (left) and 34 h (right). The initial wound masking (0 h) is represented in red and time-dependent wound masking in blue. B. Time-lapse curves of the percentage of wound closure measured over time for HCT 116 colorectal cancer cells treat with DMSO (black dots), SCA-2 at 11 μM (green squares), and 44-OMe at 11 μM (purple triangles). C. Representative images of wound closure by the different treatments at the time the DMSO-treated control cells had recovered 75% of the wound (left panel), with dose-response curves obtained plotted for each of the five lead analogs. All data represent mean ± SEM of at least 4 independent experiments.
Figure 6.
Figure 6.. Examining the effects of hybrid analogs on HSP60/10 and GroEL/ES-mediated refolding of denatured substrate proteins and correlations with cytotoxic effects on HCT 116 colorectal cancer cells.
Correlation plots of IC50 values obtained for the OMe-series (green diamonds) and OH-series (blue squares) compounds in the GroEL/ES-dMDH and the GroEL/ES-dRho refolding assay (panel A, Pearson correlation coefficient is 0.877, p<0.0001 for the OMe-series, and 0.938, p<0.0001 for the OH-series), the native MDH and native Rho activity counter-screens (panel B), and the GroEL/ES-dMDH and HSP60/10-dMDH refolding assays (panel C, Pearson correlation coefficient is 0.882, p<0.0001 for OH-series). D. Correlation plots of IC50 values obtained in HSP60/10-dMDH refolding assay and EC50 values obtained in AlamarBlue cytotoxicity assay on HCT 116 cells for BPA analogs (Spearman correlation coefficient is −0.07 with p>0.5), SCA analogs (Spearman correlation coefficient is 0.419 with p=0.004) and Hybrid analogs (Spearman correlation coefficient is −0.229 with p=0.41 for the OH-series and 0.109 with p=0.7 for the OMe-series). Compounds plotted in the grey zones represent IC50, EC50, or CC50 values greater than the maximum concentrations tested. Compounds exhibiting IC50 <1 μM in the chaperonin-mediated refolding assays are considered very potent and acting near stoichiometrically since the concentration of GroEL or HSP60 tetradecamers are 50 nM during the refolding cycles (i.e. 700 nM of GroEL or HSP60 monomeric subunits).
Figure 7.
Figure 7.. Expression and localization of HSP60 in CRC and non-cancerous cell lines, correlated with compound efficiency.
Representative Western blot images of HSP60, GAPDH, and COX-IV signals in non-cancerous colon (FHC) and intestine (FHs 74 Int) cells, colorectal cancer cells (DLD-1, HT-29, and HCT 116), and non-cancerous kidney (HEK-293) and liver (THLE-3) cells (upper panel) and quantification of the relative amounts of HSP60 using GAPDH (whole cell lysate A and cytosolic fractions B) and COX-IV (mitochondrial fractions B) as loading controls, then normalizing all cell line HSP60 levels to those determined for the HCT 116 colorectal cancer cells. Each bar represents the mean ± SEM of at least 5 independent experiments. C. Correlation plots between the log-transformed EC50 or CC50 values obtained for inhibitor cytotoxicity compared with the relative amount of HSP60 in the respective cell lines. Each data point represents a mean ± SEM (Spearman correlation factors are −0.7143 with p=0.088 for both the whole cell lysates and cytosolic fractions, and −0.8571 with p=0.024 for the mitochondrial fractions).
Scheme 1.
Scheme 1.
Synthesis of the BSP-SCA hybrid analogs and structures of the end-capping groups.a a Reagents and conditions: (a) CH2Cl2, rt (91%); (b) tin powder, 10% HCl in AcOH, rt (40%); (c) 4-nitrobenzaldehyde, NaHCO3, Na2SO4, THF, reflux to rt, then DDQ added (80%); (d) tin powder, 10% HCl in AcOH, rt (71%); (e) either R2-SO2Cl (35- to 37-OMe) or R2-COCl (38- to 49-OMe) in pyridine, CH2Cl2, rt.; (f) BBr3, DCM, rt.

Similar articles

Cited by

References

    1. Ferlay J; Ervik M; Lam F; Colombet M; Mery L; Pineros M; Znaor A; Soerjomataram I; Bray F Cancer Today (powered by GLOBOCAN 2018) http://publications.iarc.fr/Databases/Iarc-Cancerbases/Cancer-Today-Powe... (accessed Jul 11, 2019).
    1. Howlander N; Noone AM; Krapcho M; Miller D; Brest A; Yu M; Ruhl J; Tatalovich Z; Mariotto A; Lewis DR; et al. SEER Cancer Statistics Review 1975–2016. Natl. Cancer Institute. 2019, https://seer.cancer.gov/csr/1975_2016/.
    1. Wu J; Liu T; Rios Z; Mei Q; Lin X; Cao S Heat Shock Proteins and Cancer. Trends Pharmacol. Sci. 2017, 38 (3), 226–256. 10.1016/j.tips.2016.11.009. - DOI - PubMed
    1. Yun CW; Kim HJ; Lim JH; Lee SH Heat Shock Proteins: Agents of Cancer Development and Therapeutic Targets in Anti-Cancer Therapy. Cells 2019, 9 (1), 60. 10.3390/cells9010060. - DOI - PMC - PubMed
    1. Kampinga HH; Hageman J; Vos MJ; Kubota H; Tanguay RM; Bruford EA; Cheetham ME; Chen B; Hightower LE Guidelines for the Nomenclature of the Human Heat Shock Proteins. Cell Stress Chaperones 2009, 14 (1), 105–111. 10.1007/s12192-008-0068-7. - DOI - PMC - PubMed

Publication types

MeSH terms