

On forecasting the community-level COVID-19 cases from the concentration of SARS-CoV-2 in wastewater
- PMID: 33971608
- PMCID: PMC8084610
- DOI: 10.1016/j.scitotenv.2021.147451
On forecasting the community-level COVID-19 cases from the concentration of SARS-CoV-2 in wastewater
Abstract
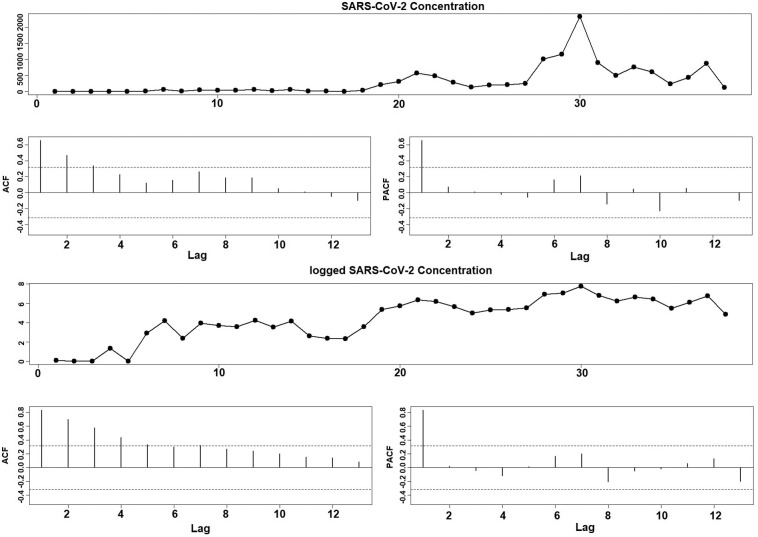
The building of an effective wastewater-based epidemiological model that can translate SARS-CoV-2 concentrations in wastewater to the prevalence of virus shedders within a community is a significant challenge for wastewater surveillance. The objectives of this study were to investigate the association between SARS-CoV-2 wastewater concentrations and the COVID-19 cases at the community-level and to assess how SARS-CoV-2 wastewater concentrations should be integrated into a wastewater-based epidemiological statistical model that can provide reliable forecasts for the number of COVID-19 infections and the evolution over time as well. Weekly variations on the SARS-CoV-2 wastewater concentrations and COVID-19 cases from April 29, 2020 through February 17, 2021 were obtained in Borough of Indiana, PA. Vector autoregression (VAR) model with different data forms were fitted on this data from April 29, 2020 through January 27, 2021, and the performance in three weeks ahead forecasting (February 3, 10, and 17) were compared with measures of Mean Absolute Error (MAE) and Mean Absolute Percentage Error (MAPE). A stationary block bootstrapping VAR method was also presented to reduce the variability in the forecasting values. Our results demonstrate that VAR(1) estimated with the logged data has the best interpretation of the data, but a VAR(1) estimated with the original data has a stronger forecasting ability. The forecast accuracy, measured by MAPE, for 1 week, 2 weeks, and 3 weeks in the future can be as low as 11.85%, 8.97% and 21.57%. The forecasting performance of the model on a short time span is unfortunately not very impressive. Also, a single increase in the SARS-CoV-2 concentration can impact the COVID-19 cases in an inverted-U shape pattern with the maximum impact occur in the third week after. The flexibility of this approach and easy-to-follow explanations are suitable for many different locations where the wastewater surveillance system has been implemented.
Keywords: COVID-19; Community wastewater surveillance; Forecasting; SARS-CoV-2.
Copyright © 2021 Elsevier B.V. All rights reserved.
Conflict of interest statement
Declaration of competing interest The authors declare that they have no known competing financial interests or personal relationships that could have appeared to influence the work reported in this paper.
Figures


References
-
- Alvarez-De-Toledo P., Marquez A.C., Nunez F., Usabiaga C. Introducing VAR and SVAR predictions in system dynamics models. Int. J. Simul. Process. Model. 2008;4(1):7–17.
-
- Breiman L. Bagging predictors. Springer Mach. Learn. 1996;24(2):123–140. doi: 10.1007/BF00058655. - DOI
-
- Duvallet, Claire, Kyle McElroy, Noriko Endo, Max Imakaev, Róisín Floyd-O'Sullivan, Morgan M Powell, Samuel Mendola, Francis Cruz, Tamar Melman, Eric Alm, Timothy Erickson, MD Newsha Ghaeli, Peter Chai, Mariana Matus. 2021. Nationwide Trends in COVID-19 Cases and SARS-CoV-2 Wastewater Concentrations in the United States. preprints. - PMC - PubMed
-
- Eraker, Bjørn, Ching Wai (Jeremy) Chiu, Andrew T. Foerster, Tae Bong Kim, Hernán D. Seoane, 2015. Bayesian mixed frequency VARs, J. Finan. Econ., Volume 13, Issue 3, Pages 698–721, doi: 10.1093/jjfinec/nbu027. - DOI
-
- Graham K.E., Loeb S.K., Wolfe M.K., Catoe D., Sinnott-Armstrong N., Kim S., Yamahara K.M., Sassoubre L.M., Mendoza Grijalva L.M., Roldan-Hernandez L., Langenfeld K., Wigginton K.R., Boehm A.B. SARS-CoV-2 RNA in wastewater settled solids is associated with COVID-19 cases in a large urban sewershed. Environ. Sci. Technol. 2021;55(1):488–498. doi: 10.1021/acs.est.0c06191. - DOI - PubMed
MeSH terms
Substances
LinkOut - more resources
Full Text Sources
Other Literature Sources
Medical
Miscellaneous
