

Discovery and validation of novel protein markers in mucosa of portal hypertensive gastropathy
- PMID: 33971821
- PMCID: PMC8111717
- DOI: 10.1186/s12876-021-01787-5
Discovery and validation of novel protein markers in mucosa of portal hypertensive gastropathy
Abstract
Background: Portal hypertension induced esophageal and gastric variceal bleeding is the main cause of death among patients of decompensated liver cirrhosis. Therefore, a standardized, biomarker-based test, to make an early-stage non-invasive risk assessment of portal hypertension, is highly desirable. However, no fit-for-purpose biomarkers have yet been identified.
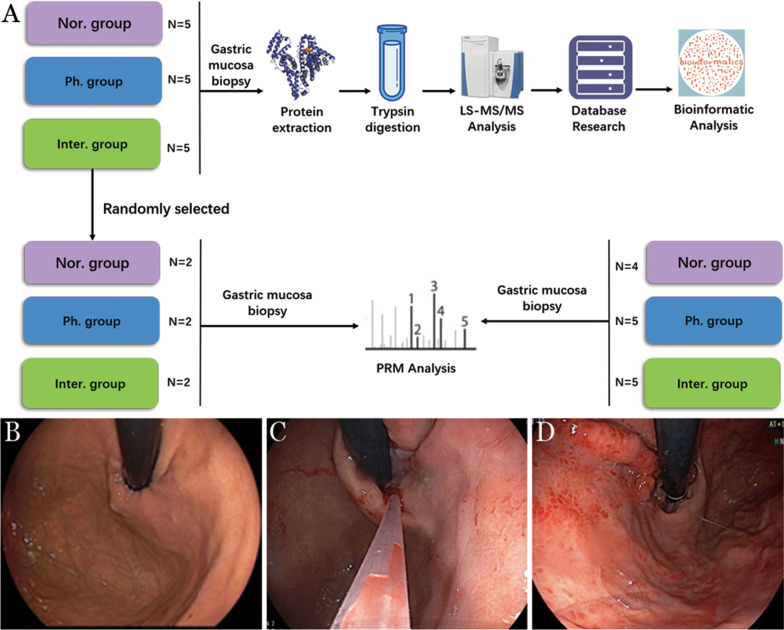
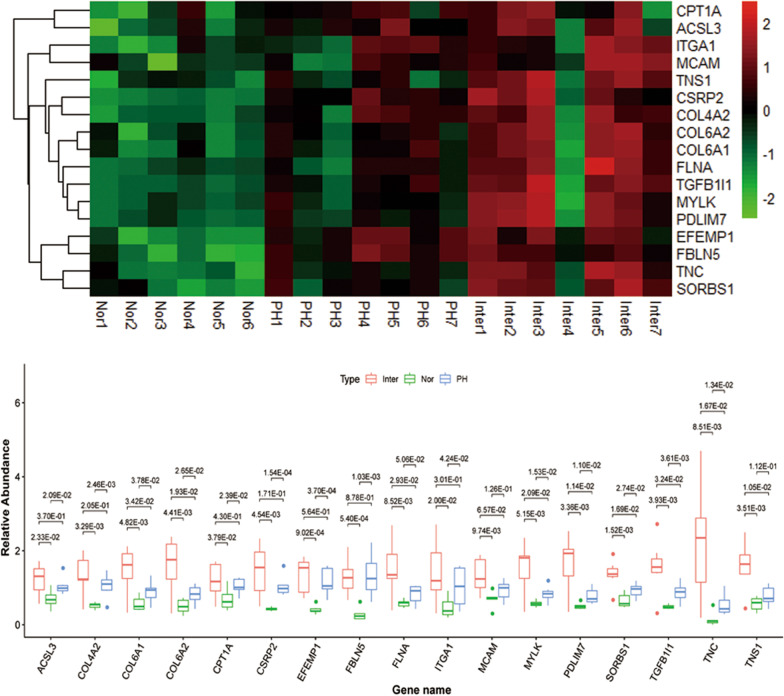
Methods: We conducted a pilot study consisting of 5 portal hypertensive gastropathy (PHG) patients and 5 normal controls, sampling the gastric mucosa of normal controls and PHG patients before and after endoscopic cyanoacrylate injection, using label-free quantitative (LFQ) mass spectrometry, to identify potential biomarker candidates in gastric mucosa from PHG patients and normal controls. Then we further used parallel reaction monitoring (PRM) to verify the abundance of the targeted protein.
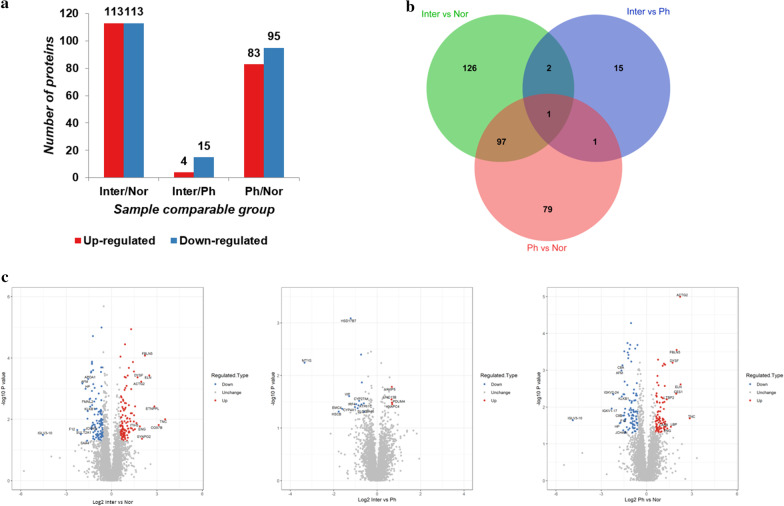
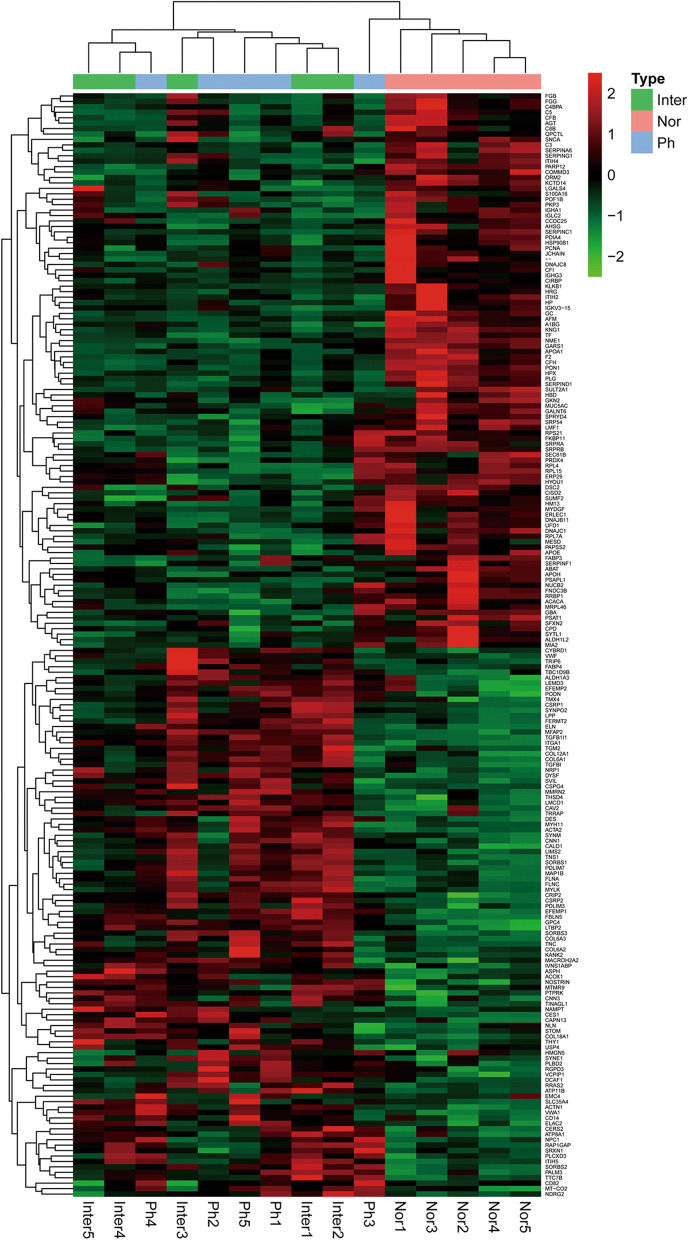
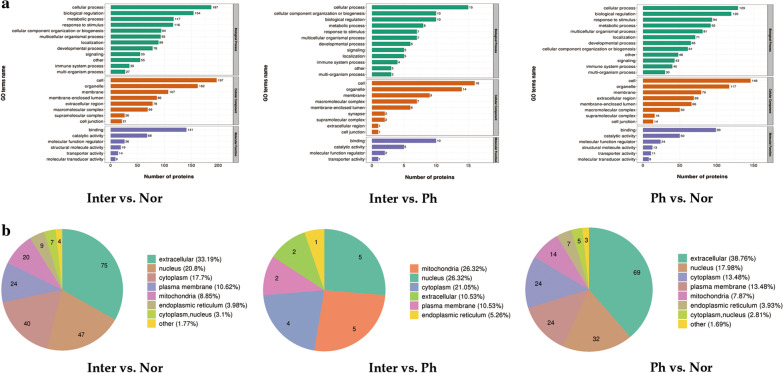
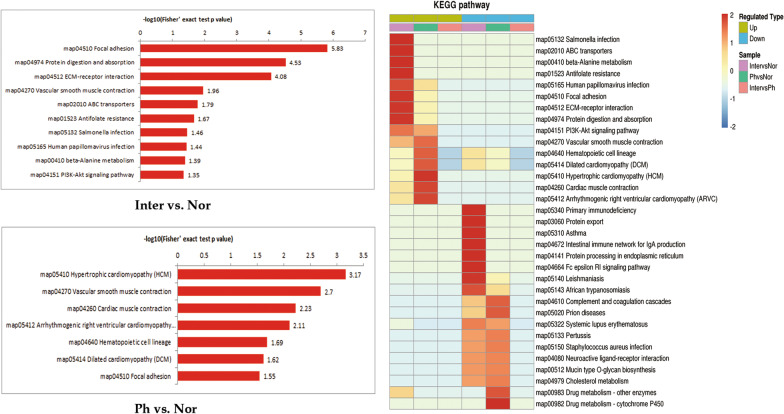
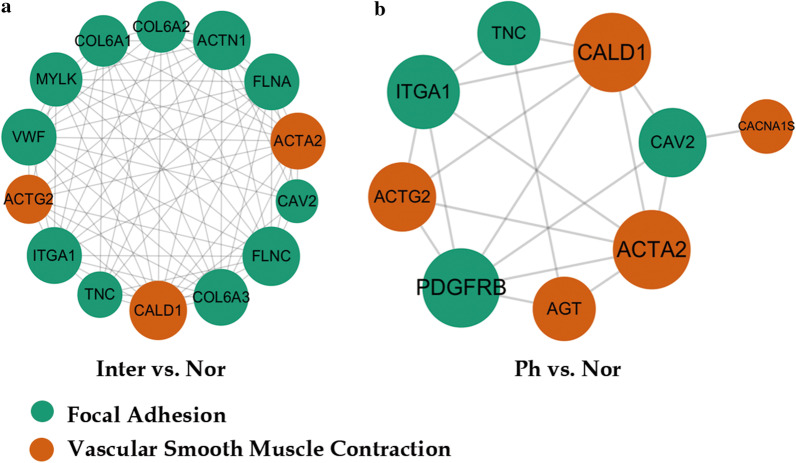
Results: LFQ analyses identified 423 significantly differentially expressed proteins. 17 proteins that significantly elevated in the gastric mucosa of PHG patients were further validated using PRM.
Conclusions: This is the first application of an LFQ-PRM workflow to identify and validate PHG-specific biomarkers in patient gastric mucosa samples. Our findings lay the foundation for comprehending the molecular mechanisms of PHG pathogenesis, and provide potential applications for useful biomarkers in early diagnosis and treatment. Trial registration and ethics approval: Trial registration was completed (ChiCTR2000029840) on February 25, 2020. Ethics Approvals were completed on July 17, 2017 (NYSZYYEC20180003) and February 15, 2020 (NYSZYYEC20200005).
Keywords: Biomarker; Label-free quantitative mass spectrometry; Liver cirrhosis; Parallel reaction monitoring; Portal hypertension gastropathy; Proteomics.
Conflict of interest statement
The authors declare that they have no competing interests.
Figures
Similar articles
-
Clinical, laboratory, and hemodynamic parameters in portal hypertensive gastropathy: a study of 254 cirrhotics.J Clin Gastroenterol. 2010 Apr;44(4):294-300. doi: 10.1097/MCG.0b013e3181b37ea1. J Clin Gastroenterol. 2010. PMID: 19730114
-
[Portal hypertensive gastropathy in patients with cirrhosis of the liver].Recenti Prog Med. 2001 Dec;92(12):735-40. Recenti Prog Med. 2001. PMID: 11822093 Italian.
-
Underlying mechanism of portal hypertensive gastropathy in cirrhosis: a hemodynamic and morphological approach.J Gastroenterol Hepatol. 2009 Sep;24(9):1541-6. doi: 10.1111/j.1440-1746.2009.05871.x. J Gastroenterol Hepatol. 2009. PMID: 19743998
-
[Portal hypertensive gastropathy].Ugeskr Laeger. 1995 Nov 13;157(46):6421-5. Ugeskr Laeger. 1995. PMID: 7483098 Review. Danish.
-
Portal hypertensive gastropathy.Rom J Intern Med. 2005;43(1-2):3-8. Rom J Intern Med. 2005. PMID: 16739861 Review.
Cited by
-
Serum proteomic profiling of patients with compensated advanced chronic liver disease with and without clinically significant portal hypertension.PLoS One. 2024 Apr 11;19(4):e0301416. doi: 10.1371/journal.pone.0301416. eCollection 2024. PLoS One. 2024. PMID: 38603681 Free PMC article.
References
MeSH terms
Substances
LinkOut - more resources
Full Text Sources
Other Literature Sources
Medical
