Modeling the impact of COVID-19 on Retina Clinic Performance
- PMID: 33971832
- PMCID: PMC8107774
- DOI: 10.1186/s12886-021-01955-x
Modeling the impact of COVID-19 on Retina Clinic Performance
Abstract
Background: COVID-19, a highly contagious respiratory virus, presents unique challenges to ophthalmology practice as a high-volume, office-based specialty. In response to the COVID-19 pandemic, many operational changes were adopted in our ophthalmology clinic to enhance patient and provider safety while maintaining necessary clinical operations. The aim of this study was to evaluate how measures adopted during the pandemic period affected retina clinic performance and patient satisfaction, and to model future clinic flow to predict operational performance under conditions of increasing patient and provider volumes.
Methods: Clinic event timestamps and demographics were extracted from the electronic medical records of in-person retina encounters from March 15 to May 15, 2020 and compared with the same period in 2019 to assess patient flow through the clinical encounter. Patient satisfaction was evaluated by Press Ganey patient experience surveys obtained from randomly selected outpatient encounters. A discrete-events simulation was designed to model the clinic with COVID-era restrictions to assess operational performance under conditions of increasing patient and provider volumes.
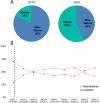
Results: Retina clinic volume declined by 62 % during the COVID-19 health emergency. Average check-in-to-technician time declined 79 %, total visit length declined by 46 %, and time in the provider phase of care declined 53 %. Patient satisfaction regarding access nearly doubled during the COVID-period compared with the prior year (p < 0.0001), while satisfaction with overall care and safety remained high during both periods. A model incorporating COVID-related changes demonstrated that wait time before rooming reached levels similar to the pre-COVID era by 30 patients-per-provider in a 1-provider model and 25 patients-per-provider in a 2-provider model (p < 0.001). Capacity to maintain distancing between patients was exceeded only in the two 2-provider model above 25 patients-per-provider.
Conclusions: Clinic throughput was optimized in response to the COVID-19 health emergency. Modeling these clinic changes can help plan for eventual volume increases in the setting of limits imposed in the COVID-era.
Keywords: COVID-19; Discrete‐event simulation; Health Services Research; Outpatient; Patient flow.
Conflict of interest statement
The authors declare that they have no competing interests.
Figures


References
-
- Goldblatt J, Roh S, Sethi K, Ramsey DJ. Enhancing safety and performance in the COVID-19 era: strategies and modifications that may become the standard of care in ophthalmology practice. Ophthalmol Manag. 2020;24:E2.
-
- Chodosh J, Holland GN, Yeh S. Important coronavirus updates for ophthalmologists. American Academy of Ophthalmology. https://www.aao.org/headline/alert-important-coronavirus-context. Published May 11, 2020.Accessed 16 May 2020.
-
- Release P. Baker-Polito administration announces emergency actions to address COVID-19. https://www.mass.gov/news/baker-polito-administration-announces-emergenc.... Published March 15, 2020. Accessed 28 April 2020.
-
- COVID-19 Map. Johns Hopkins Coronavirus Resource Center https://coronavirus.jhu.edu/map.html. Updated June 7, 2020. Accessed 7 June 2020.
MeSH terms
LinkOut - more resources
Full Text Sources
Other Literature Sources
Medical

