. 2021 May 10;22(1):145.
doi: 10.1186/s13059-021-02362-7.

SpatialDWLS: accurate deconvolution of spatial transcriptomic data

Affiliations

SpatialDWLS: accurate deconvolution of spatial transcriptomic data

Rui Dong et al. Genome Biol. .

Abstract

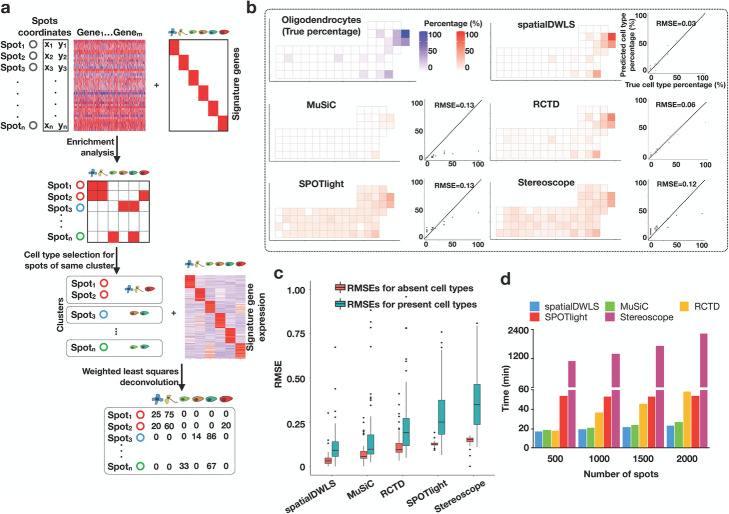
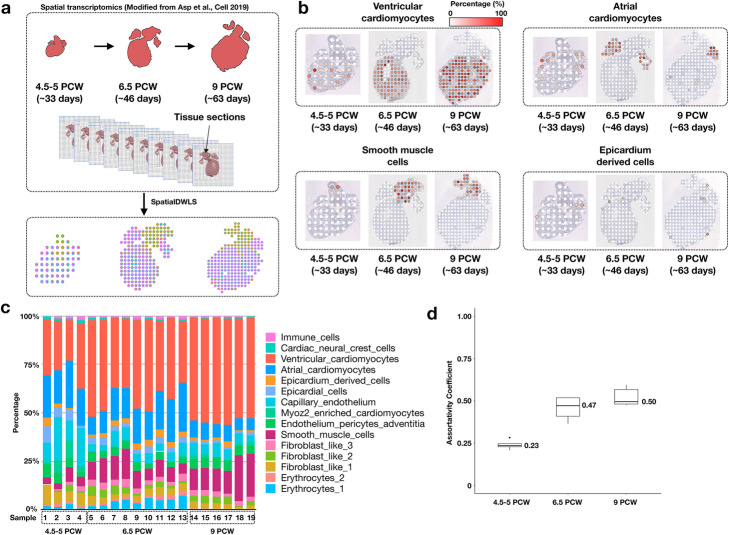
Recent development of spatial transcriptomic technologies has made it possible to characterize cellular heterogeneity with spatial information. However, the technology often does not have sufficient resolution to distinguish neighboring cell types. Here, we present spatialDWLS, to quantitatively estimate the cell-type composition at each spatial location. We benchmark the performance of spatialDWLS by comparing it with a number of existing deconvolution methods and find that spatialDWLS outperforms the other methods in terms of accuracy and speed. By applying spatialDWLS to a human developmental heart dataset, we observe striking spatial temporal changes of cell-type composition during development.

Keywords: Deconvolution; Single cell; Spatial transcriptomics.


Conflict of interest statement

The authors declare that they have no competing interests.

Figures

Fig. 1
Fig. 1
An overview of the spatialDWLS method. a A schematic representation of the spatialDWLS workflow. The input contains a spatial transcriptomic dataset (gene expression matrix and cell location coordinates) and a set of known cell-type specific gene signatures. For each spot, the cell types that are likely to be present are identified by using cell-type enrichment analysis. Then, a modified DWLS method is applied to infer cell type position at each spot. b Comparison of the accuracy of different deconvolution methods. Single-cell resolution seqFISH+ data are coarse-grain averaged to generate lower-resolution spatial transcriptomic data. The true frequency of a cell-type (indicated as blue squares in the top left panel) at each spot is compared with the inferred frequency (indicated as red squares in the five other panels) by using different methods. The relationship is also represented as a scatter plot, with x-axis representing the true frequency and the y-axis representing the inferred frequency. The overall performance is quantified as the root mean square error (RMSE). The oligodendrocyte cell-type is used here as a representative example. c The overall RMSE error is further decomposed into two components, corresponding to regions where the cell type is absent (red) and present (green), respectively. d Comparison of the computing speed of different methods. Running times for analyzing a mouse brain Visium dataset are shown
Fig. 2
Fig. 2
Deconvolution analysis identifies spatial-temporal change of cell-type composition during human heart development. a A schematic overview of the analysis. Spatial Transcriptomic data for developing heart were collected at three developmental stages by Asp et al. 2019. In parallel, single-cell RNAseq analysis was carried out to identify cell-type specific gene signatures. The spatialDWLS method was applied to infer the distribution of different cell-types across developmental stages. b The resulting estimates of the spatial distribution of different cell types. One representative sample was selected from each developmental stage. c A summary of the cell-type composition for all samples grouped by the corresponding developmental stages. d The assortativity analysis indicates an increased level of spatial clustering among similar cell types during heart development

References

    1. Eng CL, Lawson M, Zhu Q, Dries R, Koulena N, Takei Y, Yun J, Cronin C, Karp C, Yuan GC, Cai L. Transcriptome-scale super-resolved imaging in tissues by RNA seqFISH. Nature. 2019;568(7751):235–239. doi: 10.1038/s41586-019-1049-y. - DOI - PMC - PubMed
    1. Rodriques SG, Stickels RR, Goeva A, Martin CA, Murray E, Vanderburg CR, Welch J, Chen LM, Chen F, Macosko EZ. Slide-seq: a scalable technology for measuring genome-wide expression at high spatial resolution. Science. 2019;363(6434):1463–1467. doi: 10.1126/science.aaw1219. - DOI - PMC - PubMed
    1. Wang X, Allen WE, Wright MA, Sylwestrak EL, Samusik N, Vesuna S, Evans K, Liu C, Ramakrishnan C, Liu J, Nolan GP, Bava FA, Deisseroth K. Three-dimensional intact-tissue sequencing of single-cell transcriptional states. Science. 2018;361(6400):eaat5691. doi: 10.1126/science.aat5691. - DOI - PMC - PubMed
    1. Stahl PL, Salmen F, Vickovic S, Lundmark A, Navarro JF, Magnusson J, Giacomello S, Asp M, Westholm JO, Huss M, et al. Visualization and analysis of gene expression in tissue sections by spatial transcriptomics. Science. 2016;353(6294):78–82. doi: 10.1126/science.aaf2403. - DOI - PubMed
    1. Moffitt JR, Hao J, Bambah-Mukku D, Lu T, Dulac C, Zhuang X. High-performance multiplexed fluorescence in situ hybridization in culture and tissue with matrix imprinting and clearing. Proc Natl Acad Sci U S A. 2016;113(50):14456–14461. doi: 10.1073/pnas.1617699113. - DOI - PMC - PubMed

Publication types